
記住我


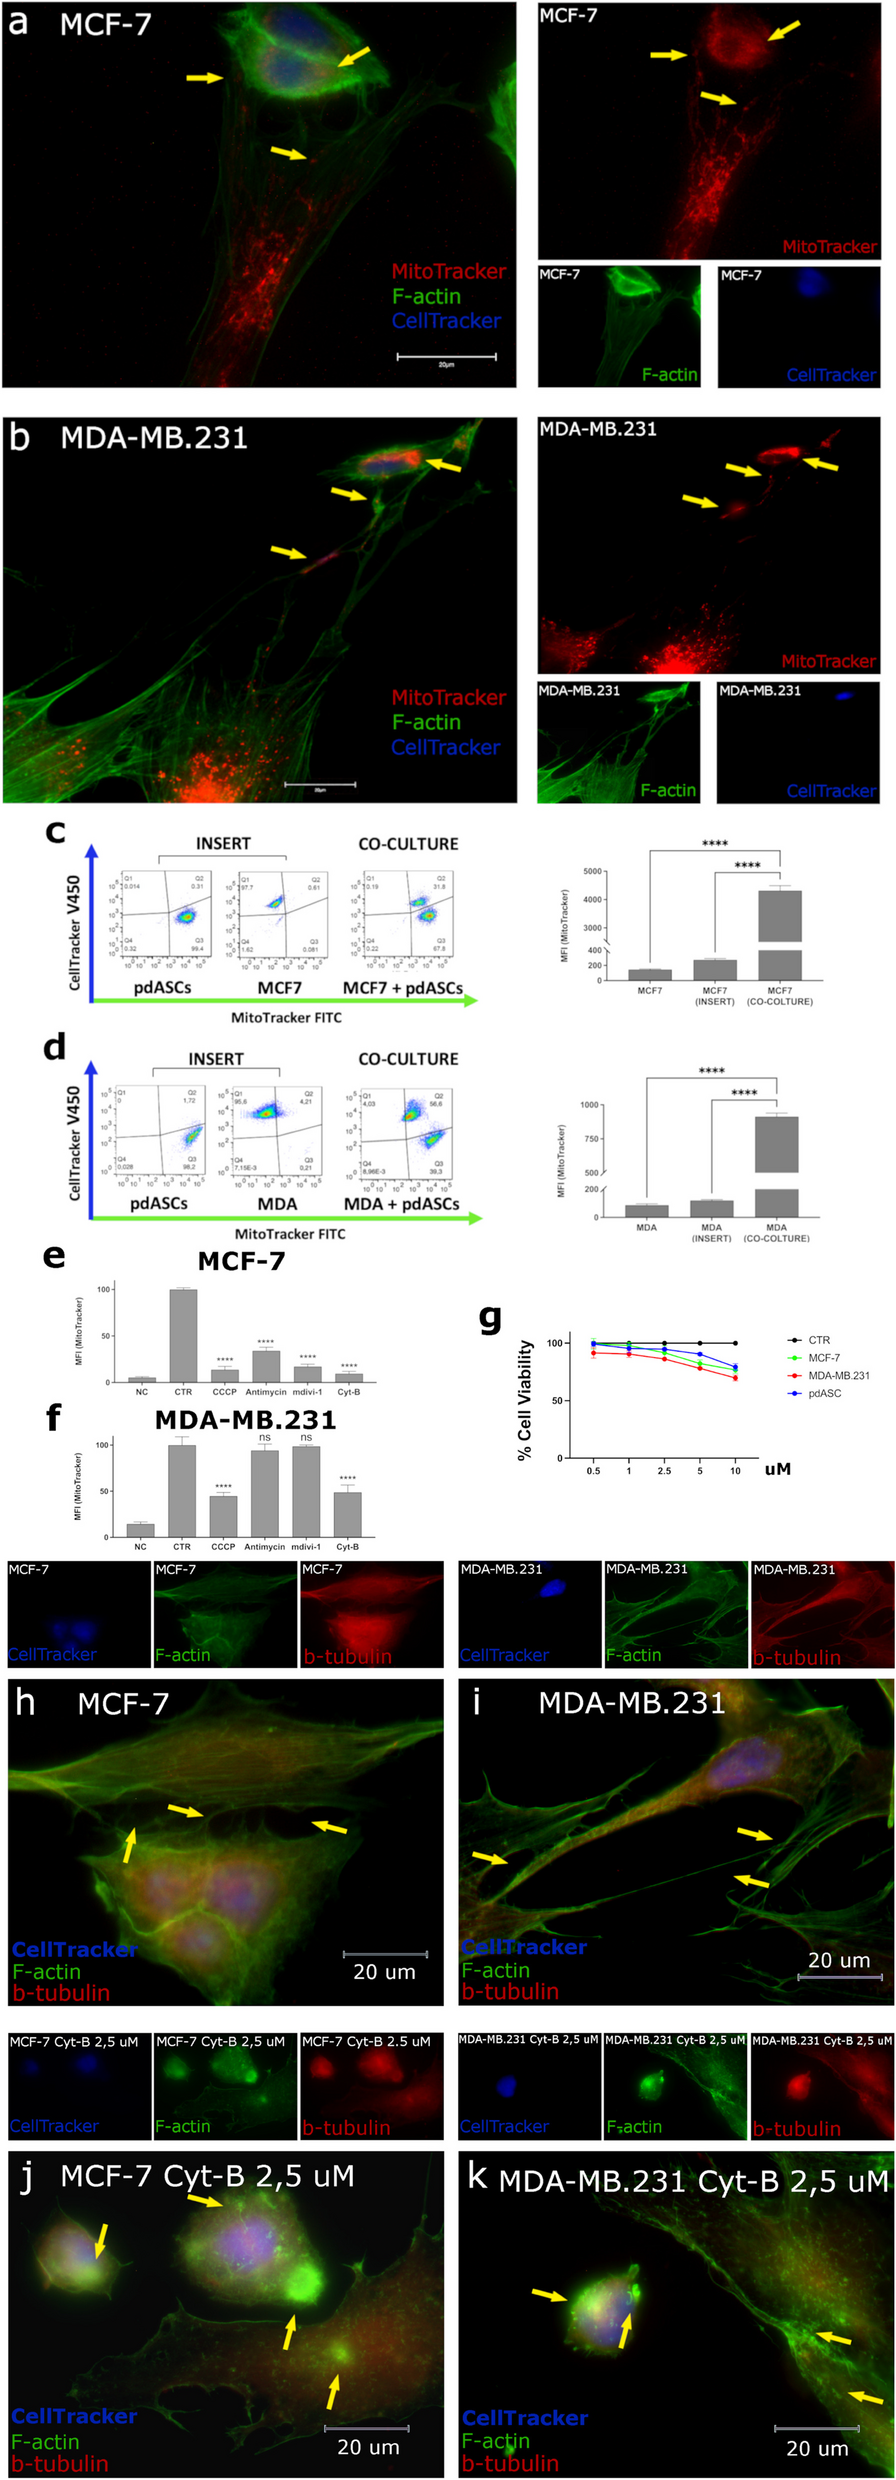


MT was evaluated co-culturing pdASCs with luminal MCF7 and triple negative MDA-MB.231. pdASCs were isolated from human adipose tissue, on the basis of their phenotype: CD90+CD34+CD29+CD105+CD44+CD90+CD324−CD45−CD19−HLA-DR− (Supplementary Fig. 1a) [19]. We showed that pdASCs mitochondria were transferred to BCCs through a complex communication network of TNTs. These are pdASCs scaffolded cell membrane projections, F-actin and β-tubulin positive, very rich in mitochondria along their entire length. Through these structures, pdASCs vehiculate their pre-labelled (MitoTracker-FITC/PE) mitochondria to pre-labelled (CellTracker-DAPI) BCCs. The exogenous pre-labelled mitochondria were observed in MCF-7 (Fig. 1a) and MDA-MB.231 (Fig. 1b), 24 h after the co-culture (Fig. 1a-b yellow arrows) and quantified by FACS analysis (Fig. 1c-d; Supplementary Fig. 1b-c) (****P ≤ 0.0001). The MT didn’t occur when the cells were physically separated by a multi-well cell culture inserts (Fig. 1c-d; Supplementary Fig. 1b-c).
Fig. 1
MT occurs between pdASCs and BCCs via TNTs and Actin polymerization inhibition disrupts TNTs inhibiting MT. a-b Fluorescence microscopy of pre-labelled MCF7 or MDA-MB.231 (CellTracker-Blue) and pre-stained pdASCs (MitoTracker-Red) with F-Actin (Phalloidin-FITC). The yellow arrows point-out the pdASC mitochondria along the TNTs and into recipient BCCs (100X; Fig. 1b is the merge of two fields of view, required for the capture of the entire TNTs length). c-d Flow cytometry analysis of the cell fluorescence, for the quantization of the MT occurring from the pre-stained MitoTracker-FITC pdASCs to the pre-labelled CellTracker-Blue MCF7 or MDA-MB.231. The co-culture has been set up in presence or not of a multi-well insert that avoided the cell-to-cell contact (****P ≤ 0.0001). e–f Flow cytometry analysis of the pdASCs mitochondria fluorescence, into the recipient BCCs subset, after treatment with Antimycin A (100 nM), Cyt-B (2,5 uM), CCCP (5 uM) and MdiVi-1 (10 uM). g MTT assay for the evaluation of the viability of the cells used, in our co-culture system, after treatment with Cyt-B. For all the cell lines, the viability rate at 2,5 uM was higher than 85%. h-i Fluorescence microscopy of the co-culture with CellTracker-Blue pre-labelled MCF7 or j-k MDA-MB.231, for the detection of the F-Actin (FITC) and β-Tubulin (TRITC) in presence of Cyt-B (2,5 uM). The yellow arrows point-out the TNTs structures between the two kinds of cells (h-i) or the cytoplasmic F-actin aggregates (j-k) in both BCCs and pdASCs. (****P ≤ 0.0001)
Thereafter, exploring ways to inhibit MT, we treated both co-culture models with (i) Carbonyl Cyanide m-Chlorophenyl hydrazine (CCCP 5 µM) or (ii) Antimycin-A (0.1 µM), two different mitochondria respiration inhibitors, (iii) Mitochondrial division inhibitor-1 (MdiVi-1 10 µM), that inhibits Drp1, and (iv) Cytochalasin B (Cyt-B 2.5 µM), an actin polymerization inhibitor. We found that MdiVi-1 and Antimycin-A significantly reduced MT in MCF-7 (****P ≤ 0.0001). Furthermore, CCCP inhibited MT (****P ≤ 0.0001), but the effect was more evident in MCF-7 (%MFI = 13.6%) than in MDA-MB.231 (%MFI = 44.7%) (Fig. 1e-f; Supplementary Fig. 1d-e). Also, the actin polymerization inhibitor Cyt-B blocked MT (****P ≤ 0.0001) at sub-lethal doses (Fig. 1g), although MCF-7 were more sensitive (%MFI = 9.5% vs 48.7%, respectively).
Cyt-B very efficiently inhibited TNTs scaffolding (Fig. 1h-k), with dramatic effects on cell morphology. Indeed, cells’ structural collapsing was detected, with smaller appearance, more rounded shape, many membrane invaginations and accumulation of F-actin aggregates in the cytoplasm (Fig. 1j-k). Consequently, cells unable to scaffold the actin-based TNTs could not contact each other, and this impeded MT.
MT occurs in patient-derived primary cultures and organoidsWe verified that MT also occurs between pdASCs and the patient-derived breast cancer models BCAHC-1 and BCC-66. Interestingly, we observed the formation of TNTs between pdASCs and primary BCAHC-1 cells, through which mitochondria were vehiculated towards the BCAHC-1 cells (Fig. 2a, yellow arrows); the mechanism was also confirmed by FACS analysis (Fig. 2b; Supplementary Fig. 2a). Moreover, MT rate was significantly reduced by CCCP 5 µM (%MFI = 39,3%) and even more by Cyt-B (%MFI = 27,2%) at sub-lethal doses (Fig. 2c-d; Supplementary Fig. 2b). Notably, Cyt-B blocked TNTs scaffolding, structurally made of F-actin and β-Tubulin, as observed previously (Fig. 2e-f, yellow arrows). These profound morphological changes affected the cell–cell contact, significantly reducing MT.
Fig. 2
MT occurs both between pdASCs and human primary 2D and 3D cell models. a Fluorescence microscopy (magnification 100X) of pre-labelled BCAHC-1 (CellTracker-Blue) and pre-stained pdASCs (MitoTracker-Red) with F-Actin (Phalloidin-FITC). Yellow arrows point-out the pdASC mitochondria along the TNTs and into recipient BCAHC-1 cell. b Flow cytometry analysis of the cell fluorescence, for the quantization of the MT occurring from the pre-stained MitoTracker-FITC pdASCs to the pre-labelled CellTracker-Blue BCAHC-1. The co-culture has been set up in presence or not of a multi-well insert that avoided the cell-to-cell contact (****P ≤ 0.0001). c MT inhibition in co-culture between pdASCs and BCAHC-1. Flow cytometry analysis of the pdASCs mitochondria fluorescence, into the recipient BCAHC-1 subset, after treatment with Antimycin A (100 nM), Cyt-B (2,5 uM), CCCP (5 uM) and MdiVi-1 (10 uM) d MTT assay for the evaluation of the BCAHC-1 viability after treatment with Cyt-B. e–f Fluorescence microscopy of the co-culture with CellTracker-Blue pre-labelled BCAHC-1, for the detection of the F-Actin (FITC) and β-Tubulin (TRITC) in presence of Cyt-B (2,5 uM). The yellow arrows point-out the TNTs structures between the two kinds of cells (e) or the cytoplasmic F-actin aggregates (f) in both BCAHC-1 and pdASCs. (****P ≤ 0.0001). g Confocal microscopy 3D orthogonal reconstruction, z-stack technology of a 2D/3D hybrid coculture shows the pre-labelled BCC-66 (CellTracker-Blue) and pre-stained pdASCs (MitoTracker-Red) with F-Actin (Phalloidin-FITC). The white arrows in the YZ plane point-out that the pdASCs are in contact with the BCC-66 and the yellow arrow indicates the presence of exogenous mitochondria in the cytoplasm of BCC-66. h Flow cytometry analysis of the cell fluorescence, for the quantization of the MT occurring from the pre-stained MitoTracker-FITC pdASCs to the pre-labelled CellTracker-Blue BCC-66, also after treatment with Cyt-B (2 uM). The co-culture has been set up in presence or not of a multi-well insert that avoided the cell-to-cell contact
Furthermore, we studied MT in BCC-66 PDOs isolated from a luminal breast cancer patient. Preliminarily, we showed that BCC-66 shared the same genomic profile of the original patient tissue (Supplementary Fig. 2c). According to our previous results, we built a hybrid 2D/3D co-culture between BCC-66, freed from BME, and pdASCs. BCC-66 were able to contact pdASCs, and massively acquired mitochondria from them (Fig. 2g, yellow arrows), although we did not capture TNTs formation. 3D orthogonal Z-stack image reconstruction confirmed that the adherent pdASCs directly contact BCC-66 in suspension (Fig. 2g, white arrow). MT was confirmed by FACS, but only in case of physical contact between the cells (****P ≤ 0.0001). Conversely, Cyt-B 2 µM did not significantly inhibit MT (Fig. 2h; Supplementary Fig. 2d), indicating that, in this hybrid 2D/3D co-culture, other mechanisms depending on physical contact could mediate MT.
MitoCeption allows to increase mitochondria acquisitionTo better distinguish the selective effect of exogenous mitochondria transferred to BCCs, we employed the MitoCeption (MCP), a procedure used to force mitochondria internalization, derived from a donor into a recipient cell that functionally engulf and retain them in its cytoplasm. According to Caicedo et al. [21], we isolated and characterized mitochondria from both pdASCs and hTERT immortalized hASCs; then we transferred them to MCF-7 or MDA-MB.231 cells (Fig. 3a). After 24 h, MCP was validated by Z-stack orthogonal view reconstruction of confocal images. Here, we identified pdASC pre-labelled mitochondria (MitoTracker-red) spatially distributed in the cytoplasm of the BCCs (CellTracker-DAPI) (Fig. 3b). MCP efficiency was evaluated verifying mitochondria internalization by statistical analysis of the co-localization between the transferred pdASCs mitochondria and the recipient cells (Fig. 3c). After 24 h (T24h) mitochondria co-localized with cells, as shown by analysis of the not-random spatial correlation. Moreover, MDA-MB.231 were significantly more able to intake exogenous mitochondria than MCF-7 (****P ≤ 0.0001) (Fig. 3c).
Fig. 3
Construction and validation of MitoCeption model. a MCP assay workflow, from pdASCs/hASCs hTERT mitochondria-derived isolation to the forced engulfment into the BCCs. b Confocal microscopy 3D orthogonal reconstruction, with z-stack technology, of the pre-labelled CellTracker-Blue BCCs (MCF-7) after the MCP with MitoTracker-FITC pre-labelled pdASCs derived mitochondria (c) Fluorescence microscopy and spatial co-localization statistical analysis of BCCs and MitoTracker stained pdASCs derived mitochondria at time points 0 h and 24 h (Li’s ICQ value analysis normalized on the total cells area; ****P ≤ 0.0001)
Taken together, our results show that MCP allows to increase the efficiency of mitochondria uptake and that MDA-MB.231 acquire significantly more mitochondria than MCF-7.
ASCs-derived mitochondria potentiate BC multi-drug resistanceTo functionally characterize MT effect, we investigated the antitumoral activity of different chemotherapy agents on BCCs carrying exogenous mitochondria. Considering that the MCP significantly downregulated HIF-1α protein expression in the recipient BCCs (Fig. 4a; Supplementary Fig. 3a-b), we decided to adopt this condition in our experiments.
Fig. 4
MCP increases BCCs viability under chemotherapy treatment and impacts on their metabolism, modifying mitochondrial respiration. a HIF-1α expression analysis in BCCs subjected to MCP, in N-OX and H-OX conditions. The MCP significantly reverted the up-regulation of HIF-1α in the BCCs after their stimulation with the chemical hypoxia inducer cobalt chloride (100 uM). b-c Cell viability and apoptosis assay d-e of the BCCs subjected to MCP in different oxygen conditions, after treatment with the chemotherapeutic drugs DTX (50 nM) or CIS (10 uM) (*P ≤ 0.05, **P ≤ 0.01, ***P ≤ 0.001; ****P ≤ 0.0001). f-g SeaHorse ATP rate assay for the analysis of the mitochondrial respiration in MCF-7 and (h-i) MDA-MB.231, 24 hours after the MCP, in different oxygen conditions. The histograms represent the ATP production rate (pmol/min), calculated during the oxygen consumption phase (****P ≤ 0.0001)
Functionally, ASC-derived Mitochondria (ADM) significantly reduced the cytotoxicity of CIS (10 µM) and DTX (50 nM), after 24 h in both BCC lines (Fig. 4b-c).
Specifically, ADM was cytoprotective in MCF-7, towards both CIS (> 15%; **P ≤ 0.01) and DTX (> 11%; ***P ≤ 0.001) also in hypoxia (CIS > 33%; (*P ≤ 0.05-DTX > 22%; ***P ≤ 0.001) (Fig. 4b). Similarly, ADM protected MDA-MB.231 from CIS (> 15%; **P ≤ 0.01), with a milder effect in hypoxia (Fig. 4c). We obtained the same significant results towards DTX-induced cytotoxicity (*P ≤ 0.05), which was much stronger in hypoxia (> 60%; ****P ≤ 0.0001). Interestingly, the DTX resistance acquired by the ADM-carrying MCF-7, was due to their ability to modulate the apoptotic machinery, while we did not observe significant differences in the modulation of this mechanism after treatment with CIS (Fig. 4d; Supplementary Fig. 4a). Conversely, the cytoprotective effect mediated by ADM was very strong in hypoxia, towards both drugs. We showed the same effect also in ADM-carrying MDA-MB.231 (Fig. 4e; Supplementary Fig. 4b). Here, the DTX strongly promoted apoptosis, even in hypoxia, with a significant ADM-mediated reversion of the phenomenon.
Taken together, our results indicate that ADM increased MDR in BCCs preventing the induction of apoptosis, in both hypoxic and normoxic conditions.
ASCs-derived mitochondria induce an increase of ATP production in BCCsSince mitochondria play a pivotal role in energy homeostasis, we evaluated the effect of ADM on BCCs metabolism, via extracellular flux analysis. Here, ADM strongly upregulated ATP rate production, associated with mitochondrial respiration (ΔATP). Indeed, in ADM-carrying MCF-7 we found a significantly higher basal (OCR > 18%) and maximal respiration (OCR > 10%), with a relative increase of ATP production rate (ΔATP > 35 pmol/min; ****P ≤ 0.0001) (Fig. 4f). Furthermore, we found a significant reduction of the spare respiration (OCR < 18%), mainly due to the increased basal oxygen consumption rate mediated by ADM. On the contrary, in hypoxia ADM did not significantly influence basal nor maximal respiration, however the total oxygen consumption capacity was raised, leading to a relevant increase of ATP production (ΔATP > 27 pmol/min; ****P ≤ 0.0001) (Fig. 4g). In MDA-MB.231 the effect of ADM on mitochondrial metabolism was very similar. In these cells, the basal respiration was significantly increased after MCP (OCR > 12%), without any significant difference on the maximal respiration (Fig. 4h). Even in this case, ADM significantly reduced the spare respiration (OCR < 18%), due to basal oxygen consumption rate increasing, which led to the doubling of ATP production rate (ΔATP > 90 pmol/min; ****P ≤ 0.0001). In hypoxic MDA-MB.231 the respiratory capacity as well as the basal respiration didn’t significantly change after MCP (Fig. 4i). Nevertheless, both these parameters increased (OCR > 12%) contributing to significantly enhancing the ATP production rate (ΔATP > 47 pmol/min; ****P ≤ 0.0001). Taken together, our results indicate that ADM led to an increase in ATP production.
ASCs-derived mitochondria activate the ABC transporter-mediated drug effluxAs ATP-binding cassette (ABC) transporters are involved in BC MDR, we evaluated their role in our MCP model, focusing on P-gp, ABCG2 and ABCC1 [13] by fluorescence microscopy and FACS 8 h after the induction of hypoxia, and subsequent treatment with DOX. We chose DOX both to take advantage of its autofluorescence and because it is a backbone of chemotherapy treatment in BC [15].
In MCF-7, we observed that P-gp and ABCC1 expression increased after DOX treatment in both oxygen conditions, while ABCG2 increased after DOX only in normoxia (Fig. 5a-c; Supplementary Fig. 5). In MDA-MB.231 P-gp expression was increased after DOX (in both oxygen conditions) and in hypoxia only. ABCG2 was not influenced by hypoxia and increased only with DOX treatment in both oxygen conditions while ABCC1 only increased in normoxia after DOX treatment (Fig. 5d-f; Supplementary Fig. 5).
Fig. 5
ABC transporters expression is influenced by oxygen conditions and is upregulated under doxorubicin treatment. Flow cytometry (plots) and fluorescent microscopy analysis for the quantitative and qualitative evaluation of the P-gp, ABCG2 and ABCC1 expression, in MCF-7 (a-c) and MDA-MB.231 (d-f) 6 h after treatment with Doxorubicin (1 µM for MDA-MB.231; 2 µM for MCF-7), in N-OX or H-OX environment (*P ≤ 0.05, **P ≤ 0.01, ***P ≤ 0.001; ****P ≤ 0.0001)
Subsequently, we focused our attention on the possible effect of ADM on ABC transporters activity. Preliminarily, we evaluated DOX cytotoxicity on BCCs after MCP. Indeed, it induced an increase of cell viability parameters monitored with Holomonitor (***P ≤ 0.001), also in hypoxia (**P ≤ 0.01) (Supplementary Fig. 6a-b). In MDA-MB.231, we achieved the same results in normoxia (#cells/cm2 = ***P ≤ 0.001; %confluence = **P ≤ 0.01) and hypoxia (#cells/cm2 = **P ≤ 0.01; %confluence = *P ≤ 0.05) (Fig. 6a-d). Thereafter, we evaluated DOX cytoplasmic retention by measuring the DOXMFI. As expected, the ABC-transporter inhibitor VER increased DOX cytoplasmic accumulation [23]. Nevertheless, ATP metabolism was crucial in regulating the activity of these transporters. Indeed, in both oxygen conditions, the ATP synthesis inhibitor Rotenone strongly reduced ABC transporters efflux capacity, and this effect was significantly reverted by D-Glu (Fig. 6e-h; Supplementary Fig. 7). These results highlight that ABC transporter activity is strictly dependent on ATP availability, independently from cell respiration.
Fig. 6
MCP is protective in MDA-MB.231 treated with Doxorubicin and promotes the ABC efflux activity in BCCs. In MDA-MB.231 (a-b) treated with DOX (1 µM), the cell counts and confluence significantly increase after MCP in both N-OX (#cells/cm2 = ***P ≤ 0.001, %confluence = (**P ≤ 0.01), and H-OX (#cells/cm.2 = ***P ≤ 0.01, %confluence = (**P ≤ 0.05) environments. Live time-lapse microscopy (capture from movie) (c-d) of MDA-MB.231, shows the cell population growth differences after MCP in both N-OX and H-OX conditions from T0 to T24 at a single well point. The inhibition of the ABC transporter with VER (5 µM) significantly blocks the efflux capacity of P-gp and ABCG2, independently of the cell line and the oxygen levels. The MCF-7 (e–f) and MDA-MB.231 (g-h) have been cultured in N-OX or H-OX micro-environment, and subsequently treated with DOX (1 µM for MDA-MB.231; 2 µM for MCF-7) together with the metabolic regulators 2-DG (50 mM), and ROTENONE (50 µM). After 24 h, the DOX cell retention has been evaluated quantitatively and qualitatively by flow cytometry and fluorescent microscopy (*P ≤ 0.05, **P ≤ 0.01, ***P ≤ 0.001; ****P ≤ 0.0001)
In ADM-carrying MCF-7 we found a reduced DOX accumulation (DOXMFI < 16%; ***P ≤ 0.001), even after treatment with VER (DOXMFI < 9%; *P ≤ 0.05), not observed after treatment with Rotenone (Fig. 6e; Supplementary Fig. 7). Nevertheless, the administration of D-Glu again boosted the ADM-mediated effect (DOXMFI < 27%; ****P ≤ 0.0001). In hypoxia MCP was much more effective. In this condition, we demonstrated that ADM increased the drug efflux rate (DOXMFI < 18%; ***P ≤ 0.001), even in case of ABC-transporters inhibition with VER (DOXMFI < 35%; ****P ≤ 0.0001). Interestingly, although the Rotenone-mediated blockade of ATP synthesis affected cell detoxification ability, ADM significantly reverted this condition (DOXMFI < 27%; ****P ≤ 0.0001); the same effect was observed after treatment with D-Glu (DOXMFI < 26%; ****P ≤ 0.05) (Fig. 6f; Supplementary Fig. 7).
In MDA-MB.231 we found that ADM drove DOX resistance. Specifically, ADM significantly reduced DOX accumulation (DOXMFI < 18%; **P ≤ 0.01), while no significant effect was observed with VER. Again, the Rotenone mediated DOX accumulation was effectively counteracted by the MCP (*P ≤ 0.05). In MDA-MB.231 the effect of MCP was more evident in hypoxia. In this case, DOX cytoplasmic levels were significantly decreased (DOXMFI < 18%; ***P ≤ 0.001), also after the administration of VER (DOXMFI < 8%; ***P ≤ 0.001). Moreover, the modulation of ABC transporters activity by MCP was evident after treatment with rotenone (DOXMFI < 10%; **P ≤ 0.01), but not with D-Glu (Fig. 6g-h; Supplementary Fig. 7).
Taking all these results into consideration, we showed that ADM activated ABC transporters into both MCF7 and MDA-MB.231 cell lines, leading to a significant reduction of drug accumulation within the cytoplasm and escape from chemotherapy induced cytotoxicity.
留言 (0)