
記住我


In this section, we mainly describe the clinical dataset used in the experiment and all the details of our proposed method.
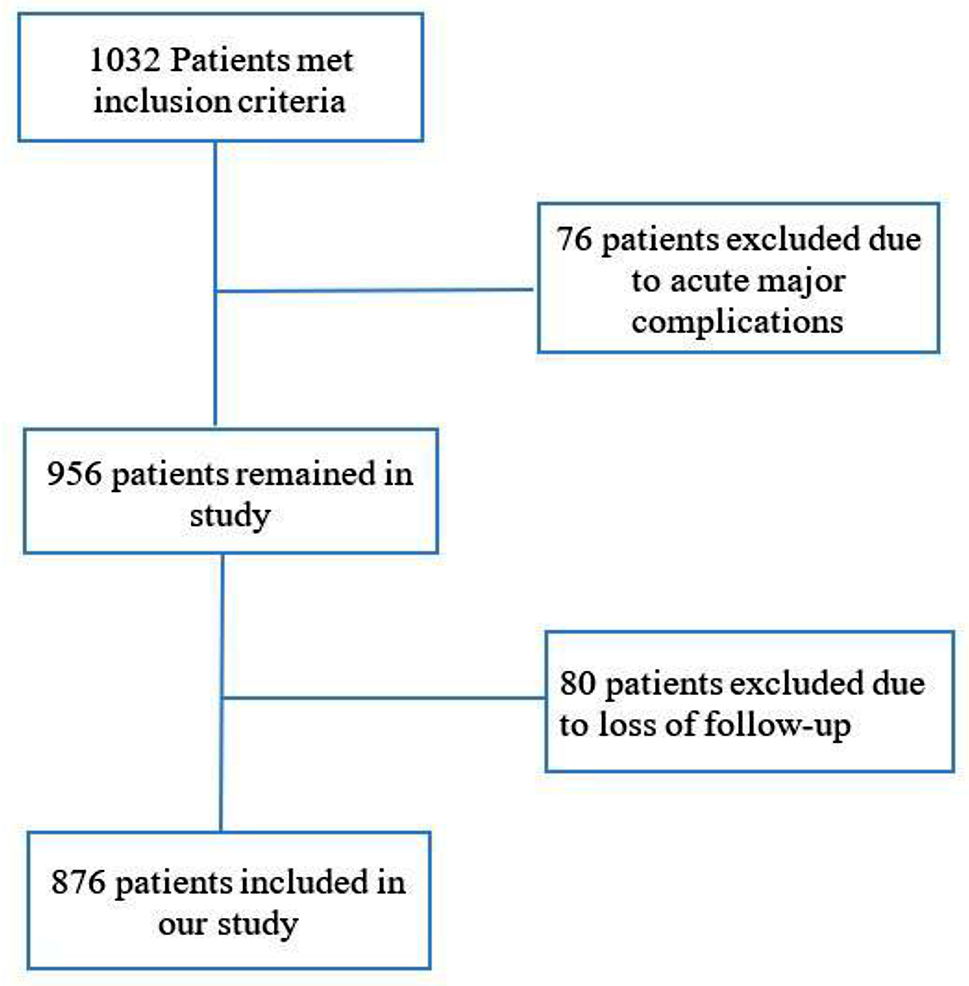
DatasetClinical data of patients were collected from the clinical data center and image center of the First Affiliated Hospital of Nanjing Medical University. The population of this study was first enrolled with hospitalized patients with diabetes who underwent cardiac computed tomography angiography (CCTA), and 647 hospitalized patients were retrieved from January 1st 2018 to May 31st 2022. Then, patients diagnosed with CHD before the onset of diabetes, patients who did not undergo CCTA prior to coronary stenting, patients with cancer or malignancy or type 1 diabetes, and patients with incomplete biochemical examination information, clinical history, and medication were excluded. A total of 258 + 221 patients were enrolled according to the exclusion criteria; 258 patients with both CHD and diabetes and 221 patients with diabetes but no CHD as controls were finally enrolled in this study. The flow diagram of this study is illustrated in Fig. 1. The study was approved by the Ethics Committee of the First Affiliated Hospital of Nanjing Medical University (2019-SR-153). As this study is a retrospective study and the contents of the study do not involve personal privacy, the Ethics Committee of the First Affiliated Hospital of Nanjing Medical University waived the requirement for written informed consent.
Fig. 1
The patient enrollment flow diagram
B. Statistical methodsThe statistical analysis was performed using R software version 4.1.2 (R Foundation for Statistical Computing, Vienna, Austria). Normality was checked by the Kolmogorov‒Smirnov test. Normally distributed variables are described as the mean±standard deviation, and nonnormally distributed variables are described as the median ± (25th-75th percentiles). The χ2 test was used to compare categorical variables. Student’s t test was used to compare continuous variables. Basic characteristics with p < 0.05 were considered statistically significant and included in the following modeling. Radiomics features with a p value < 0.001 were included for model establishment.
C. Image acquisition and segmentationThe CCTA images of all patients in this study were obtained from Siemens and GE computerized tomography instruments of the First Affiliated Hospital of Nanjing Medical University. The original data were maintained in DICOM data format with 512*512 dimensions, the patients’ personal information was desensitized, and the detailed configuration information of DICOM message headers was retained for the subsequent extraction and analysis of data feature values. Deep learning algorithms have made long-term progress in the segmentation of various tissues and organs of medical images [16,17,18,19]. However, the existing methods have a large proportion of tissue structures and clear edges, while the coronary vessels to be segmented in this study have a small proportion, long and thin vessels with fuzzy edges, and the labeling of coronary vessels needs to be marked layer by layer, which is laborious and difficult to obtain a lot of labeling information. Therefore, we adopted the method of coronary artery segmentation proposed our research group yaolei et al. [20]. We used the easily obtained central axis as weak supervision information, proposed an examinee-examiner network, and used customized prior conditions to guide and constrain segmentation to deal with weak supervision with fewer intracranial labels to achieve accurate segmentation of coronary artery lumens and obtain the ROI of the coronary vessel area, to achieve accurate segmentation results. Based on the training model of the training dataset, the dataset used in this study was transferred. The automatic extraction of the coronary artery was realized.
D. Feature extractionPCAT was defined as all voxels with CT attenuation between − 190 and − 30 Hounsfield units (HUs) located within a radial distance from the outer coronary wall equal to the diameter of the vessel [12, 21]. In this study, the feature extraction of images was carried out through the open-source software package PyRadiomics [22,23,24]. PyRadiomics is implemented by the Python algorithm, which is a popular open-source language for scientific computing. Python version 3.6.4 is adopted in this study. PyRadiomics is a standardized and open platform with a large number of standardized feature extraction algorithms, which is often used for the extraction and processing of imaging features of medical image data. In this study, seven standardized characteristic classes, including first-order statistics, shape features, gray-level cooccurrence matrix (GLCM), gray-level run length matrix (GLRLM), gray-level size zone matrix (GLSZM), gray-level dependence matrix (GLDM), and neighboring gray tone difference matrix (NGTDM), were mainly calculated. A total of 1,037 radiomic parameters were calculated for each PCAT segmentation. Figure 1 shows the process of CCTA image acquisition, segmentation, radiomics feature extraction of the pericoronary adipose region, feature screening and model construction for the studied patients.
E. Model construction Support vector machine (SVM)SVM is a supervised machine learning algorithm based on statistical learning theory using the concept of structural risk minimization. It has been applied to many medical diagnoses and disease classifications. The computational time complexity of the SVM algorithm varies with different kernels, ranging from O (n2) to O (n3), where n represents the number of training sessions.
Decision tree (DT)In the DT algorithm, instances (data points) are classified by sorting them based on feature values. In this study, the Gini index algorithm was used to identify the corresponding threshold to split the input data into subbranches. The computation time complexity of the DT algorithm is O(n*log(n)*f), where n represents the number of training capital and f represents the number of features.
Random forests (RF)RT is an ensemble-type classification method that tends to perform better than traditional decision tree classification methods. The computational time complexity of the RF algorithm is O(n*log(n)fk), where n represents the number of training samples, f represents the number of features, and k represents the number of trees. We used 500 trees to predict two target classes, the occurrence or not occurrence of CHD in diabetic patients.
We developed SVM, DT and RF models to identify risk factors for CHD occurrence in type 2 diabetes patients. We used the package e1071 in the open-source software R 4.1.2 to perform SVM models, and the DT and RF were implanted using the packages rpart and randomForest, respectively. For the preprocessing of input data before modeling, since Stochastic resonance theory explains the use of noise constructively to enhance the input signal [25,26,27], we did not perform filtering operation. Instead, the input data is directly normalized and then modeled.
F. Performance evaluationParameters such as sensitivity, specificity, positive predictive value (PPV), negative predictive value (NPV), false positive rate (FPR), false negative rate (FNR), F score and accuracy (AAC) were calculated. The receiver operating characteristic (ROC) curve area was calculated to observe the relationship between PCAT around coronary plaque and internal radiomics information based on CCTA and the possibility of CHD events in diabetic patients.
Figure 2 shows the full flowchart of the current study. First, the collected CCTA images are resampled and segmented with method in section C. Then, the proposed regions are used as templates for feature extraction using radiomics with method in section D. For the diameter range around the extracted blood vessels and the CT attenuation value is the range area describing the tissue, the PCAT was extracted using the PyRadiomics package. After that, feature selection is performed using statistical methods. The models are constructed using SVM, DT, and RF methods, and the performance of the models is evaluated.
Fig. 2
The flowchart of the current study
留言 (0)