
記住我

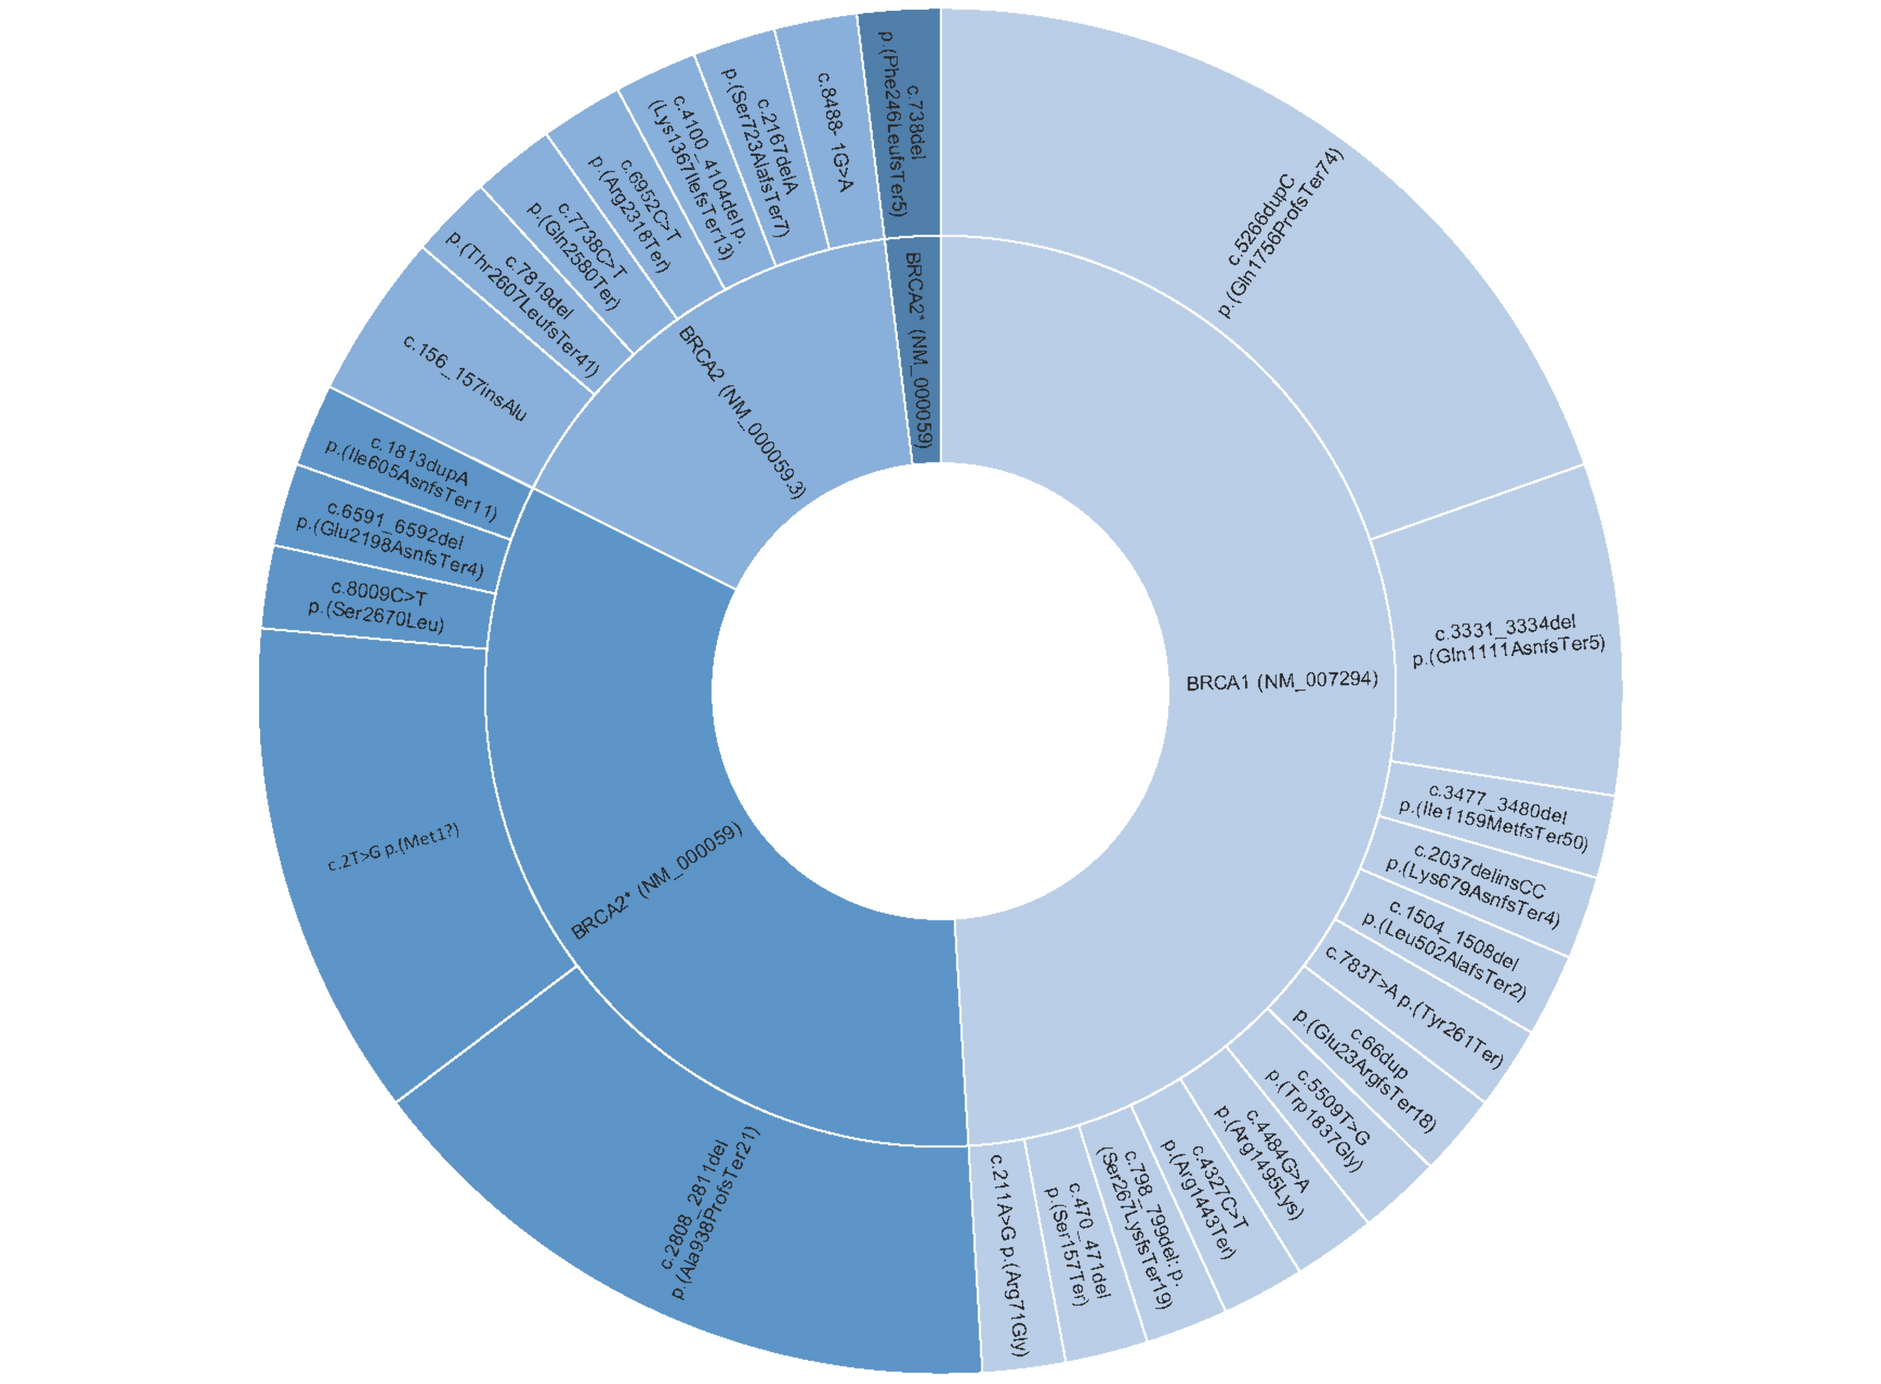
A total of 5,780 and 1,670 HR(+)HER2(−) MBC patients with TBx and LBx, respectively, were included in this study (Supplementary Figure S1 for detailed CONSORT chart). Out of those, 1002 (17.3%) TBx and 503 (30.1%) LBx had an ESR1mut detected; 2,442 (42.2%) TBx and 564 (33.8%) LBx had a PIK3CAmut detected; 289 (5%) TBx and 70 (4.2%) LBx had an AKT1mut detected; and 602 (10.4%) TBx and 41 (2.5%) LBx had a PTEN alteration (mut or loss) detected. The most common PTEN alteration detected in TBx was PTENloss (4.1% of all TBx samples), while in LBx, copy loss was detected in only 4 (0.2%) of the samples. The full spectrum of presumed pathogenic GAs detected in TBx and LBx are described in Supplementary Figures S2–S6.
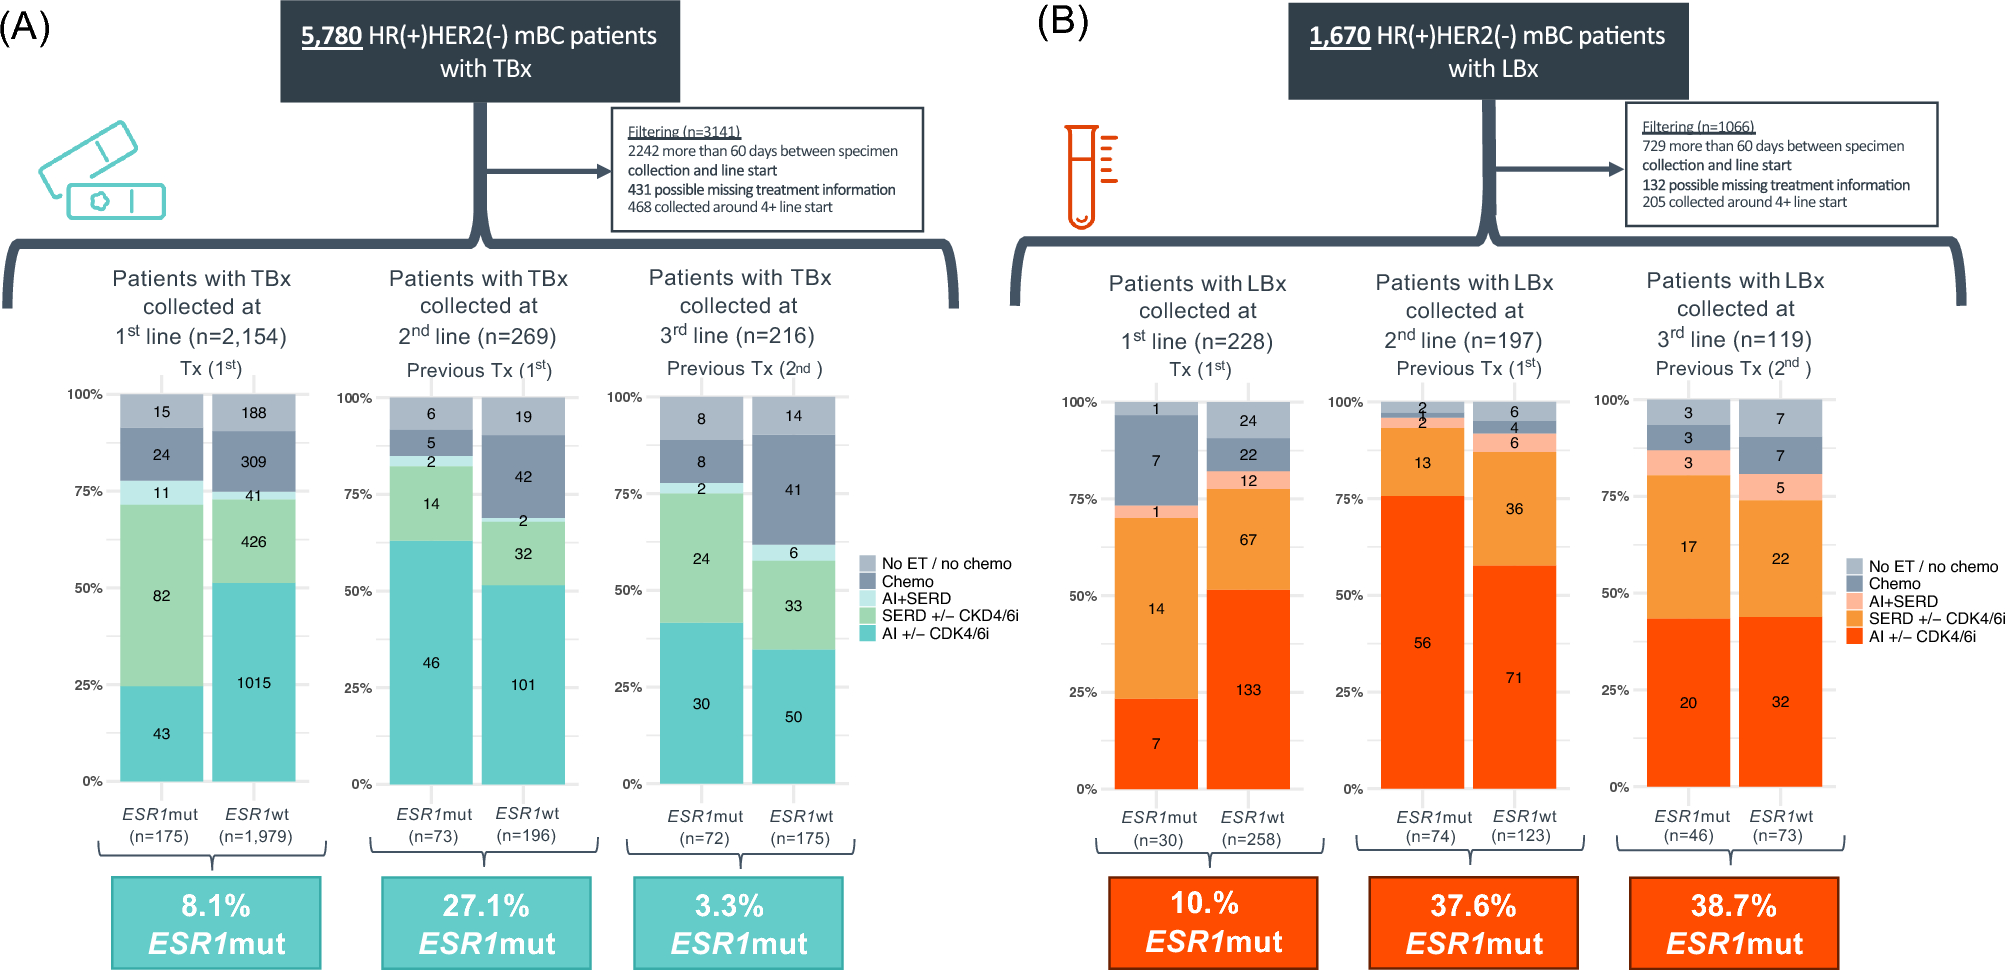
Prevalence of ESR1mut and PI3K/AKT pathway alterations (PIK3CAmut, AKT1mut, PTENmut, and PTENloss) over treatment courseEvaluating specimens collected at or near the time of therapy initiation, the prevalence of ESR1mut in TBx collected within 60 days before or after the initiation of 1st, 2nd, and 3rd lines of therapy was 8.1% (n = 175/2,154), 27.1% (n = 73/269), and 33.3% (n = 72/216), respectively. Patients with ESR1mut detected at or near the initiation of 1st-line therapy were more likely to receive an alternative ET other than AI (TBx p < 0.001/LBx p = 0.006). Previous AI use was more common in patients with ESR1mut detected in 2nd and 3rd lines compared to patients with ESR1wt (Fig. 1A). The prevalence of ESR1mut in LBx collected proximal to initiation of 1st, 2nd, and 3rd lines of therapy was 10.4% (n = 30/288), 37.6% (n = 74/197), and 38.7% (n = 46/119), respectively (Fig. 1B).
Fig. 1
Prevalence of ESR1mut detected in tissue and liquid specimens of HR(+)HER2(−) mBC in the first three metastatic lines of therapy. ESR1mut detected in TBx (A) and LBx (B). AI aromatase inhibitors, chemo chemotherapy, CDK4/6i CDK 4/6 inhibitors, ET endocrine therapy, HR hormone receptor, LBx liquid biopsy, mBC metastatic breast cancer, mut mutations, SERD selective estrogen receptor degrader (fulvestrant), TBx tissue biopsy, TF ctDNA tumor fraction, Tx therapy
We observed that the prevalence of an alteration in the PI3K/AKT pathway in TBx collected in 1st, 2nd, and 3rd lines of therapy was 55.1% (n = 1,186/2,154), 48.3% (n = 130/269), and 54.6% (n = 118/216), respectively. In LBx, the prevalence was 38.2% (n = 110/2,154), 49.7% (n = 98/269), and 46.2% (n = 55/216), respectively. Figure 2A shows the prevalence of each specific GA in TBx and LBx and the likelihood of detecting any of the actionable GAs (ESR1mut, PIK3CAmut, AKT1mut, PTENmut, and PTENloss) in TBx and LBx in the first three lines of therapy. We observed that 58.8% and 42.7% of patients with TBx and LBx, respectively, have at least one GA detected in 1st line, with an increase in later lines of therapy to 62–71% mainly due to the acquisition of an ESR1mut. We also observed that PTENloss is detected at higher rates in TBx (3.3–5.6%) than LBx (0–1.0%). In an exploratory analysis to evaluate if exposure to CDK4/6 was potentially associated with some differences observed in GAs, we evaluated the prevalence of GAs in TBx samples collected prior to 2015 and in 2015 or later, and no significant differences were observed between the two groups of samples (Supplementary Figure S7). The cut-off year was chosen because the first use of a CDK4/6i was recorded in CGDB in 2015.
Fig. 2
Prevalence of ESR1mut and PI3K/AKT pathway alterations detected in tissue and liquid specimens of HR(+)HER2(−) mBC in the first three metastatic lines of therapy. Alterations detected in TBx and LBx (A) and in LBx stratified by ctDNA tumor fraction (TF) (B). p-values are unadjusted. loss homozygous copy loss, mut mutation
Given that GA detection in LBx is dependent on the tumor content of the sample, the prevalence of each GA was evaluated by the ctDNA TF status (≥ 1% versus < 1%). The prevalence of GA detected in LBx with ctDNA TF ≥ 1% was substantially higher than in LBx with ctDNA TF < 1% (Fig. 2B). Additionally, we assessed the distribution of ctDNA TF content in LBx collected from patients with bone-only metastasis versus those with visceral metastasis (with or without bone), and no difference was observed (Supplementary Figure S8).
Co-occurrence of ESR1mut and PI3K/AKT pathway alterations (PIK3CAmut, AKT1mut, PTENmut, and PTENloss)Among patients with TBx in 1st (n = 2154), 2nd (n = 269), and 3rd (n = 216) lines, both ESR1mut and a PI3K/AKT pathway GA were detected in 4.4% (95), 8.2% (22), and 17.1% (37), respectively (Fig. 3A).
Fig. 3
Co-occurrence of ESR1mut and PI3K/AKT pathway alterations detected in tissue specimens of HR(+)HER2(−) mBC in the first three metastatic lines of therapy. loss copy loss, mut mutation, PI3K/AKT alterations include AKT1mut, PIK3CAmut, PTENmut, and PTENloss
Regarding co-alterations in the PI3K/AKT pathway, PIK3CAmut and PTEN alterations (either mut or loss) co-occurred in 4.0% (85) patients in 1st line, 1.8% (5) in 2nd line, and 4.6% (10) in 3rd line. PTENloss was the only GA detected in 3.2% (68) patients in 1st line, 2.2% (6) in 2nd line, and 3.2% (7) in 3rd line. PIK3CAmut and AKT1mut co-occurred in 0.4% in 1st and 2nd lines of therapy in 0% in 3rd line. AKT1mut and PTEN alterations were mutually exclusive (Fig. 3B and Supplementary Figure S9).
Clinical characteristic of patients with HR(+)HER2(−) MBC receiving AI + CDK4/6i or Fulvestrant + CDK4/6i in 1st-line therapyOut of the 2,154 HR(+)HER2(−) MBC patients with TBx collected at 1st line of therapy, a total of 921 patients were included in the outcome analyses. Patients were excluded from the outcome analysis if they received therapies other than AI + CDK4/6i or fulvestrant + CDK4/6i or had CGP ordered after the start of the 2nd line of therapy (Supplementary Figure S1 for detailed CONSORT chart).
Out of the 921 patients included, 62.2% received 1st-line AI + CDK4/6i and 37.8% received Fulvestrant + CDK4/6i. Baseline ESR1mut was detected in 81 patients (8.8%), and of these patients, 27.2% received 1st-line AI + CDK4/6i and 72.8% received fulvestrant + CDK4/6i. The median age observed for patients with ESR1wt and ESR1mut was 63 [interquartile range (IQR) 55–70] and 65 (IQR 58–73), respectively. Most patients had an ECOG performance status of 0 (51.5%) and bone-only metastasis was observed in 32.0% of patients. Most of the cases that featured an ESR1mut had received adjuvant ET with AI or tamoxifen (61.7%), while only 34.4% had received adjuvant therapy with ET among those with ESR1wt. Finally, menopausal status and histology data were unknown in many cases, but for those cases with data available, the majority were postmenopausal and had invasive ductal histology (Table 1). See Supplementary Tables 1 and 2 for breakdown statistical comparison of baseline characteristic in patients with ESR1wt versus ESR1mut among those receiving AI + CDK4/6i and among those receiving fulvestrant + CDK4/6i in the 1st setting.
Table 1 Baseline patient characteristics (patients included in the outcome analyses)Baseline ESR1mut is associated with less favorable outcomes in patients receiving 1st-line AI + CDK4/6i, but not in patients receiving fulvestrant + CDK4/6iAmong patients receiving AI + CDK4/6i 1st-line therapy (n = 573), those with ESR1mut versus ESR1wt had less favorable rwTTD [7.2 versus 18.8 months, hazard ratio (HR) 2.84, 95% confidence interval (CI) 1.76–4.58, p < 0.0001], rwPFS (median 8.1 versus 21.4 months, HR 1.93, 95% CI 1.16–3.19, p = 0.011), and tended to have less favorable rwOS (median 33.9 versus 53.5 months, HR 1.35, 95% CI 0.63–2.89, p = 0.436), (Fig. 4A–C). Among patients receiving fulvestrant + CDK4/6i 1st-line therapy (n = 348), no difference was observed for those patients with ESR1mut versus ESR1wt (rwTTD p = 0.748, rwPFS p = 0.16, and rwOS p = 0.278) (Fig. 5A–C). The specific ESR1mut identified did not appear to impact patient outcomes with the AI + CDK4/6i regimen (Fig. 4D); however, notably shorter rwTTD and rwPFS were observed for the three patients with ESR1 Y537S receiving fulvestrant + CDK4/6i (Fig. 5D).
Fig. 4
Clinical outcomes of HR(+)HER2(−) metastatic breast cancer patients receiving 1st-line AI + CDK4/6i by ESR1mut detected by TBx. Kaplan–Meier plots show rwTTD (A), rwPFS (B), and rwOS (C) for ESR1mut (n = 22) vs ESR1wt (n = 551). Swimmer plot shows rwTTD (each bar represents therapy duration on 1st line of therapy) and rwPFS (dots represent progression) for patients with ESR1mut ordered by specific ERS1mut (D). AI aromatase inhibitors, ESR1mut ESR1 mutations, ESR1WT ESR1 wild-type, HR hazard ratio, OS overall survival, PFS progression-free survival, rw real-world, TBx tissue biopsy, TTD time to treatment discontinuation
Fig. 5
Clinical outcomes of HR(+)HER2(−) metastatic breast cancer patients receiving 1st-line Fulvestrant + CDK4/6i by ESR1mut detected by TBx. Kaplan–Meier plots show rwTTD (A), rwPFS (B), and rwOS (C) for ESR1mut (n = 59) vs ESR1wt (n = 289). Swimmer plot shows rwTTD (each bar represents therapy duration on 1st line of therapy) and rwPFS (dots represent progression) for patients with ESR1mut ordered by specific ERS1mut (D). ESR1mut ESR1 mutations, ESR1WT ESR1 wild-type, HR hazard ratio, OS overall survival, PFS progression-free survival, rw real-world, TBx tissue biopsy, TTD time to treatment discontinuation
We further performed multivariable analyses to control for confounding variables and found the independent association of baseline ESR1mut and less favorable rwTTD (HR 2.42, 95% CI 1.47–4.00, p < 0.001), rwPFS (HR 1.79, 95% CI 1.05–3.06, p = 0.033), and rwOS (HR 2.07, 95% CI 0.93–4.58, p = 0.074) in patients receiving 1st-line AI + CDK4/6i, but not in patients receiving Fulvestrant + CDK4/6i (Supplemental Figure S10).
留言 (0)