
記住我


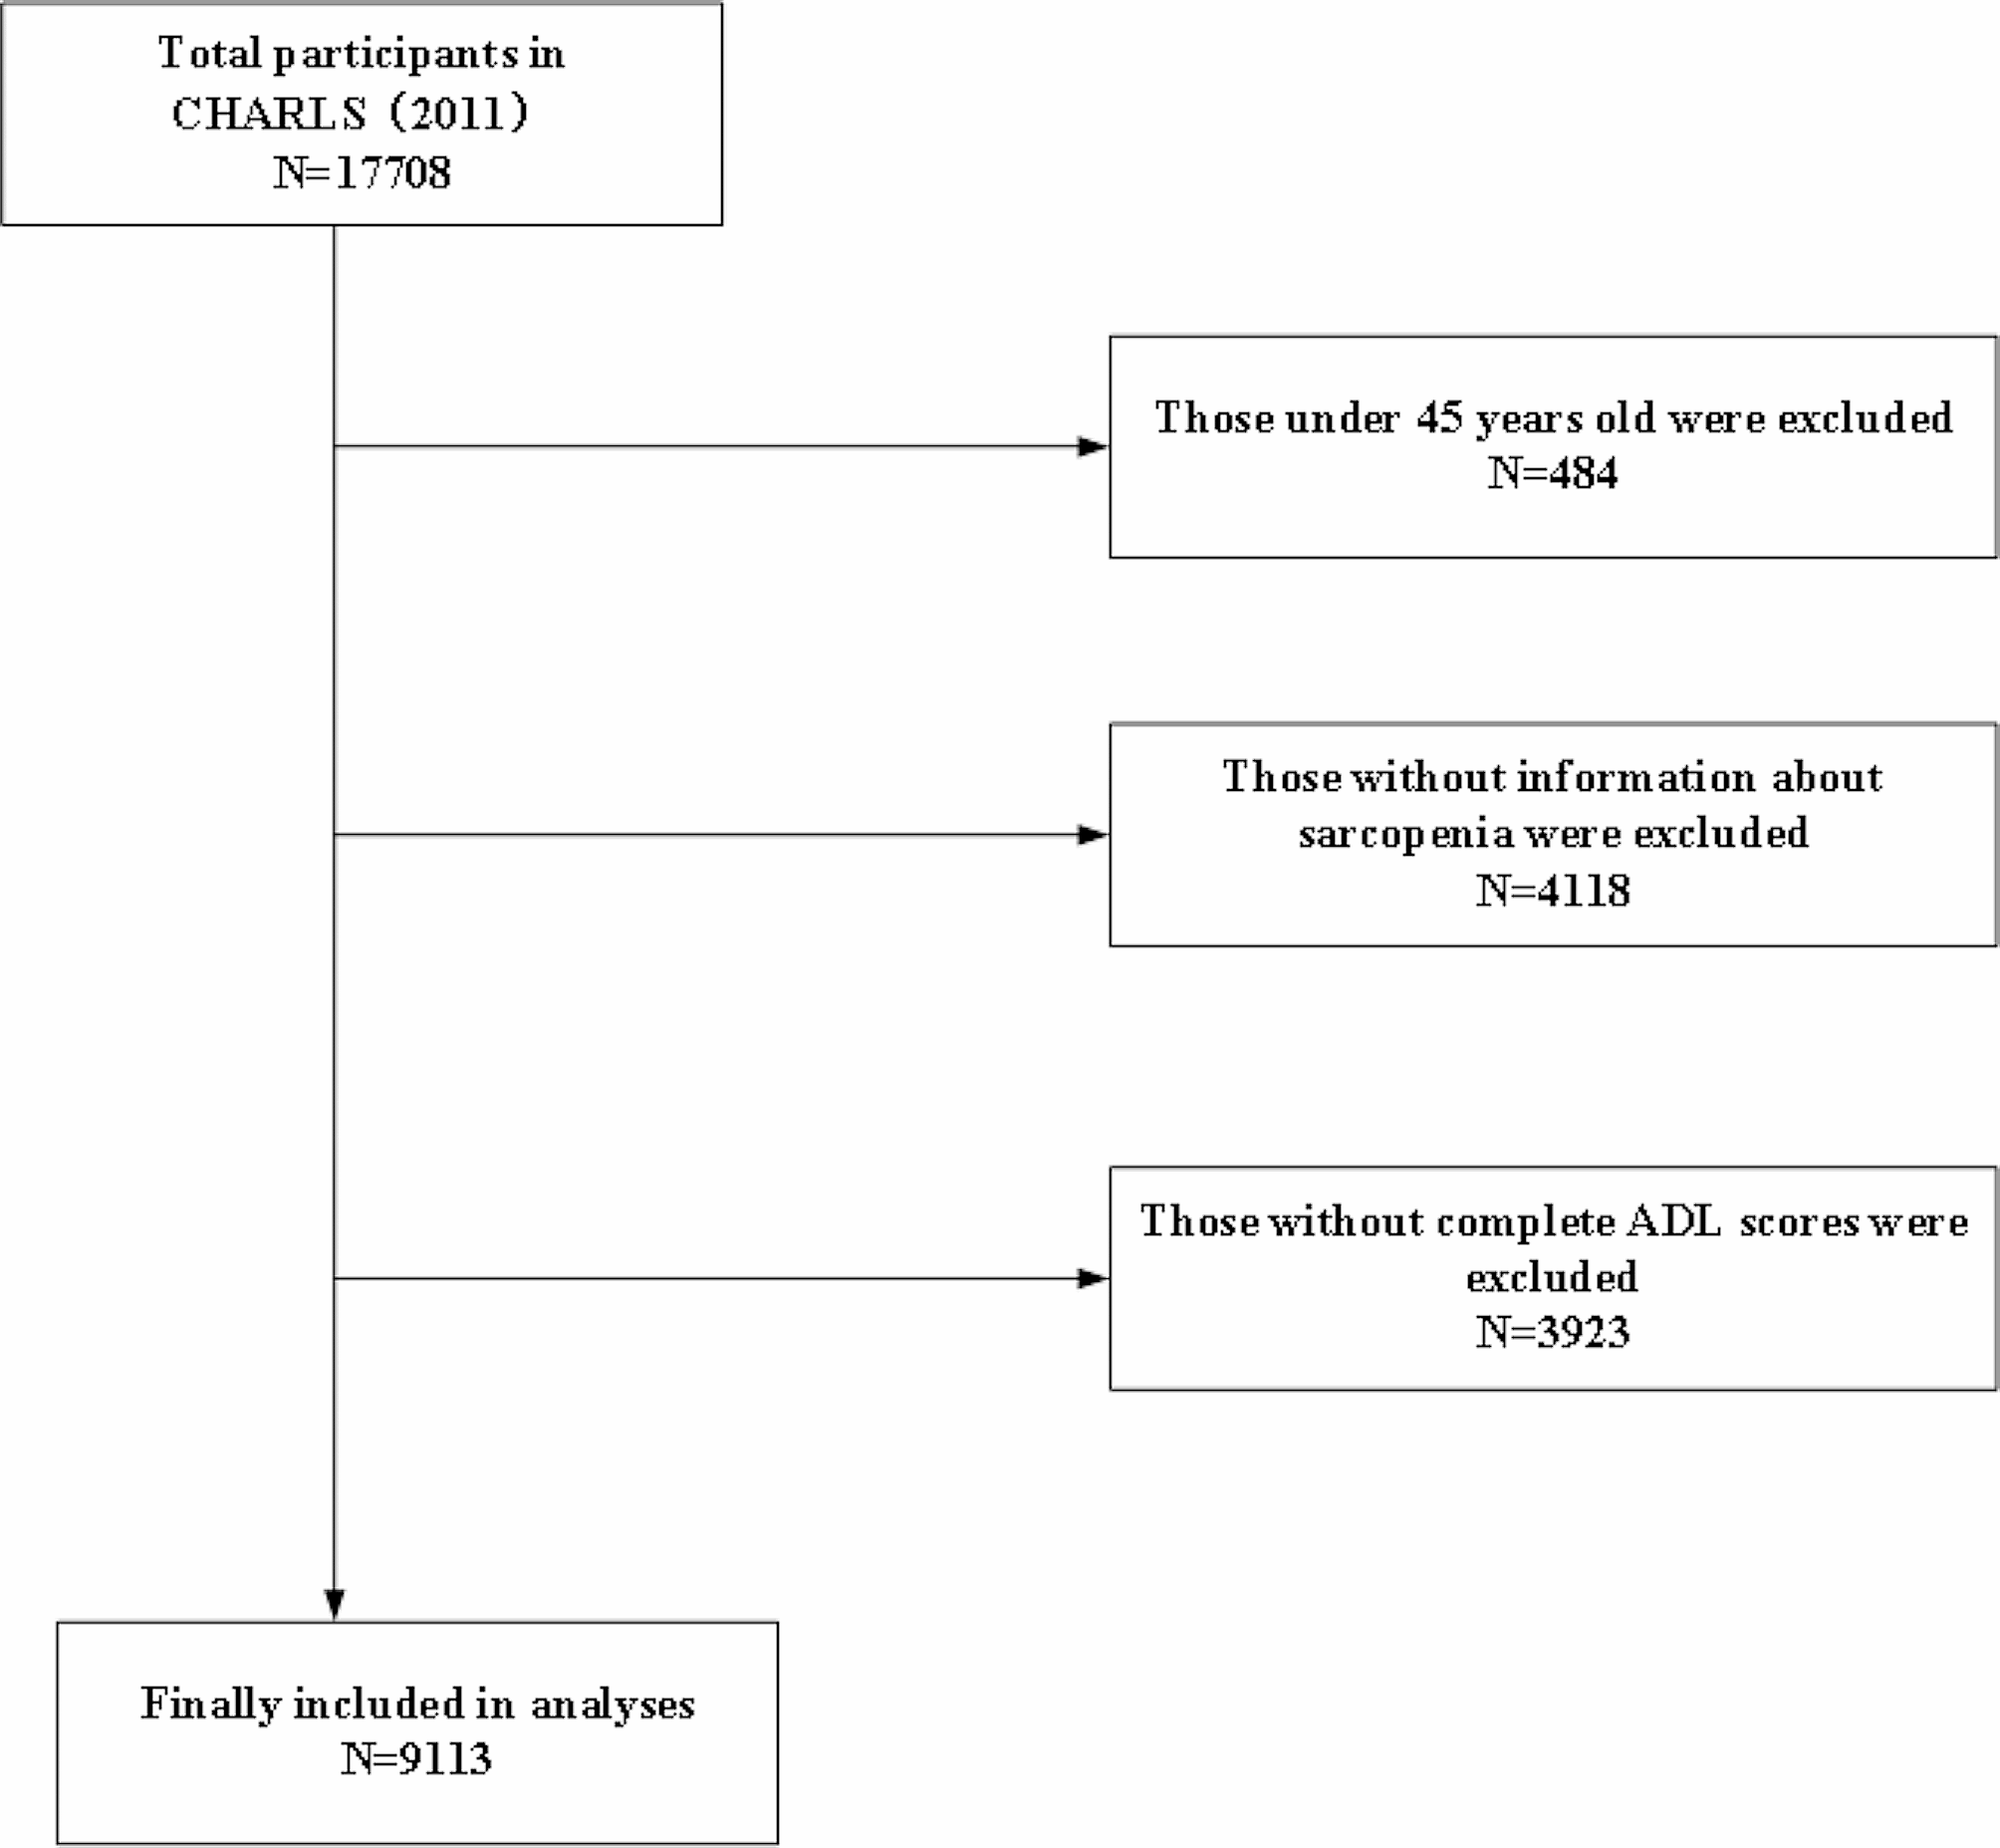
A total of 308 potentially relevant original studies were identified throughout all three databases using our research equations, after the elimination of duplicate entries. Subsequently, we excluded 8 additional articles that were identified by our reference manager software as not being original studies, resulting in a total of 300 articles. We first screened the articles by reading all titles and abstracts, and when the abstract matched the corresponding inclusion criteria, full-text reads were done (a total of 96 articles). After careful evaluation of full-text, 20 articles met the criteria and were selected for inclusion in the review. Figure 1 provides a detailed flow chart of our screening steps.
Fig. 1
Our results show important heterogeneity and inconsistency in the methodological reporting of GEMA studies, which could compromise reproducibility and comparison of studies’ quality. Among the reviewed studies, 4 (20%) did not report the technology used for data collection, and 9 (45%) did not mention whether devices belonged to participants or were provided by the study team. One study lacked key information regarding prompting design and only 4 (20%) studies specified the time window allowed to complete the survey. Most importantly, crucial information regarding GPS recording intervals was missing in 3 (15%) studies. Study schedule was fully described in all but two articles, which did not mention whether monitoring days occurred during weekdays and/or week-end days, and information on participants’ compliance was missing in 3 (15%) articles.
Moreover, we observed a diversity in prompting strategies, GPS recording intervals, and derivation of environmental exposures, which demonstrates the many ways in which the EMA methodology can be used to investigate associations between environmental exposure and individual experience.
Table 1 can be consulted for a summarized view of the literature review results. For more details, please see the Additional file 1, where complete information regarding elements from included articles are found. We will refer to included articles based on their numerated reference number in the following section.
Table 1 Design characteristics of the included GEMA studiesGeneral characteristics of the studiesThe studies encompassed a wide range of topics across disciplines. Several studies explored the associations between environmental factors and various aspects of human experiences, including social interactions (1, 3, 7, 9, 11) and exposure to natural environments (1, 4, 5, 10, 18). Some studies focused on specific populations, such as youth (2, 5, 11, 12), older adults (9), or clinical populations such as individuals with schizophrenia (7, 8, 14). The 20 studies were published in 20 different journals, underlining the wide applicability of GEMA across research topics and disciplines, with significant growth in recent years: while the earliest article was published in 2013, 13 were published between 2020 and 2022.
Geography of studiesEleven studies were conducted in the United States (2, 3, 5, 7, 8, 9, 12, 13, 14, 19), three in China (16, 17, 18), one in four European countries (Spain, the Netherlands, the United Kingdom and Lithuania) (10), one in Germany (1), one in Tasmania (6), and one in the Netherlands (4). Additionally, one pilot study was conducted worldwide, including participants from thirteen different countries (15).
Target populationsSeveral studies recruited participants within specific age ranges: 13-14 years old (12), 14-16 years old (2), above 18 (1, 4, 10, 16), between 18 and 60 (17, 18) or above 50 (9). Some studies also targeted participants with specific characteristics, such as socioeconomically disadvantaged adult smokers willing to quit (19), adults without underlying physical or mental health conditions (1), adults with no history of eating disorders or dieting (6) adults diagnosed with attention deficit hyperactivity disorder (ADHD) who are also smokers (13), adults with schizophrenia (14), women with severe obesity (3), or undergraduate students who screened positive for generalized anxiety disorder or social phobia (8).
Sampling and measuresThe median sample size was 117 participants, and the 25th percentile 47, and 75% percentile 170. One study had only 10 participants (13) and the largest sample had 4,318 participants (4).
ScheduleEighteen studies counted one wave of data collection, while the two others included six (17, 18). The monitoring period lasted between 2 and 60 days, with a median and mode of 7 days. Of the 20 included studies, two studies (11, 12) that collected data for four consecutive days did not report if monitoring days occurred during weekdays and/or week-end days.
Technology used and trainingThe technologies used include mobile phones (1, 3, 4, 7, 8, 9, 10, 12, 14, 15, 16, 18, 19, 20), and computers (5, 13). Four studies did not mention what type of data collection modality was used. In nine of the studies, smartphones were supplied to the participants, two studies involved the use of participants' own phones, and in nine studies this information was not documented. Specific models of mobile phones were mentioned in some cases when devices were provided to participants (2, 6, 7, 9, 11, 14, 19, 20), such as Samsung Galaxy S4.2 (9), Samsung Galaxy S8 (14), Apple iPhone 5c (2, 20) and LG-P509 (19). The operating systems of the mobile phones varied, with Android and iOS being the most commonly mentioned. Different apps or programs were used for data collection, including home-developed apps such as the Motivation and Skills Support (MASS) (14), Happyhier (4), Ethicadata (7), EMA WebApps (16), Addressing People and Place Microenvironments (APP-Me) (3), and commercially available apps like Movisens (1) and Mood Triggers (8). The type of sensor used to capture geographic location varied across studies. In some cases, the EMA was conducted directly on the mobile phone itself with the location sourced from the smartphone location subsystem. Other studies used additional devices or apps such as GPS loggers (9), wearable devices like iBlue (13) or Garmin(e), and web-based EMA platforms (12).
Eight out of twenty studies reported providing training to participants, about how to operate the smartphone that was provided (1, 9, 14, 19), how to complete EMA surveys (7, 9, 13, 14), sometimes with mock EMA assessments (19), or practicing event-based triggered responses, as for each cigarette smoked (13). One study also provided information about how to interpret the EMA questions (7). Several studies provided specific instructions to help participants complete EMA surveys rapidly after being prompted (6, 10). Several studies also provided written instructions or a training guidebook to bring home (9, 19) or provided support options (1).
Prompting strategyFive studies used a fixed Interval Contingent strategy (e.g., prompts were set for certain times that were not random), and the number of prompts per day varied between 2 and once per hour during waking hours (3, 8, 16, 16, 17). The prompting schedule varied between studies: after school and in the evening on Thursday and Friday, and during the same time period on Saturday (4:00 p.m. and 9:00 p.m) (1), once per hour during waking hours (8), and at 08:00, 12:00, 16:00 and 20:00 (16, 17, 18). Using [60] taxonomy, five studies employed a Semi-random Interval Contingent strategy (EMAs were administered at random intervals within predetermined time windows) (3, 7, 9, 14, 20), with 2 to 12 prompts per day. Five studies used a Random Interval Contingent strategy (e.g., random times throughout each day) (6, 10, 11, 12, 19), with 3 to 6 prompts per day. Four studies used an Event-Based strategy (e.g., either through self-initiation of questionnaire at determined event, such as after being active for more than 30 min, prior to and following smoking, or through geofencing initiation, such as when the device detects being in a predetermined location, such as when entering a park.) (1, 4, 5, 13). One study did not report the strategy employed (15). Most studies did not report the maximum delay allowed between a prompt and filling the questionnaire. Three studies used a 30-minute delay limit (10, 17, 18), and one 20 minutes (13). Duration of prompt interval, meaning the duration between each prompt, was not reported in 11 studies (1, 3, 5, 6, 8, 10, 11, 12, 14, 15, 19) - as it does not apply to random interval contingent prompting strategy. One study reported five hours (2), two reported four hours (16, 20), three reported three to four hours (9, 17, 18), one reported a minimum of 90 minutes (7) and two studies using geofencing event-based strategy reported at least 50 minutes (4), and every 2.5 hours during waking hours (13).
Measurement instrumentsThe instruments used in the reviewed studies varied across domains and variables of interest. Fifteen studies did not report any specific instrument used for measurement. However, for the assessment of social interactions and social functioning, two commonly employed instruments were the Heinrichs Quality of Life Scale — Interpersonal Relations subscale (QLS-IR) and the Birchwood Social Functioning Scale (SFS) (14). The measurement of affective states was done with the Positive Affect Negative Affect Schedule - Expanded Edition (PANAS-X) and the Multidimensional Experiential Avoidance Questionnaire (MEAQ)'s behavioral scale (8), which was modified to better align with the momentary assessment paradigm. In one study, the taxonomy of social activities developed by Levasseur et al. (2010) (1) served as a basis to assess social interactions, with specific questions co-designed and evaluated by users. Other instruments, such as the Profile of Mood States questionnaire, 2nd Edition–Youth (POMS-Y), were also used, although specific details were not provided in the reviewed studies (5). Interestingly, only one study used an instrument that was specifically designed and validated for an EMA context - that is in the context of repeated momentary measures (1).
Main variables of interestMomentary variables of interest related to health behaviors (diet, drinking, smoking, or smoking urge), mental health and well-being (mood, affective states, psychological stress or feelings of anxiety and momentary happiness), or health symptoms (physiological symptoms of distress, fatigue, and pain). One study included measures of perceived safety (l) and 5 studies also included measures of momentary social interactions (1, 3, 7, 9, 11). One common theme that emerges is the examination of adolescents' alcohol consumption and disorganization (2). Another area of investigation was the relationship between daily happiness (2, 15, 16) and various factors such as social motivation (14), social interaction (1, 3, 7, 9, 11), and contextual well-being (1, 5, 6, 8, 9, 10, 11, 13). These studies aimed to shed light on the determinants of individuals' happiness on a day-to-day basis (4, 15, 16), considering both internal and external factors that may influence one's emotional state.
Three studies (12, 17, 20) focused on momentary psychological stress. Multiple studies explored the triggers and consequences of momentary stress, including its association with mood, tiredness, and fatigue (9, 11, 20). Moreover, smoking urges (13, 19) were examined as a focal point in understanding addiction and behavioral patterns. Some studies also used measures of both physical and emotional well-being, with assessment of affect (20), pain, and fatigue levels (10, 20). The connection between lifestyle choices and emotional states is also explored, for example relating eating and drinking habits (2, 3) with happiness and psychological well-being. Lastly, substance use (12), anxiety and avoidance (8), and the concentration of nature on mood (5) were investigated as outcome variables in other studies.
GPS recordingGPS coordinates were recorded at various frequencies. Eleven studies used continuous recording with varying intervals, six used momentary recording (at each EMA response), and three studies did not provide information about the recording intervals. The frequency used during continuous recordings varied across studies, with some sampled every 15 seconds (5, 13), while others were collected at 1-minute (2, 17), or 5-minute (7, 9, 14), or could be self-defined by the participants, at either 2, 5, 10, 30, or 60 minutes (15) intervals. Additionally, some studies recorded GPS data at each EMA prompt (1, 6, 11, 12, 16, 19). Moreover, one study implemented a unique approach where GPS recordings occurred at regular time intervals for participants with an Android OS smartphone, while participants with iOS smartphones had GPS position recorded only when they were changing location (4). The diversity of recording intervals used in these studies highlights the flexibility and adaptability of EMA in capturing real-time data in ecological contexts.
Deriving environmental exposure from GPS locationsSeveral methods were used to derive environmental exposures and link these to EMA responses. Most studies used buffer calculations (N=9), which allowed authors to assess exposure to predefined factors within a certain distance, such as presence or number of alcohol, tobacco, or food outlets (2, 6, 13, 19) and physical environment variables (e.g., population density, type of land use, traffic noise, weather, or exposure to greenery) (4, 9, 10, 16, 18). The size of buffers ranged from 50m to 1,600m in the reviewed studies. Direct spatial overlay was the second most used technique (N=4). Using this method, researchers were able to characterize participants' locations in terms of their social and physical environments, by overlaying Census data to establish local social indicators (11, 12, 15), or Google Place API and weather datasets to identify the type of location and meteorological conditions (8). Two studies used prompted recall diaries to identify the type of locations the participants had visited during the day (17, 18), one of which completed location identification with spatial segmentation to distinguish between indoor and outdoor locations (18). Two other studies resorted to Google Maps to retrieve specific information about participants’ location, such as the type of location (8), or to identify if the participant was in a green space (5). One article used viewshed analysis to derive exposure to greenness (1). Some studies also used the location data to derive daily mobility metrics, whether significant locations detection, identifying the number of places where participants had stayed for at least 10 minutes (13); measuring convex hulls (15) or using trajectory imputation methods (7) to identify periods of movements and periods of pauses.
Compliance and GPS matchCompliance, that is, the proportion of received prompts that were answered, was reported in 17 studies, and varied from 50% (l) to 100% (d, k), and three studies did not report compliance rate (5, 7, 14). No study reported if compliance varied by demographic or time-varying variables. Eight studies reported the proportion of EMA prompts for which a GPS coordinate was obtained: 46% (19), 56% (12), 75% (9), 76% (4), 86% (8), 99% (11), and 100% (13, 16). No study reported statistics on latency, that is, the delay between a prompt and an answer. No study reported how many prompts have been received.
Modeling approachesOne study limited itself to descriptive statistics as the sole analytical approach without employing any other models (13). Modeling approaches include the use of zero-inflated Poisson models to handle excess of zeros in the data (2), multilevel models, and structural equation models (SEM) with cluster-robust estimation methods for handling clustering effects (18). More precisely, multilevel modeling (MLM) was the main approach used, with different configurations, including multilevel logistic regression (3, 20), multilevel linear models (1, 4, 5, 9, 14, 15, 19), and multilevel ordinal regression models (10, 16, 17). All the studies using multilevel approaches nested the data into two levels — answered prompts within individuals —, except for one study that used three levels, with assessments nested within days within individuals (19). Additionally, bivariate correlations (7), and generalized estimating equations (12) were applied. A study employed logistic regression models with individual fixed effects (6), and multi-layered personalized deep-learning models with temporal patterns (8).
留言 (0)