The current study is reported in accordance with the Strengthening the Reporting of Observational Studies in Epidemiology-Nutritional Epidemiology (STROBE-nut), an extension of STROBE statement [21] and conforms to the International Committee of Medical Journal Editor’s recommendation.
Study population
This study used data from the PLCO, a multi-center, two arm, randomized trial comprising ten study centers (Birmingham, Denver, Detroit, Honolulu, Marshfield, Minneapolis, Pittsburgh, Salt Lake City, St Louis, and Washington) in the USA. The PLCO trial study objective and design are described in detail elsewhere [22] but briefly, the aim of the PLCO trial was to determine the effects of cancer screening on cancer-related mortality and secondary endpoints (disease-free survival, duration of response and incidence) in adults. For example, annual screening with chest radiography was carried out for participants in the intervention group to examine the effect of screening on lung cancer mortality compared to participants who received the usual service. Between November 1993 and September 2001, 154,887 adults aged 55–74 years were included in the trial. The participants were selected based on the prespecified inclusion and exclusion criteria. Equal proportions of individuals were allocated to the intervention arm and control arm (those who followed the standard health care services) [22]. The PLCO trial was ethically approved by the US National Cancer Institute Review Boards and written informed consent was obtained from each participant [22].
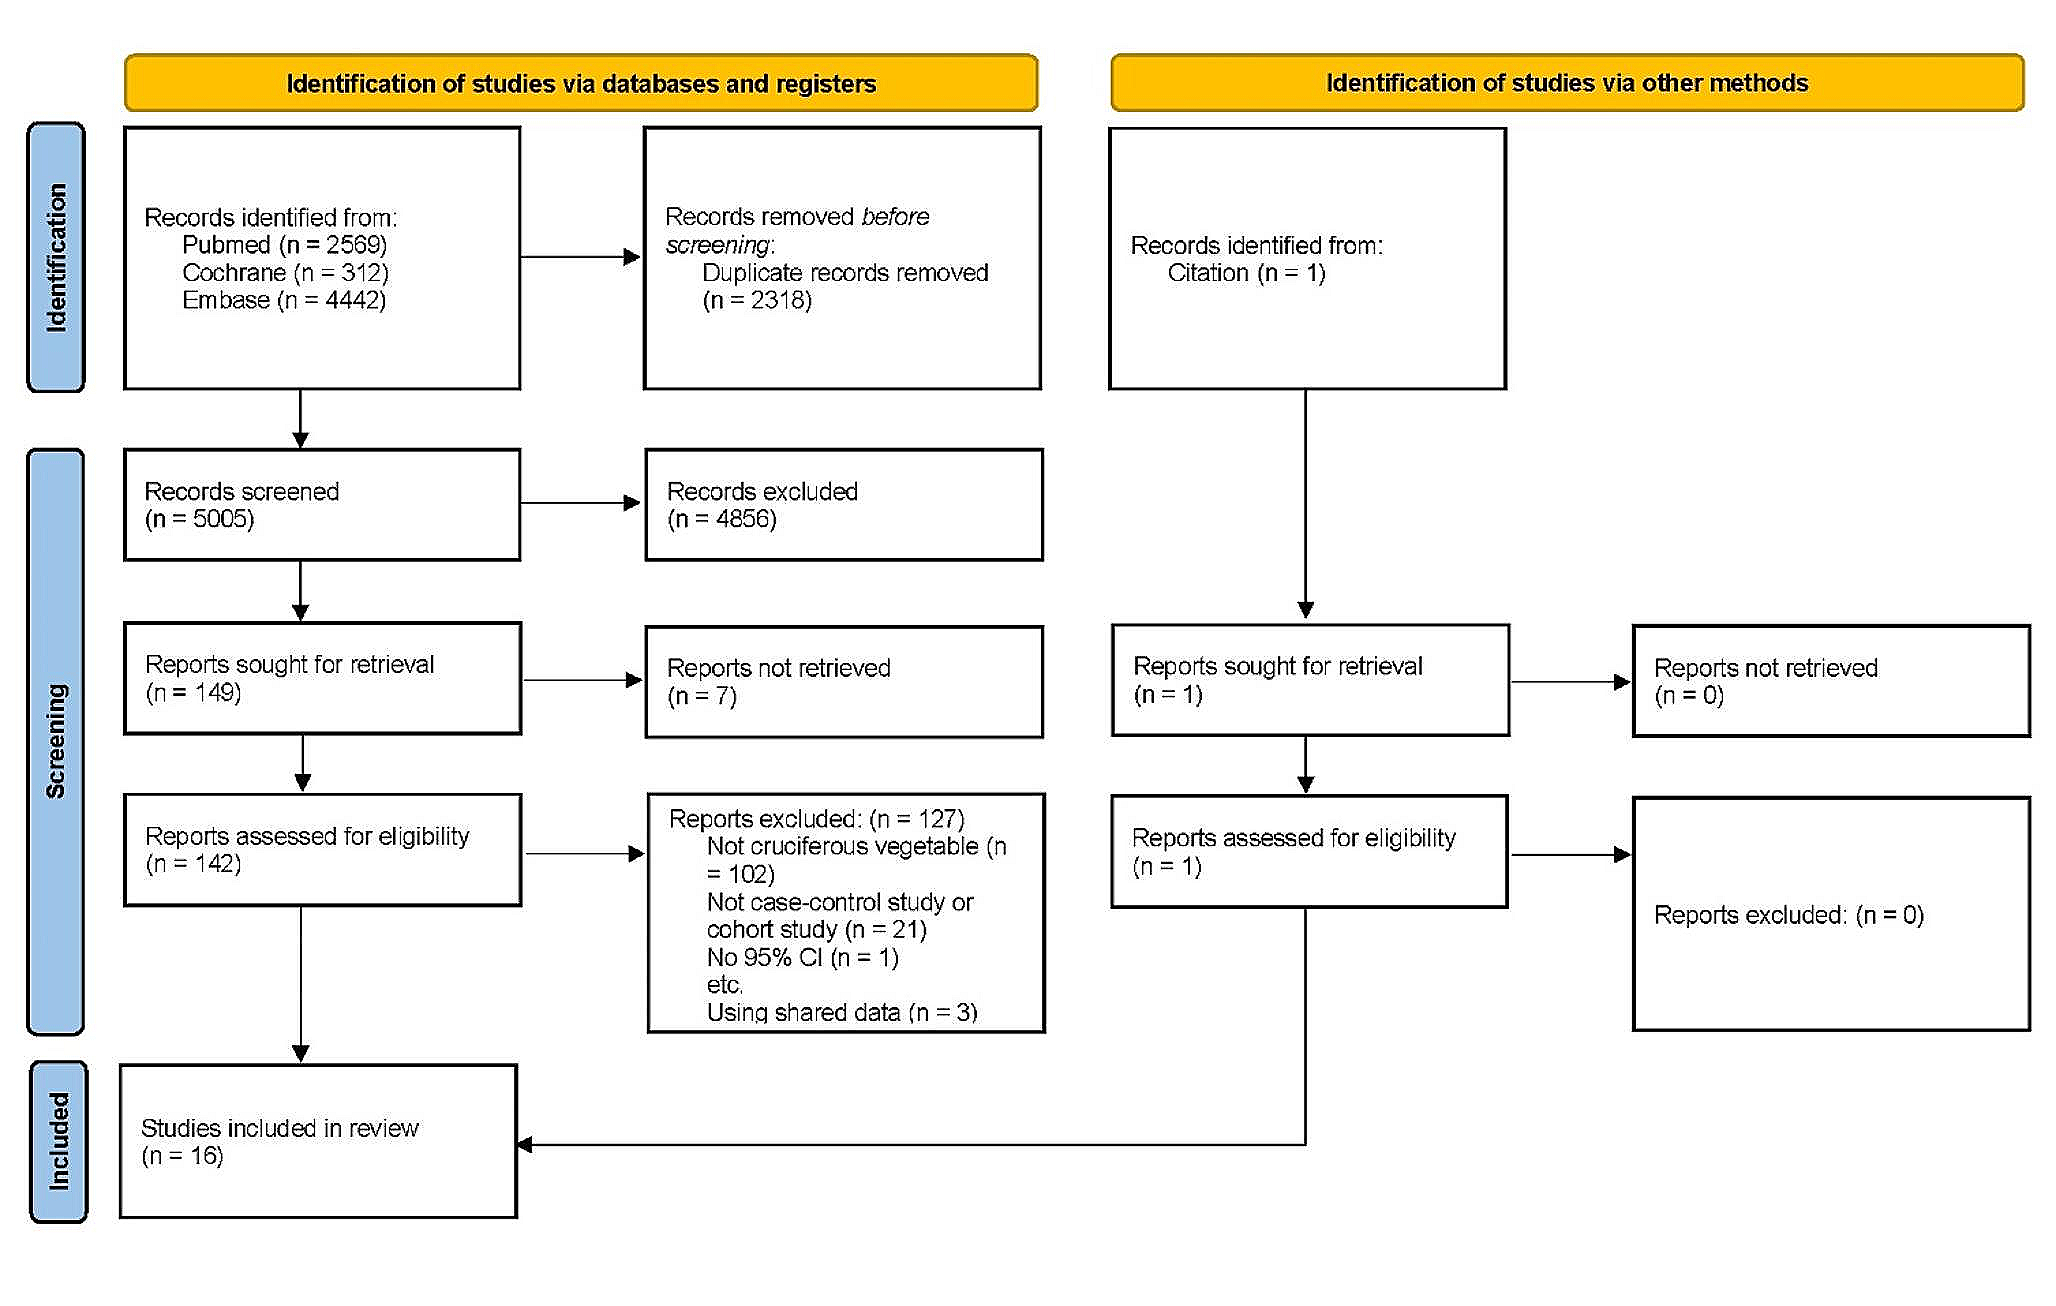
In the current study, those who (1) didn’t return the baseline questionnaire [n = 4918]; (2) had not completed the dietary history questionnaire (DHQ) [n = 33,241]; (3) had an invalid DHQ (including those who did not have a date of DHQ completion, died before completing DHQ, had eight or more missing/multiple frequency responses on DHQ and implausible energy intake (the bottom and top 1% of dietary energy intake)) [n = 10,437] and (4) past history of any cancer [n = 9,684] were excluded. A total of 96,607 participants were included in the analysis (Supplementary Fig. 1). To assess non-participation bias due to the high number of participant exclusions, we compared the standardized mean differences of baseline characteristics of included participants with those excluded. There were no statistically significant variations observed between the two groups.
Dietary assessment
Dietary intake was assessed using a self-administered food frequency questionnaire (FFQ), the DHQ version 1.0, which was developed by staff at the Risk Factor, Monitoring and Methods Branch, National Cancer Institute [23]. The FFQ, which comprising 156 questions, was introduced in 1998 to both recruitment arms within a median timeframe of three years following the random allocation of study participants. It consisted of a one-year recall on foods and beverages intake relating to frequency, serving size, type, seasonal intakes, cooking methods, fat uses, low-fat diet use, summary questions and nutrient supplementations [23, 24]. The DietCalc software was used to estimate energy and nutrient intake by linking with the national nutrition databases for the USDA’s 1994–96 Continuing Survey of Food Intakes by Individuals (CSFII) and the Nutrition Data Systems for Research (NDSR) [25, 26]. The DHQ has been validated and provides better nutrient estimates compared to the 1992 Block FFQ, the 1995 Block FFQ and the Willett FFQ [24]. The Eating at America’s Table Study (EATS) validated the DHQ against four 24-h dietary recalls among 1644 nationally representative participants and found that the correlation coefficients of nutrients intake ranged from 0.51 to 0.78 in women and 0.41 to 0.83 in men [24]. A self-administered FFQ has also been showed to have moderate validity for various food groups such as fruits, egg, meat, nuts, alcoholic and non-alcoholic beverages, salty snacks, tea, and coffee [27]. Therefore, the FFQ is an appropriate tool to assess and characterize usual dietary intakes (both nutrients and food groups) of adults in epidemiological studies.
All foods and beverages consumed by study participants were categorised into four food groups by two experts (TCM and YAM) based on the NOVA food classification definitions which consider the purpose, nature, and the extent of food processing. The agreement in classification of foods by the two individuals were checked by a senior nutritional epidemiologist (ZS). All foods were classified into one of the four groups: (1) unprocessed or minimally processed, (2) processed culinary ingredients, (3) processed foods and (4) ultra-processed foods (UPF). The current study defined UPF as described by previously published studies on the association between UPF consumption and health outcomes [28, 29]. The total number of foods and beverages, 275 in total, had their gram amounts determined based on each question about food frequency and serving size. Out of these, 145 were categorized as UPF. When calculating the DHQ gram variables, it was found that more than one question contributed to the gram amount for a particular food. Generally, food items were categorised as UPF if they were carbonated drinks, savory packaged snacks; ice cream, chocolate, confectionery; mass-produced packaged breads and buns; margarines and spreads; industrial cookies, pastries, cakes, and cake mixes; breakfast ‘cereals’, ‘cereal’ and ‘energy’ bars; ‘energy’ drinks; flavoured milk drinks; cocoa drinks; sweet desserts made from fruit with added sugars, artificial flavours and texturizing agents; cooked seasoned vegetables with ready-made sauces; meat and chicken extracts and ‘instant’ sauces; powdered or ‘fortified’ meal substitutes; pre-prepared pies, pasta and pizza dishes; poultry and fish ‘nuggets’ and ‘sticks’, sausages, burgers, hot dogs, and reconstituted meat products, and instant soups, and noodles (Supplementary Table 1).
The proportion of UPF consumption in the diet (% weight/day) was estimated by dividing the sum of all UPF items (in gram/day) to the total daily dietary intake of individuals (the sum of all food items of the four NOVA groups). The percent of weight ratio was further categorized into quintiles. For comparison and face-validity with published findings, we also calculated the percentage contribution of UPF consumption in the total dietary energy (% kcal/day). The main result of this study was compiled using percent of UPF consumption in weight ratio because percent weight ratio accounts foods that do not provide energy such as artificially sweetened drinks and non-nutritional factors mixed during food processing (additives, neoformed contaminants and other by-products) [30, 31].
Assessment of other covariates
Participants’ baseline demographic characteristics such as sex, age, ethnic background, marital status, education, occupational status, study arm and family history of lung cancer, lifestyle factors and medical history including cigarette smoking (never, current and former smoker), body mass index (BMI), history of hypertension, diabetes mellitus, heart attack, stroke, colon comorbidity, liver morbidity, emphysema, chronic bronchitis, aspirin and ibuprofen use were measured using baseline questionnaire (BQ). Physical activity (minutes/session) and family income were measured by supplementary questionnaire (SQ) in 2006/2007. BMI was determined by the ratio of weight (in kg) to height (in m2) and categorised into four groups as underweight (BMI < 18.5), normal (BMI ≥ 18.5 and ≤ 24.99), overweight (BMI ≥ 25 and ≤ 29.99) and people with obesity (BMI ≥ 30). Average family income was grouped into three categories: < $50,000, between $50,000–$99,000 and ≥ $100,000. Physical activity was measured in terms of the total time spent (in minutes) during each session for moderate-to-strenuous exercise documented from the self-reported SQ. Age at completion of DHQ, total energy intake (kcal/day), Healthy Eating Index-2015 (HEI) and alcohol consumption, which is the sum of alcohol from beer, wine, and liquor, were assessed from DHQ. Date of completion and outcome occurrence (between 1998 and 2018) were found in the DHQ and brief survey questionnaire, respectively.
Ascertainment of outcomes
The outcomes of the current study were risk of mortality from overall CRDs, COPD and lung cancer. Mortality status was ascertained through an annual review update form and mortality is also linked periodically to the US National Death Index. The PLCO trial used the International Classification of Diseases, ninth Revision (ICD-9) to define the underlying causes of mortality, from death certificates: lung cancer (code: 162- malignant neoplasms of trachea, bronchus, and lung), COPD and allied conditions (code: 490–496 includes bronchitis not specified as acute or chronic, chronic bronchitis, emphysema, asthma, bronchiectasis, extrinsic allergic alveolitis and chronic airways obstruction, not elsewhere classified). In this study overall CRD mortality referred to any death caused by CRDs including COPD, malignancy of trachea, bronchus, and lung, diseases of mediastinum and pleura, and all other unspecified as acute or chronic diseases of respiratory system. Mortality from acute respiratory diseases were excluded.
Statistical analysis
After computing the contribution of the proportion of UPF consumption, participants’ baseline characteristics were compared by quintile of UPF consumption using Chi-Squared tests for categorical variables (proportion) and analysis of variance for continuous covariates (mean). We used Cox proportional hazard model to determine the association of proportion of UPF consumption and mortality due to overall CRDs, COPD, and lung cancer. The main exposure variable, UPF consumption was fitted to the Cox regression model as a categorical (quintiles) and as continuous variable (per 5% absolute increment in the proportion of UPF consumption). Study participants contributed to person-years until the date of completion of DHQ, diagnosis of lung cancer, death, or the last date of completion of the brief survey questionnaire.
Models were adjusted for a range of potential confounders defined a priori. As recommended, we identified these confounders based on the available literature, rather than relying solely on statistical criteria [32, 33]. Initially, we conducted an unadjusted model by including UPF intake and the risk of outcomes in the model without other covariates. Subsequently, we adjusted for age and sex to examine their impact on the association. Finally, in the multivariable-adjusted models, we assessed the association between UPF intake and CRDs for each outcome by adjusting for age (in years), sex (men vs women), study arm (intervention vs control), ethnicity (Hispanic vs non-Hispanic), marital status (married, widowed, divorced, separated/never married), education (up to high school, post-high school training, college graduate), occupation (homemaker, employed, retired), family history of lung cancer (yes, no), smoking (never, current, former), BMI (< 18.5, 18.5–24.99, 25–29.99, ≥ 30 kg/m2), dietary energy (kcal/day), alcohol consumption (g/day), diabetes (yes, no), hypertension (yes, no), chronic bronchitis (yes, no), emphysema (yes, no), heart attack(yes, no), and stroke (yes, no).
However, residual confounding can not be ruled out. Thus the e-value was determined to assess the minimum strength of association, on the risk ratio scale, which an unmeasured confounder would need to have with both the exposure and outcome to fully explain away the UPF-outcome association, conditioned by the measured covariates using the package ‘EValue’ version 4.1.3 in R-software [34].
We determined the linear trend across the quintiles of UPF consumption and in relation to each mortality cause and investigated the assumptions of proportionality of the Cox regression using a global test of Schoenfeld residuals for non-significant values (all p-value > 0.05). A dose–response analysis for the non-linear relationships between the proportion of UPF consumption and the underlying cause of mortality from CRDs overall, COPD and lung cancer was determined using a restricted cubic spline with five knots (5th, 27.5th, 50th, 72.5th and 95th percentile). A 5% increment in UPF intake was taken as a benchmark because of the lowest significant association was observed at this value. We tested the p-value for non-linearity by making the coefficients of regression for the middle splines equal to zero [35].
To check the effect of heterogeneity between subgroups on the association of UPF consumption and mortality, subgroup analysis was done by stratifying the data using sex (men/women), age (55–59, 60–64, 65–69, ≥ 70), smoking (never, current, former), BMI (< 25, 25–29.99, ≥ 30) hypertension (yes/no), diabetes (yes/no), chronic bronchitis (yes/no), and emphysema (yes/no). Multiplicative interactions were checked using the p-value for interaction, which resulted from the likelihood ratio test [36].
The cause-specific hazard estimates obtained from Cox proportional regression models may be impacted by competing risks. To overcome this, we used the cumulative incidence function and Fine-Gray’s competing risk regression to estimate the marginal probability of competing events and sub-distributional hazards respectively. In contrast to Kaplan Meier and Cox models, the Fine-Gray competing risk regression provides a better estimation for the risk of the main outcome of interest when one or more competing risks are presented [37].
Sensitivity analysis
The following sensitivity analyses were performed after generating the final model: (1) including covariates with missing values such as family income and physical activity (which had 28% and 24% of values that were missing, respectively) and other covariates with missing values (Supplementary Table 2) in the regression model using multiple imputation (MI). MI was performed using multivariate imputation by chained equation, the MICE Methods [38] (20 data sets imputed) for covariates with missing values. MI is preferred and more efficient than complete case when data are missing at random but when data are missing completely at random, both MI and complete-case analysis have negligible bias. In general, complete case analysis is biased towards the null when data are missing at random and has negligible bias when missingness is independent of the outcome. However, when missingness is independent of the outcome, MI is biased away from the null [39]. Given these and smaller standard error (Se) in the final models for complete-case analyses than MI (e.g. Se: 0.072 vs 0.083 for highest UPF category of lung cancer mortality), we presented the main findings using complete-case analyses. (2) participants with baseline diabetes, hypertension, stroke, emphysema, obesity, and heart attack were excluded to explore the potential effects on cause-specific hazard estimates; (3) excluding deaths that occurred during the first 5 years of follow-up for lung cancer, COPD and overall CRDs mortality to evaluate if the observed association resulted from reverse causation; (4) excluding deaths from lung cancer and COPD from all-cause mortality and overall CRDs mortality; (5) additionally adjusted for nutritional factors that are highly linked to health outcomes [30]. These variables included: alcohol consumption, dietary sodium, total fat, trans-fatty acid, fiber, and polyunsaturated fatty acid (PUFA) intake. In the analysis, nutrient intake was adjusted for energy using residual method. (6) We also examined the association between overall UPF consumption (gm/day) and risk of mortality from CRDs overall, COPD and lung cancer by adjusting for each subgroup of UPF, fish, fruits, and vegetable intake. The individual contributing foods of UPF were further categorized into seven subgroups (animal-based processed foods; artificial and sugar-sweetened beverages; salads, spreads, and sauces; milk shakes, sweets, and condiments; quick breads, ready-to-eat/heat grains; cookies, and savoury foods; and other UPF intake) (Supplementary Table 1). Besides for each subgroup of UPF intake, fish, fruits and vegetable intake, models were also adjusted for age, sex, study arm, ethnicity, marital status, education, occupation, smoking status, BMI, family history of lung cancer, history of comorbidities, alcohol intake. Additionally, we further examine the association between UPF intake and risk of mortality due to CRDs overall, COPD and lung cancer by accounting the intensity of current and former cigarette smokers (never, currently smokes 1–10 cigarettes/day, currently smokes 11–20 cigarettes/day, currently smokes 21+ cigarettes/day, former smoker who quit less than 10 years ago, 11–20 years ago, more than 20 years ago) [40].
A secondary analysis on the association of contribution of UPF in energy ratio and mortality from overall CRDs, COPD and lung cancer was undertaken to compare the robustness of the findings with the current and already available studies. A hazard ratio (HR) with 95% of confidence interval (CI) and a p-value < 0.05 were used to declare statistical significance and all tests are two-sided. All analyses were done using R statistical software (version 4.2.2).


留言 (0)