
記住我
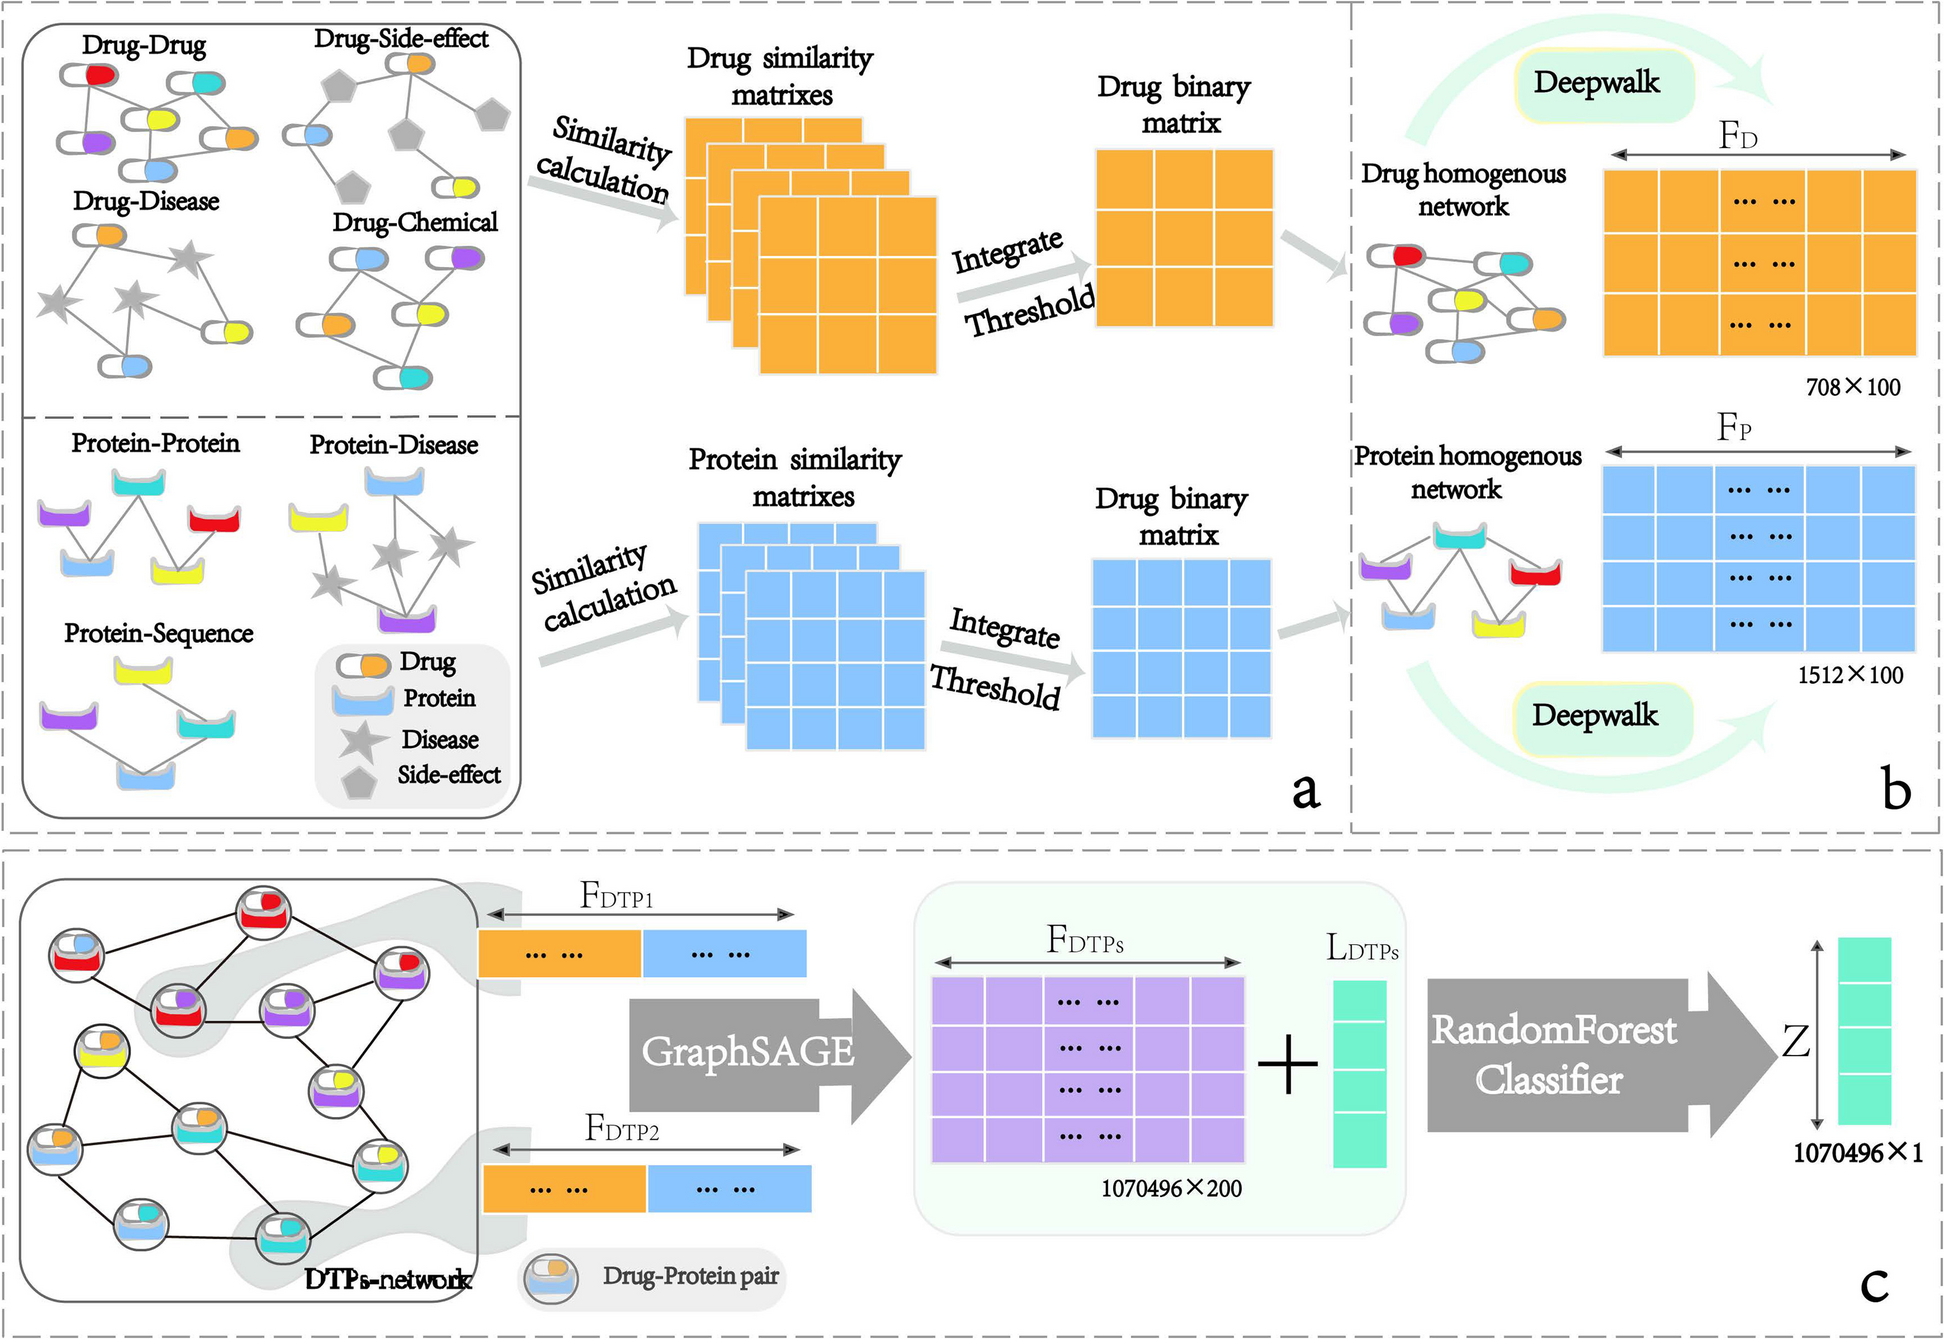


H. pylori is a paradigm organism for the study of epigenetic modification in bacteria, since it possesses an exceptional wealth of diverse DNA-methylating enzymes and cognate target sequences. Each strain expresses a set of approximately 20 active MTases, capable of catalyzing m5C, m4C, or m6A DNA modifications [13, 16, 27]. Strain-specific sets of MTases in H. pylori are highly diverse [13, 18, 22]. Genome methylation in H. pylori has previously been primarily detected by restriction enzyme protection assays and antibody-based detection assays in bulk format, such as dot blots using custom antibodies [10, 11, 27], which do not offer high sensitivity or resolution. “Third-generation” long-read sequencing analyses (PacBio) [31] have been used to detect genome-wide methylation in H. pylori [13] despite limitations with respect to the detection of cytosine (m5C) methylation and quantitation at a single-base resolution. This study now evaluates a method for methylation analysis that is complementary to third-generation sequencing in both these respects. In Fig. 1A, we show the genome-wide distribution of three MTase target motifs leading to DNA cytosine methylation for H. pylori strain N6, which were detected before by SMRT sequencing for strains 26695, J99 [13], and BCM-300 [13, 23]. Calculating the expected methylation at certain cytosine motifs (Fig. 1B, C), we also found that at best about 3% of all cytosines in the genome, situated in the known specific target motifs, are predicted to be methylated (see also [22]), which does not afford a sufficiently high sensitivity to quantitate minor methylation changes with any bulk detection methodology. The GCGC motif is calculated to be the most prevalent of the predicted methylated motifs in H. pylori strain N6 and in other strains, at about 1.8% of all cytosines (Fig. 1B) [22], mediated by the enzyme M.HpyAVIII. We calculated that the other two cytosine MTases in N6 (Tm4CTTC- or m5CCTC-methylating) would only amount to about 0.8% methylation contribution each per all genomic cytosines. In the present study, we initially performed bulk detection of methylated cytosines of bacterial DNA of different H. pylori strains and mutants, shown for N6 wild type and two isogenic MTase mutants (Fig. 1C), using an ELISA-like setup with an m5C-specific antibody. Using this method, we reproducibly detected quantitative differences of overall methylation in bulk (Fig. 1C), which was m5C-specific and lacking in the GCGC mutant, although the detection was at low sensitivity, and not at motif-specific resolution. m4C-specific methylation was not detected by this method (Fig. 1C).
Fig. 1
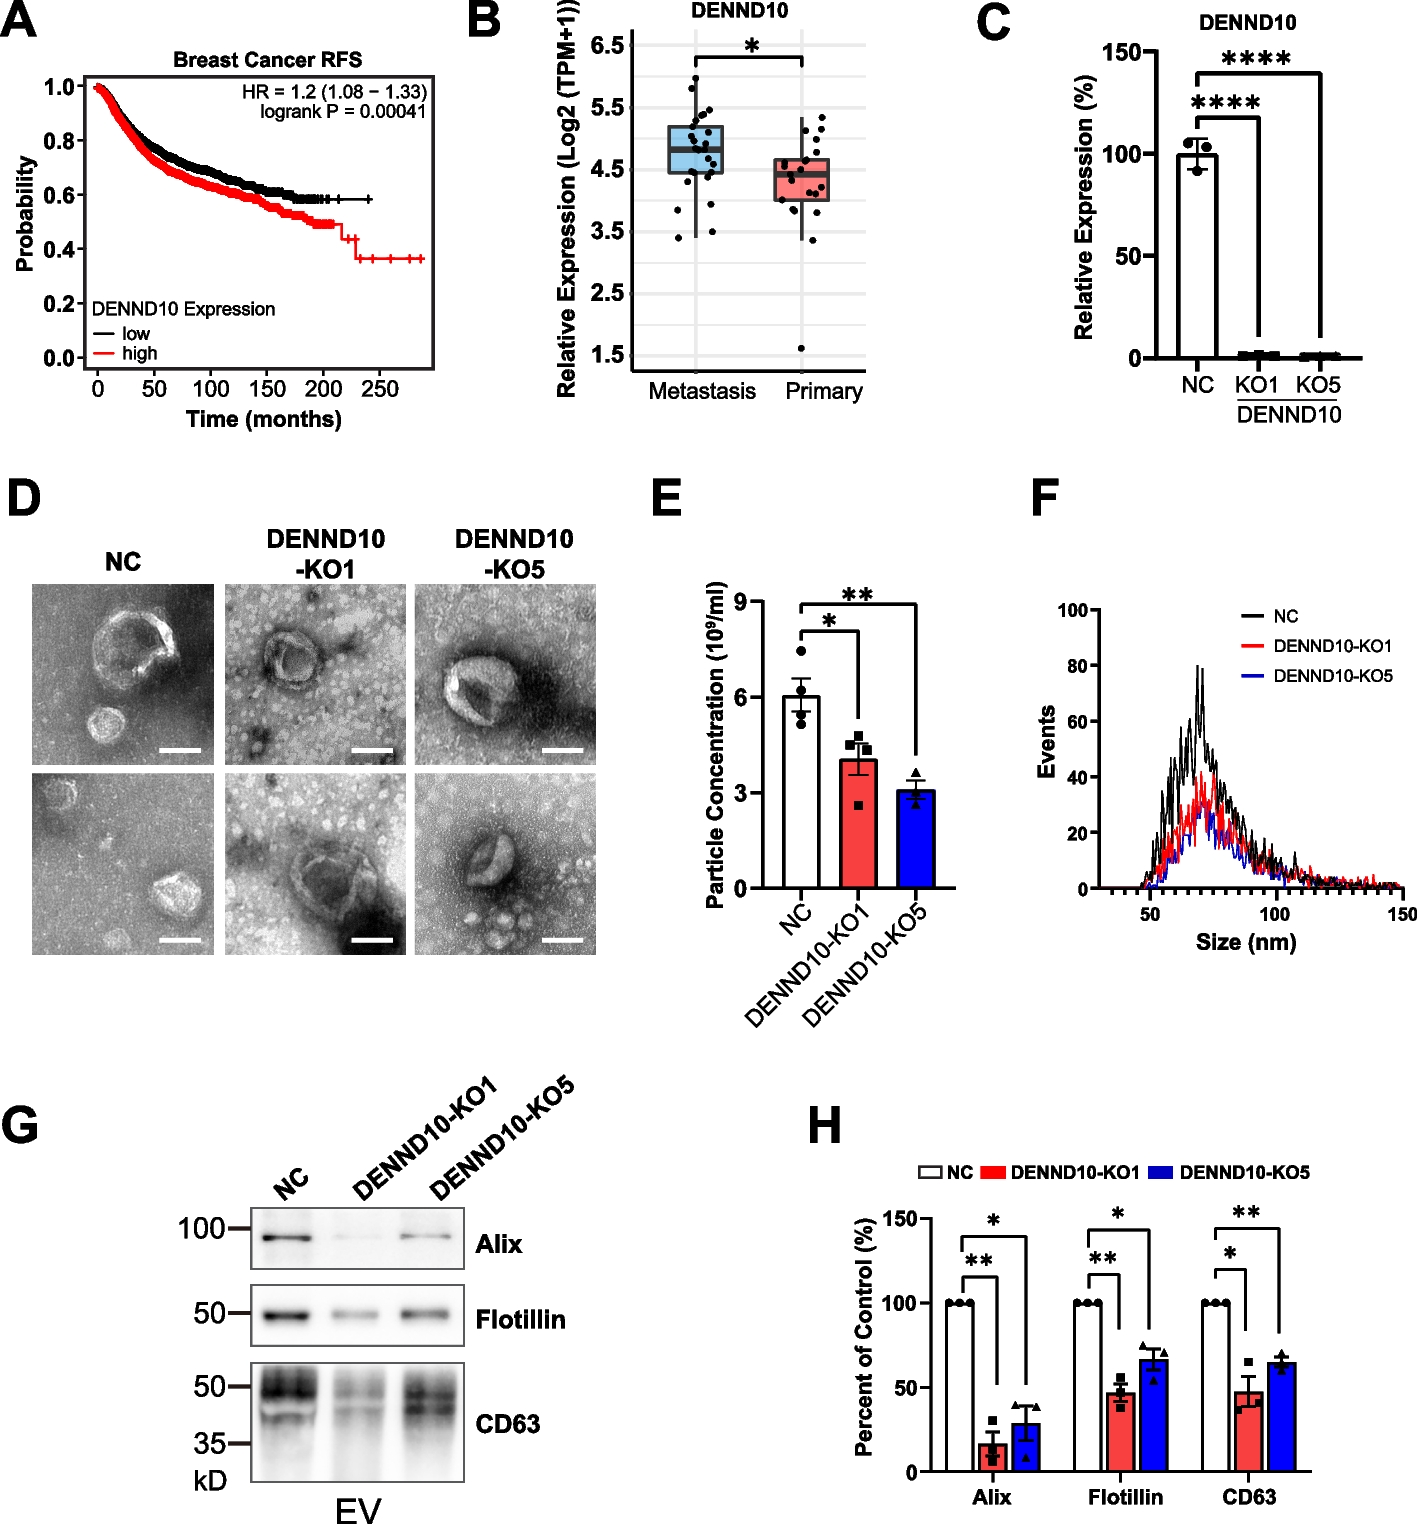
Broadly predicting and detecting DNA cytosine methylation in the H. pylori genome. A Predicted distribution of GCGC (red), CCTC (orange), and TCTTC (petrol) methylation motifs along the genome of H. pylori strain N6. B Proportion (percentage) of potentially methylated cytosines at the GCGC (red label), CCTC (orange label), and TCTTC (petrol label) motifs among all cytosines in the H. pylori N6 genome (outer circle). Proportion of each type of cytosine-methylatable motif among all methylated cytosines in the genome of H. pylori N6 (inner circle). C Experimental bulk detection of methylated cytosines in H. pylori N6 wild type strain (N6-wt) and MTase (Gm5CGC MTase – N6-gcgc, M.HpyAVIII; Tm4CTTC MTase – N6-tcttc, M2.HpyAII) isogenic mutants, by m5C-specific antibody ELISA in multi-well plates. PCR product is shown as non-methylated negative control. m4C methylation in TCTTC motif (N6-tcttc) is not recognized by the.m5C-specific antibody. Statistically significant differences between conditions were calculated using ordinary two-way ANOVA. Significances are marked: *p < 0.05; **p < 0.01
Global and single-base local quantitative resolution of genome-wide cytosine methylation detection at Gm5CGC motifs using EM-Seq in H. pyloriIn order to obtain more comprehensive and higher-resolution genomic information about cytosine (m5C, m4C) DNA methylation in H. pylori [22], we then turned to a recently established methodology for human DNA, NEBNext Enzymatic Methyl Sequencing (EM-Seq). EM-Seq involves a direct DNA methylation detection at cytosines on primary, isolated DNA, which is aided by a two-step enzymatic protection of methylated cytosines and the subsequent enzymatic deamination and conversion of non-methylated cytosines to thymidine (“ Methods” and schematic in Additional file 1: Fig. S1A; [29]). The initial questions we asked in this study were how reliably and quantitatively the EM-Seq method can detect m5C and m4C modifications in bacterial DNA, using H. pylori (strain N6, Additional file 2: Table S1) as model organism. As a negative control strain, we used a newly constructed isogenic GCGC MTase insertion-inactivation mutant of strain N6, in which the Gm5CGC-specific MTase (M.HpyAVIII; encoded by the HP1121 gene in strain 26695) has been inactivated. Upon EM-Seq treatment of purified DNA, converted library preparation, whole-genome sequencing and mapping (“Methods;” Additional file 1: Fig. S1A, S1B; Additional file 2: Table S1), we were able to analyze the methylation status (Additional file 1: Fig. S1C, Additional file 3: Table S2) of genomic cytosines at high resolution, for most samples detecting 99.9% of all cytosines (Table 1), including those located in known and predicted MTase target motifs [13]. We successfully established adequate quality criteria for the technique (“Methods,” and Table 1), partially based on comparison of the N6 wild type with its isogenic GCGC MTase mutant and spike-in controls, such as the detection of > 99% total cytosine calls, more than 96% methylation rate of methylated positive control DNA (pUC19 plasmid) and less than 3% methylation (more than 97% conversion) of non-methylated lambda DNA. Converging with previous experience with eukaryotic DNA [29], at least a 20-fold genome coverage was required for reliable quantitative detection of single-motif methylation (Methods). This setup yielded average conversion frequencies of 2–3% (corresponding to an average single-base quantitative methylation of 97–98%) for the GCGC motifs in the N6 strain genome (Fig. 2A, and Fig. 3A for a second biological replicate), while the average conversion frequency for the same motif was 98.7% in the N6 GCGC MTase-deficient mutant (Fig. 2A, Table 1, Additional File 3: Table S2). We achieved single-nucleotide resolution quantitation (average percent of conversion per each motif) of methylation for the GCGC motifs in the wild type strain, as depicted as a dot plot in Fig. 2B and as average per-site conversion values in Additional file 3: Table S2. All single GCGC motif cytosines were consistently methylated (≤ 95% converted, in both biological replicates; Additional file 3: Table S2), at variable single-base average values (local methylation frequencies). Other, predicted non-methylated, cytosines (i.e., those not part of GCGC, TCTTC and CCTC motifs), for instance in the Am5CGT motif, which is predicted not to be methylated in strain N6 due to a lack of the respective enzyme activity (Fig. 2C), were reproducibly > 97% converted on a single-base level in both wild type and GCGC mutant bacteria DNA and thus confirmed as non-methylated, emphasizing the high accuracy of the method (Fig. 2C and Table 1). In the GCGC (MTase M.HpyAVIII) mutant strain, we reproducibly did not detect the GCGC motifs as methylated (98.7% average single-base conversion; Fig. 2D, Additional file 3: Table S2; statistics for global methylation comparison of two biological experiments with sequencing in Fig. 4B).
Table 1 List of EM-Seq experiments and quality control (QC) parametersFig. 2
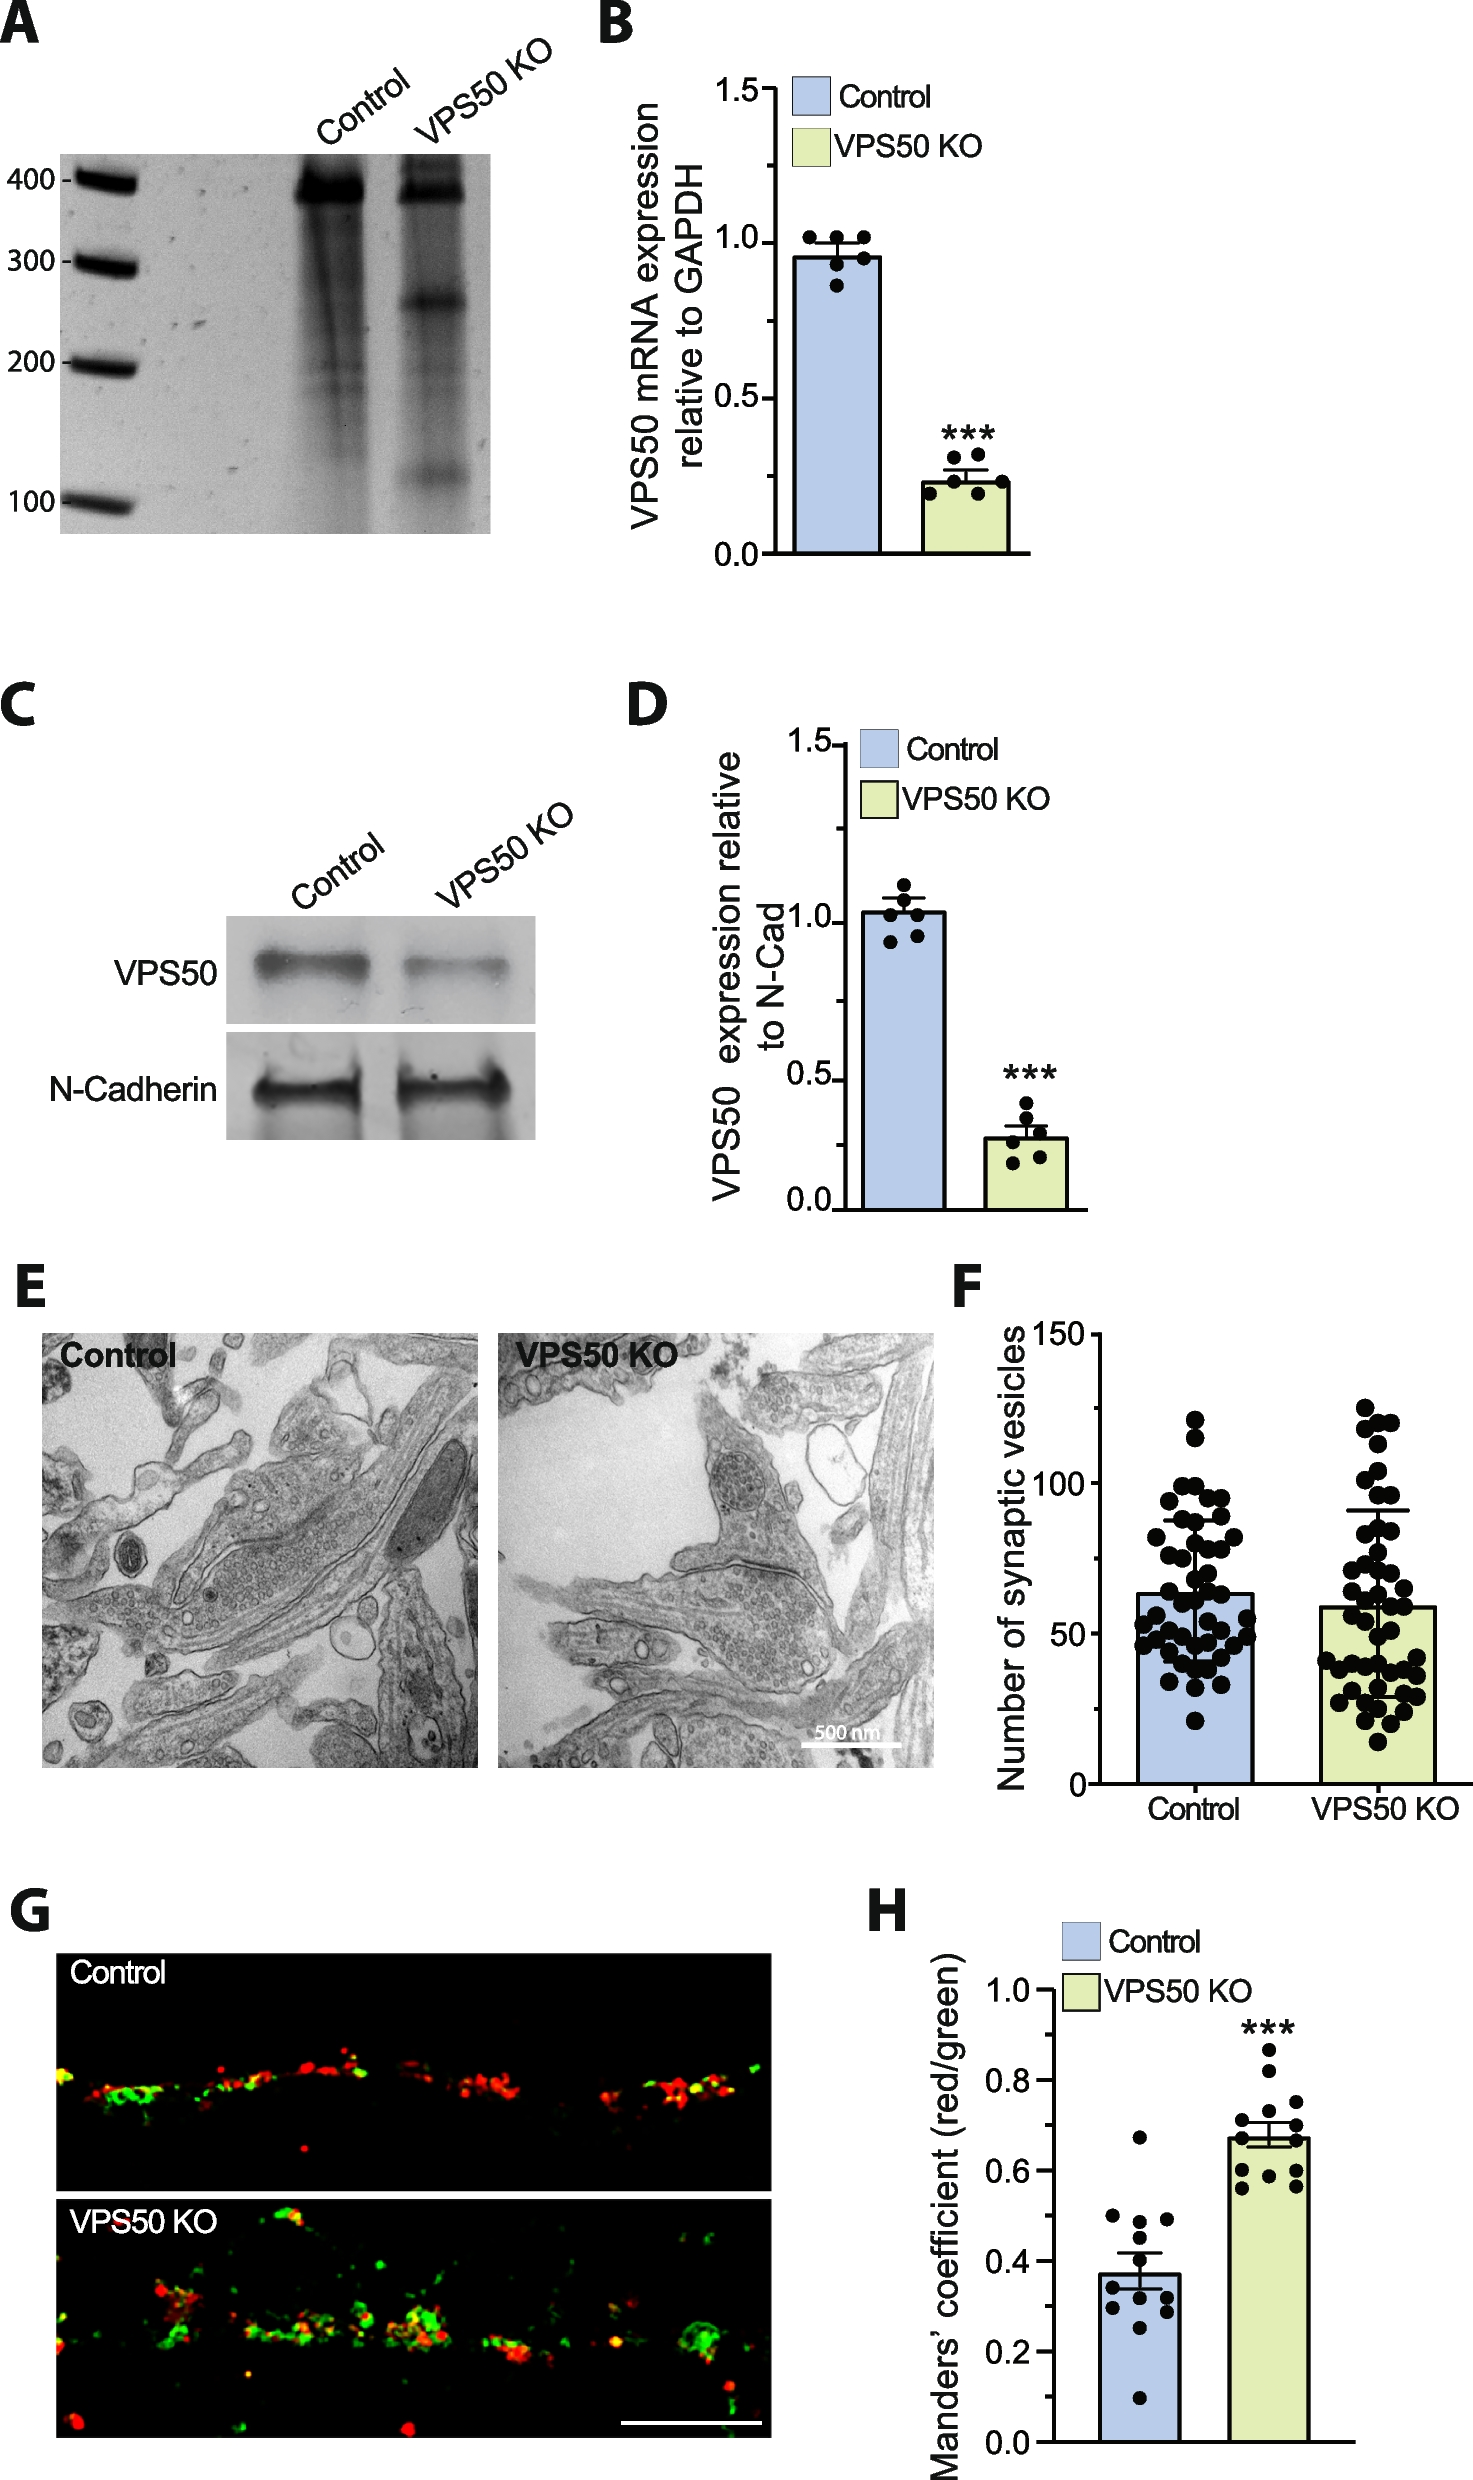
Genome-wide single-base resolution quantitative detection of methylated cytosine motifs in the H. pylori genome using EM-Seq. Comparing DNA methylation detected by EM-Seq methodology between H. pylori N6 wild type (N6-wt) and its isogenic GCGC MTase (M.HpyAVIII) mutant. Cytosines detected as converted are non-methylated, and non-converted cytosines are methylated. Higher conversion frequencies (calculated as average conversion frequency per motif count, summarized for all genomic motifs) indicate lower cytosine methylation. Experiments were performed in two replicates each, R1 and R2 (Table 1, Additional file 3: Table S2). A Bar graph of conversion frequency [%] per single motif for the GCGC motifs (motif counts on y-axis) in N6 wild type (N6-wt [replicate R1]) versus its isogenic HP1121 (M.HpyAVIII MTase) insertion mutant strain (N6-gcgc [replicate R1]), cultured on plates. B Dot plot of single-nucleotide resolution conversion frequency for each cytosine in GCGC motifs detected along the entire genome for wild type strain N6, same sample as in A, replicate R1. Conversion frequency (average [%]) for each motif cytosine is marked as one dot along the length of the whole genome (x-axis, labelled for genomic position). Low conversion frequency marks high methylation of the respective cytosine. Seventy-five percent of all cytosines in GCGC motifs were found to be 0% converted (quantitatively at 100% methylated). See also Fig. 7 and Additional file 3: Table S2 (single-base data) for more detailed analyses. C Bar graph of genome-wide conversion frequency for the ACGT motifs (which are not methylated in the N6 strain, due to absence of a motif-specific active MTase) in N6 wild type [R1] and its isogenic HP1121 mutant strain (N6-gcgc), same as in A, replicate R1. Motifs in bars were assigned according to their conversion frequency. D Dot plot of single-nucleotide conversion frequency for each cytosine in GCGC motifs detection along the entire genome for the H. pylori N6 M.HpyAVIII mutant (N6-gcgc [replicate R1]) cultured on plates. Conversion frequency (average [%]) for each motif cytosine is marked as one dot along the length of the whole genome (x-axis, labelled for genomic position). Low conversion frequency marks high methylation of the respective cytosine. We achieved > 95% average conversion detection for all relevant motif cytosines in this mutant, as one quality parameter of the method. In panels A and C, all single-motif-located cytosines of similar conversion frequency [%] were pooled into one bar (bins of 15); average percent conversion (x) of all respective motifs are indicated at the top of the graphs. Dot plot graphs at single-base resolution for the three methylated cytosine motifs along the genome in wild type (26695 strain) are included in Additional file 1: supplemental Figure S1
Fig. 3
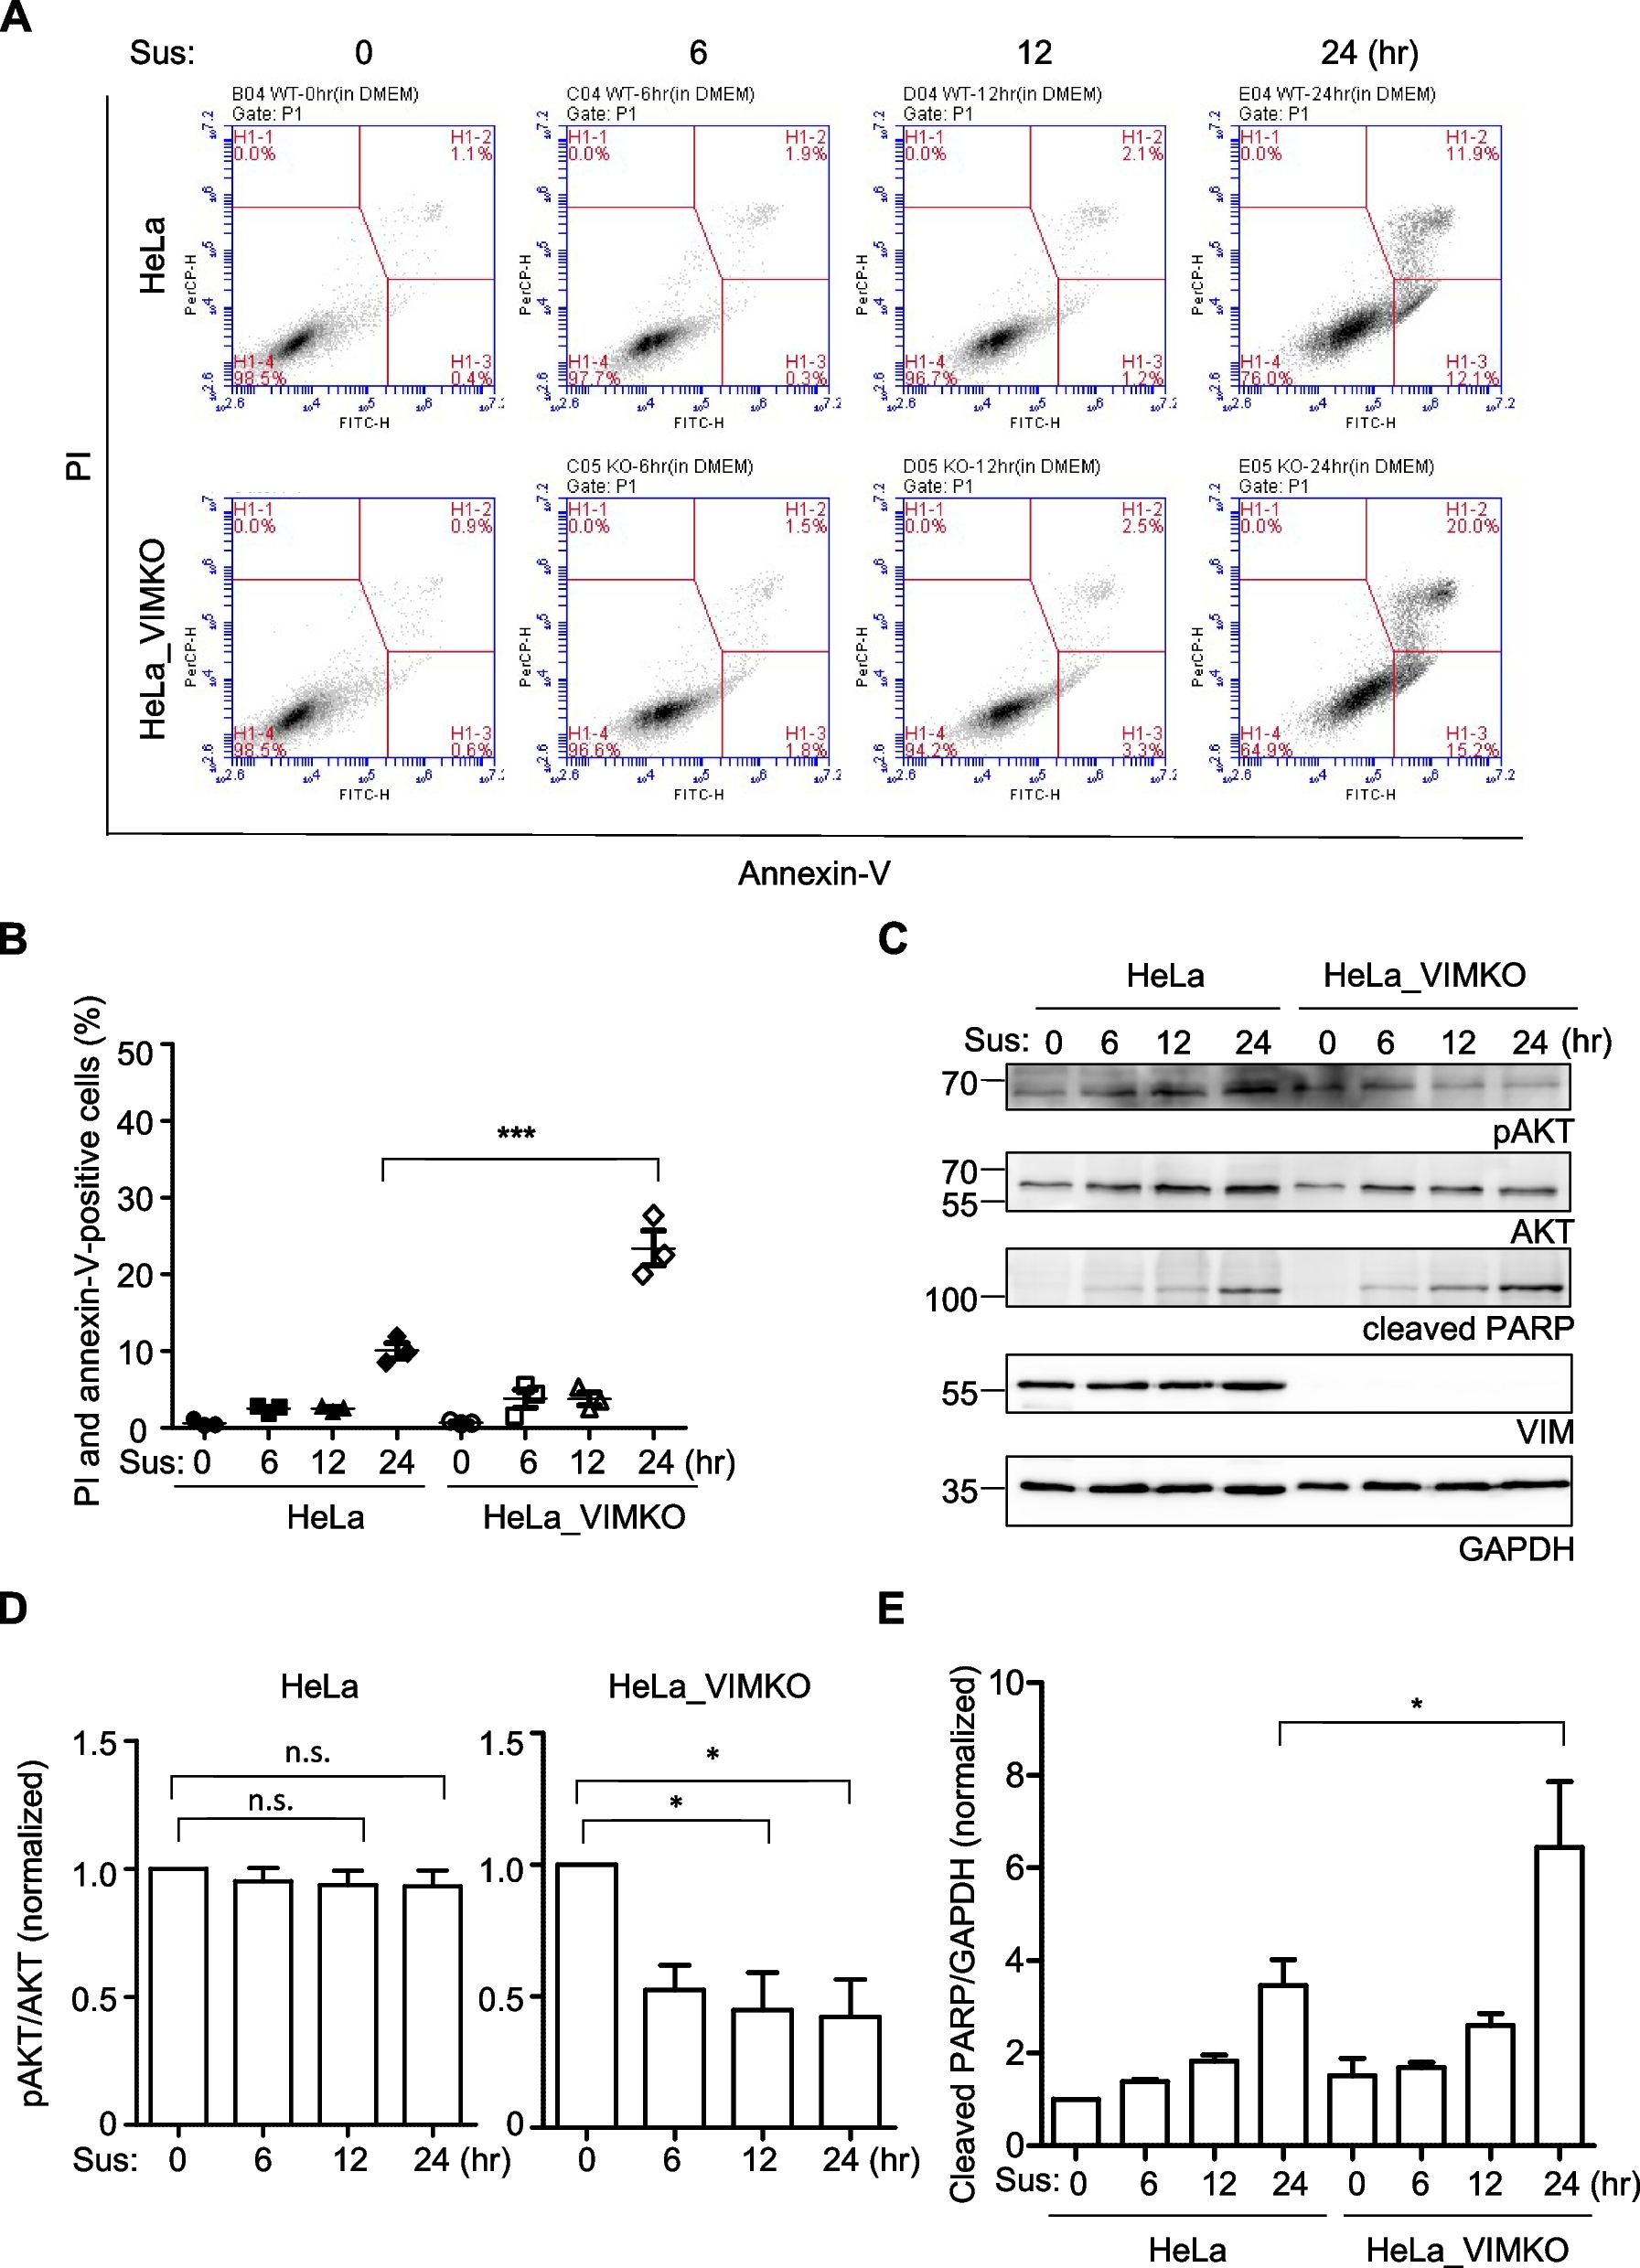
Comparing global averaged genome-wide DNA methylation at single-site resolution by EM-Seq between two different H. pylori wild type strains. A, C, and E show bar graphs for conversion frequency per genomic motif (EM-Seq experiments were performed in two biological and technical replicates [R1, R2]; one experiment for each strain, H. pylori N6 (N6-wt [R2]) or H. pylori 26695 (88-wt [R2]) shown); B, D, F show box plots with whiskers and statistics summarized for two biological and technical replicates (R1 and R2, see also Table 1 and Additional file 3: Table S2 for full conversion data) of each wild type strain (grown on plates). A and B show genome-wide results for methylation of the GCGC motifs (shown as conversion frequency [%]), C and D for the CCTC motif, and E and F for the TCTTC motifs. Chi-square p values for statistical significant differences between strains: * < 0.05 ** < 0.01 *** < 0.001 **** < 0.0001. Methylation of the two wild type strains was significantly different for the genome-wide quantitative single-nucleotide methylation average of CCTC motif methylation. In panels A, C, E, average percent conversion frequencies (x) for each experiment are highlighted at the top of the respective graphs. See Fig. 1B and Additional file 1: Fig. S1 for single-nucleotide resolution analysis of methylation for the three methylated cytosine motifs along the genome in the 26695 wild type strain (dot plots). Plots A, B, C, D, E, F are based on the conversion frequencies of all motifs shared between N6 and 26695 (88-wt), mapped to the 26695 genome (“ Methods”). Panel G depicts results of an MTase-Glo assay, performed in technical triplicates, showing significant differences in the SAH content (proxy of MTase activity) of the two different H. pylori wild type strains. Student's t-test ** p < 0.01
Fig. 4
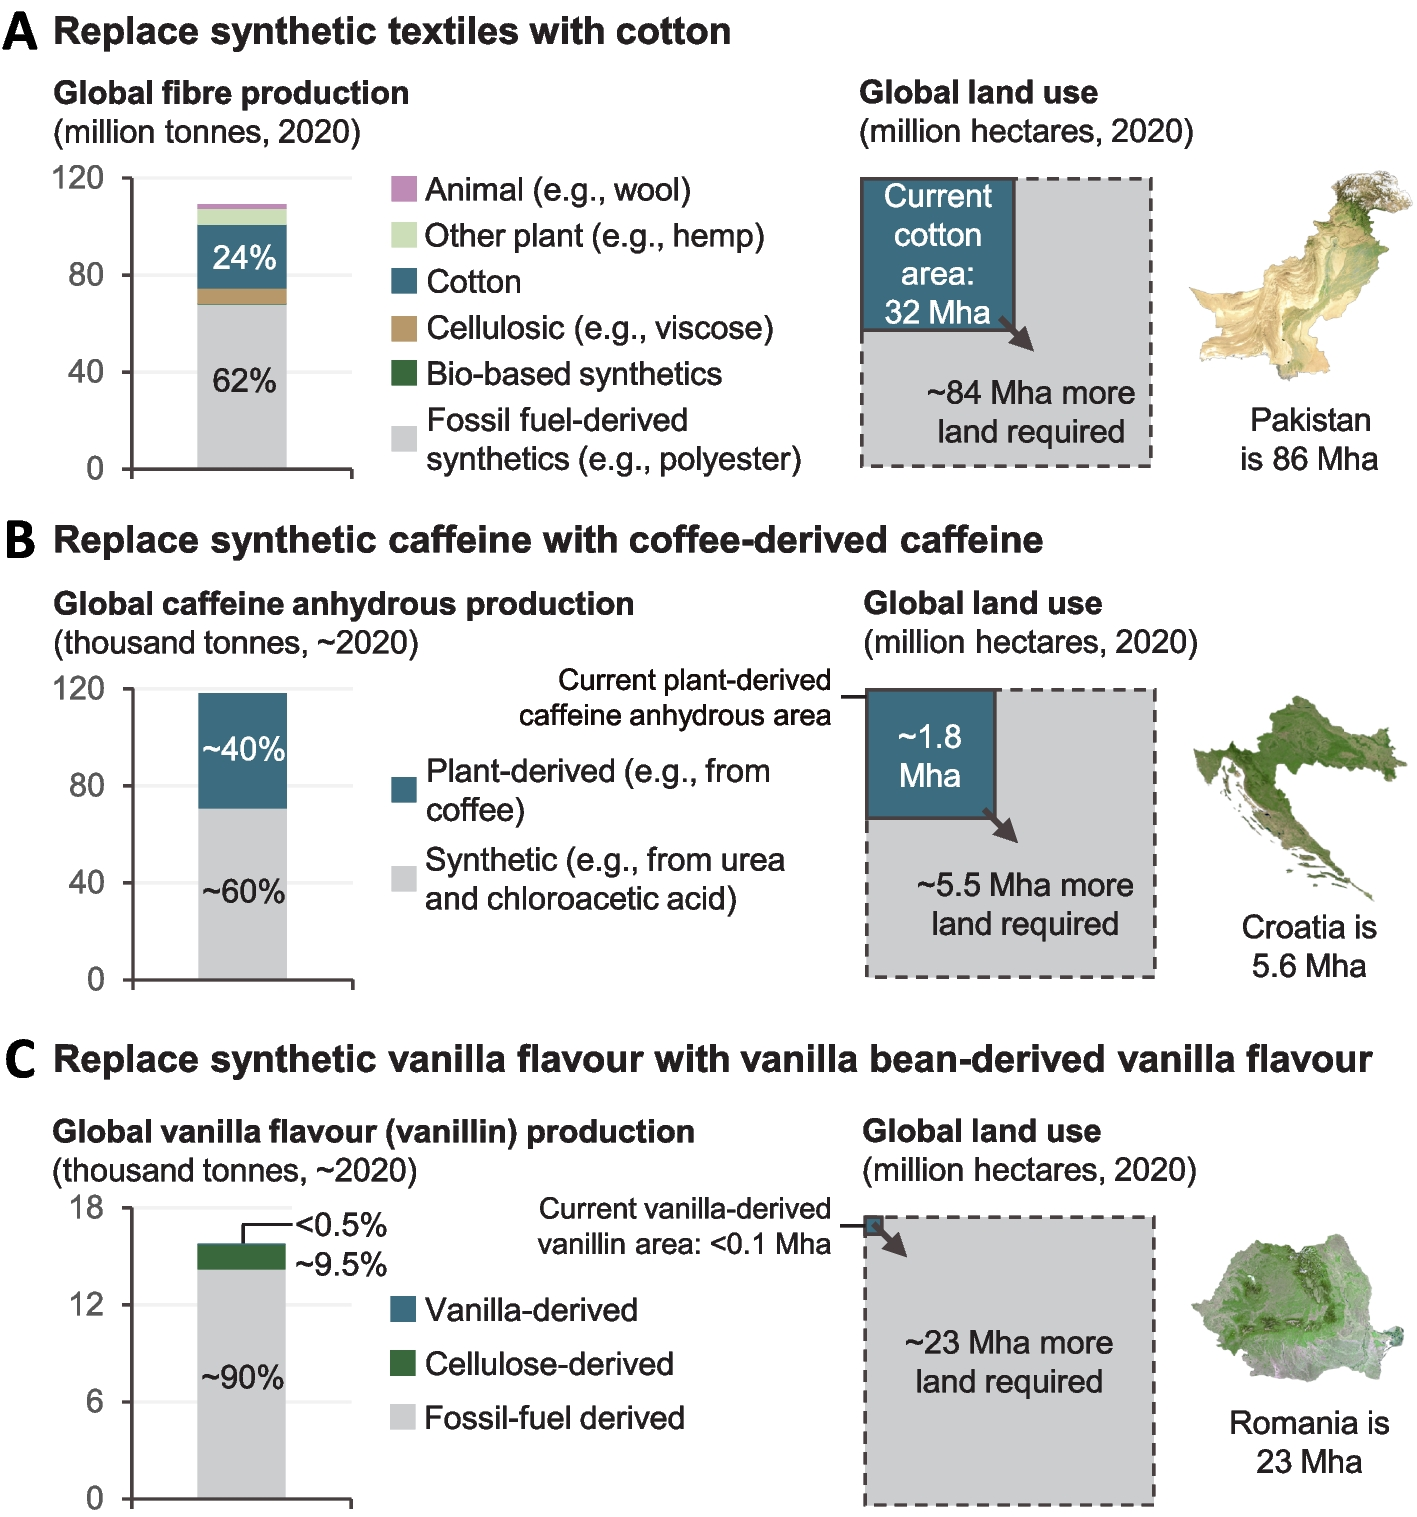
Comparing global averaged DNA methylation by EM-seq methodology in three different motifs for MTase mutants demonstrates significant differences for the single, methylated motifs between wild type and isogenic MTase mutants. A Bar graph comparison of genome-wide conversion frequencies for the GCGC motif in N6 wild type strain (N6-wt [replicate R2]) and both isogenic MTase mutant strains (N6-gcgc [R2]; N6-tcttc [R1]). B Statistical differences for the aggregated genome-wide single-base quantitative results of GCGC motif methylation between strains (two biological and technical replicates [R1, R2] for each strain were performed and are summarized). C Bar graph comparison of genome-wide conversion frequencies for the CCTC motif in N6 wild type strain and both MTase mutants as in A. D Statistical differences for the aggregated genome-wide single-base results of CCTC motif methylation between strains (two biological and technical replicates each). E Bar graph comparison for the genome-wide conversion frequencies for the TCTTC motif in N6 wild type strain and both MTase mutants, replicates as in A. F Statistical differences for the aggregated genome-wide single-base quantitative results of TCTTC motif methylation between strains (two biological and technical replicates each, see also Table 1 for replicate numbers; Additional File 3: Table S2 for full single-base conversion data). Chi-square p-value * < 0.05, ** < 0.01, *** < 0.001, **** < 0.0001. n.s. is non significant
EM-Seq comprehensively detects differential global and local quantitative methylation at single-base resolution at the three different methylated cytosine motifs, for m5C and m4CIn the N6 wild type strain, the two other predicted cytosine-methylated motifs in addition to GCGC, TCTTC ([m4C] methylated by M2.HpyAII), and CCTC ([m5C] methyl-modified by M.HpyAVI enzyme), were also reproducibly detected as methylated (differentially protected from conversion) (Fig. 3). When compared to the GCGC motif (Fig. 3A, B), CCTC motifs were on average also strongly quantitatively methylated, both at the genome-wide average and at single-base level (7.76% overall average conversion; Fig. 3C, D; Additional file 3: Table S2), but with slightly reduced methylation at a single-nucleotide quantitative level (Additional file 3: Table S2). As for each single CCTC motif, we found all except one to be consistently methylated in wild type bacteria (Additional file 3: Table S2). The single cytosine in a CCTC motif that was reproducibly identified as non-methylated (100% converted) was located in an upstream region of a gene of unknown function and homology (locus tag N6_01411, site 1,426,309; Additional file 2: Table S1). In contrast, the m4C methylated motif TCTTC displayed lower methylation both at the global and the local quantitative average levels than the other two motifs (Additional file 3: Table S2). Overall, the conversion frequency of genome-wide TCTTC motifs was at a 48.76% quantitative average (Fig. 3E, F; Additional file 3: Table S2). For the single TCTTC motifs, also all motifs but one were reproducibly detected as methylated (Additional file 3: Table S2). One single cytosine at site 546,255 in a TCTTC motif, in a CDS (locus tag N6_00526; Additional file 2: Table S1), which encodes an LPS keto-desoxy-octonate hydrolase subunit [32], was consistently not methylated (> 95% converted in all biological replicates).
We next addressed the reproducibility of the local single-base quantitative methylation results between different biological replicates. Therefore, we performed a cluster analysis on all the data points of single-site quantitative methylation (Additional file 3: Table S2) for all three cytosine motifs (“ Methods”), including four biological replicates of wild type H. pylori N6 grown under standard growth conditions. The clustering yielded different clusters of (i) reproducibly high-methylated, (ii) less reproducibly and differentially methylated (average intermediate single-base methylation), and (iii) reproducibly low-methylated local and unique sites for all three different cytosine motifs (Additional file 3: Table S2, Additional file 1: Fig. S2). Notably, for each of the three motifs in the wild type, we consistently detected clusters of reproducibly low/hypo-methylated cytosines in the respective motifs, which we analyzed separately. They comprise genes with an average higher quantitative single-site cytosine conversion (lower methylation) of 49.8% (GCGC motif), 40.3% (CCTC motif), and 71.6% (TCTTC motif), which, for each cluster, is significantly higher (see “ Methods”) than the genome-wide conversion average (Additional file 3: Table S2). Genes belonging to those clusters are summarized in Additional file 4: Table S3. While we cannot fully interpret the results right now, due to the complex biological networks and functional implications, we note that conspicuous consistently hypo-methylated sites are located in a number of genes of the virulence-associated cag pathogenicity island [33], in particular for the TCTTC and the CCTC motif sites. Further functions of CDS containing consistently hypo-methylated sites comprises cell division functions, central transcription factors, central metabolism, DNA restriction/methylation, and motility, including motility regulators (Additional file 4: Table S3).
Comparative genome-wide cytosine methylation in two different H. pylori strains at single-base resolution using EM-SeqWe next compared quantitative genome-wide information about cytosine methylation at single-base resolution for two different wild type strains, N6 [34] and 26695 (88-wt) [13, 35] for each individual methylation site of any specific motif in the genome, as was obtained by EM-Seq methodology. Due to its predicted set of active DNA MTases [22], strain 26695, like strain N6, is expected to methylate only three sequence motifs at cytosine positions, GCGC (m5C), TCTTC (m4C), and CCTC (m5C). The single-site average quantitative datasets obtained by EM-Seq analysis for the three different cytosine-methylated motifs in two biological replicates each differed substantially within each strain: while all three motifs were abundantly methylated across the genomes (Fig. 3, Additional file 1: Fig. S1B, S1C, S1D), GCGC was always the most densely methylated motif, with all relevant cytosines reproducibly more than 96% protected from conversion (Fig. 3A, B), at about 3% single-site average C-T conversion for strain N6 and 3.28% conversion for strain 26695, which was a non-significant difference over two biological replicates between strains. The CCTC motifs, at single-site resolution, were also strongly methylated, however with statistically significant inter-strain differences (all motifs were on average ca. 7% less methylated (+ 7% more converted) in strain N6) (Fig. 3C, D, Additional file 3: Table S2). The TCTTC MTase (M2.HpyAII) target motifs showed a distinctly different (lower) single-base quantitative motif methylation pattern in both strains, with a peak of detection at an average of 40 to 50% conversion for the motifs genome-wide (Fig. 3E, F), and without statistical between-strain difference. Comparing the transcript levels of the three MTases revealed the highest transcript amounts for M.HpyAVIII (gene HP1121) (Additional file 1: Fig. S3B), and about one log lower transcript levels for both M.HpyAVI (HP0051) and M2.HpyAII (HP1368) in strain N6 (Additional file 1: Fig. S3D). The absolute transcript amounts of the three MTases were overall lower in strain 26695 than in strain N6 under standard growth conditions (not shown). Intra-bacterial methyl donors for MTases are usually delivered to the respective biosynthesis pathways as S-adenosyl methionine (SAM, AdoMet), which is then cleaved and converted into S-adenosyl-homocysteine (SAH). Measuring SAH in cell lysates as a proxy for MTase activity and general SAM degradation, revealed much higher SAH content for strain 26695 (88-wt) (Fig. 3G), which strain showed significantly higher M.HpyAVI-dependent methylation than strain N6.
Loss of methylation in H. pylori MTase mutants affects quantitative methylation frequencies at unrelated motifsWe next tested whether loss of methylation in one abundant motif might influence modification of the two other cytosine motifs. In the GCGC MTase mutant (deficient in HP1121; M.HpyAVIII), we detected and quantitated methylation at the other two MTase target motifs, TCTTC and CCTC, with high confidence at single-base quantitative resolution, similarly as in the wild type (Fig. 4, Additional file 3: Table S2). When comparing quantitative methylation at the two unrelated motifs CCTC or TCTTC between the N6 wild type strain and the isogenic GCGC MTase mutant (Fig. 4), no significant differences in genome-wide average quantitative methylation were revealed (Fig. 4A to F, Additional file 3: Table S2), although we had hypothesized that loss of methylation in one abundant motif might influence modification of the two other cytosine motifs. Therefore, in addition to the GCGC mutant, we then compared another unrelated cytosine MTase mutant. Due to its interesting pattern of genome-wide average hypo-methylation, we selected the Tm4CTTC-specific m4C MTase M2.HpyAII and generated an allelic exchange mutant in strain N6. As expected, in the isogenic HP1368 (M2.HpyAII) mutant, we detected no methylation (> 99% global average conversion) of cytosines in TCTTC motifs (Fig. 4E, F, Additional file 3: Table S2). Surprisingly, in this mutant, the average single-base resolution quantitated methylation of both the GCGC and the CCTC motifs was significantly changed (more average conversion, meaning less methylation, for the GCGC motifs, less average conversion, meaning more methylation, for the CCTC motifs), compared to the parental wild type (Fig. 4B, D). This result was also reproducibly obtained using two independent biological and technical replicates. (Fig. 4). We speculate that this might be due to differential regulation of the enzymes or enzyme activities in the mutant, highlighting the possibility of crosstalk between different methylation systems.
EM-Seq detects growth-phase-dependent differential methylation levels at TCTTC and CCTC motifs in H. pyloriWe further used the EM-Seq approach to address whether global and local quantitative methylation at the three cytosine motifs varied during different growth phases. We assayed three different growth phases in liquid culture, corresponding to OD600 = 0.5, (early log phase), OD600 = 1.0 (mid-log phase), and OD600 = 1.5 (mid- to late-log phase, data not shown). For the stringently methylated motif GCGC, the global quantitative differences averaged over all motifs and taking into account two biological replicates each, were not significant between growth phases (Fig. 5A). Our analysis using the same replicate samples yielded, however, different averaged quantitative results during exponential growth for the CCTC and TCTTC cytosine methylation motifs (Fig. 5B, C). We detected an increase of average single-site methylation (i.e., decrease of conversion %) between two harvesting time points, O.D.600 of 0.5 and of 1.0, which was statistically significant for the CCTC motif (Fig. 5B). While we did not yet perform a comprehensive growth analysis nor a full analysis of the local quantitative methylation during growth, we noted genome-wide single-base quantitative changes in methylation frequency between the two harvesting time points for all motifs (Additional file 3: Table S2).
Fig. 5
Growth phase-dependent averaged genome-wide cytosine methylation changes in H. pylori detected by EM-Seq. H. pylori strain N6 wild type (N6-wt) was cultured in liquid medium and harvested at two different points during the growth phase, O. D.600 = 0.5 (early log phase) and O.D.600 = 1.0. (mid-log phase). Two biological and technical replicates were analyzed for each condition (see Table 1). Box plots with whiskers are shown for each experiment containing replicate summaries [R1 and R2] of the averaged single-motif quantitative cytosine methylation from the EM-Seq experiments (shown as conversion frequencies [%]; data in Additional file 3: Table S2). A Motif GCGC analysis; B Motif CCTC analysis; C Motif TCTTC analysis. Chi-square p-values for significance of differences between growth phases: * < 0.05, ** < 0.01, *** < 0.001, **** < 0.0001
EM-Seq analysis of H. pylori at different concentrations of the methyl donor, methionine, or in isogenic mutants deficient in methyl donor homeostasis reveals a differential influence on the methylomeH. pylori likely requires a high amount of methyl donors, converted into SAM, for their extensive genome methylation. We therefore hypothesized that acquiring a sufficient amount of methyl donors is an important housekeeping trait of the bacteria, affecting global and local methylation. SAM is thought to be provided to the bacteria through conversion of methylogenic amino acids (such as methionine), or, in some bacteria, regenerated using SAH recycling towards methionine via homocysteine, using MetH or MetE enzymes [36, 37]. H. pylori was reported to lack MetH and MetE enzymes [38,39,40,41], leaving amino acid/methionine uptake as the most likely and dominant source of methyl donors.
Using EM-Seq, we studied the genome-wide cytidine-motif methylations in H. pylori wild type, grown in liquid medium prepared with serum depleted for methionine (Methods), vs. in media supplemented with defined surplus concentrations of methionine (methionine-replete conditions, two biological replicates each). The data showed that methionine-replete conditions displayed a significant increase of quantitative genomic motif methylation for both GCGC and CCTC motifs when compared to methionine-low medium (Fig. 6A, B). The genome-wide average of single-base quantitative TCTTC methylation was not significantly different between methionine-depleted and defined replete conditions, while both conditions were significantly divergent to normal liquid medium (Fig. 6C). GCGC motif cytosine methylation had the most clear-cut association with methyl donor availability (methionine), as low methionine availability was significantly associated with genome-wide average lower cytosine methylation at those motifs (Fig. 6A). We also compared our standard liquid medium (BHI supplemented with yeast extract and 5% normal horse serum
留言 (0)