
記住我

Up to 40% of patients with severe blunt injuries suffer from rib fractures, and 7% have a flail chest.1–4 Flail chest leads to significant morbidity, with some reports suggesting as few as 43% of patients ultimately return to full-time employment.5 While isolated flail chest carries a 5% mortality risk, the overall mortality in the population of patients with a diagnosis of flail chest approaches 16%.1,5,6
Conservative management has historically been the cornerstone of management of flail chest. Over the past two decades, a growing body of evidence has developed in support of surgical stabilization of rib fractures (SSRF).7,8 Large observational studies have demonstrated strong associations between SSRF and improved mortality, which has led to increasingly liberal selection criteria for the procedure.8 The Chest Wall Injury Society and Eastern Association of the Surgery of Trauma both recommend SSRF in the presence of a flail segment.9,10 However, evidence from randomized controlled trials demonstrating benefit is inconsistent. While some studies suggest SSRF results in decreased resource utilization and improved long-term outcomes, others have raised significant concerns, including increased duration of mechanical ventilation and worse quality of life after SSRF.11–14 Most trials were small, and many used approaches to both SSRF and nonoperative management that would be considered outdated in the current era. Recent systematic reviews synthesizing this body of evidence suggest that SSRF is likely associated with benefit, albeit on the basis of low-quality evidence across all outcomes.15
Given the significant knowledge gaps that exist in the literature, the evidence available to guide the selection of patients most likely to benefit from SSRF remains limited. Although SSRF may be helpful to some patients, it is conceivable that others may either derive limited benefit or suffer harm because of these procedures. Furthermore, it is plausible that without clear guidance there is significant variation in the proportion of patients who undergo SSRF across trauma centers.
Our objective was to determine the extent to which variations in rates of SSRF across trauma centers exist and whether this variation might be associated with differences in outcomes. We hypothesized that there would be significant variation in the proportion of patients with a flail chest who underwent SSRF across trauma centers that was not explained by variations in case-mix, and that centers with a more liberal approach would have improved outcomes.
METHODS Study Design and Data SourcesWe performed a retrospective cohort study of adult patients who sustained a flail chest over a 5-year period (2016–2020) using data from the American College of Surgeons’ Trauma Quality Improvement Program (ACS TQIP) database. The objective of this study was to determine the independent association between center-level approaches to SSRF and patient-important outcomes. The ACS TQIP database includes all patients admitted to a participating center that have sustained at least one severe injury (as defined by an Abbreviated Injury Scale [AIS] of ≥3), present with signs of life and who are admitted to hospital.16,17 Over 875 trauma centers participate in TQIP, and the program ensures data reliability through a rigorous process of data validation.16–19 We obtained institutional review board approval for this study. Our findings are presented in accordance with STROBE guidelines (Supplemental Digital Content, https://links.lww.com/TA/D531).20
Study PopulationWe identified all patients aged 18 to 80 years who were diagnosed with a flail chest and managed at a Level I or II trauma center between January 1, 2016, and December 31, 2020. The presence of a flail chest and/or high spinal cord injury was determined using AIS diagnostic codes (Supplement Table 1, https://links.lww.com/TA/D532). We excluded patients with an AIS 6 (nonsurvivable injury) within any body region (n = 445), high spinal cord injury (n = 191), advance directives limiting care (n = 1,144), death within 72 hours (n = 1,798), or a penetrating mechanism (n = 9). We also excluded centers caring for fewer than five patients with flail chest per year on average (n = 5,525, 394 centers), to ensure robust center-level estimates.
Identification of InterventionPatients were determined to have undergone SSRF based on ICD-10 procedure codes (Supplement Table 1, https://links.lww.com/TA/D532). All other patients were considered to have undergone nonoperative management. Center-level rates of SSRF were derived by dividing the number of patients that underwent SSRF by the total number of patients admitted with a diagnosis of flail chest and meeting inclusion criteria.
Patient, Center, and Injury CharacteristicsWe characterized patients based on age, sex, race/ethnicity (White, Black, Hispanic/Latino, or other), insurance status (private/commercial, noncommercial, self-pay, or other), relevant comorbidities (Supplement Table 2, https://links.lww.com/TA/D532), mechanism of injury, shock on presentation (defined as systolic blood pressure <90 mm Hg), presence of severe traumatic brain injury (TBI) (defined as a combined Glasgow Coma Scale [GCS] of ≤8 and a head AIS score of ≥3), prehospital cardiac arrest, inter-facility transfer, Injury Severity Score (ISS), intubation in the emergency department (ED), and presence of severe abdominal (defined as AIS abdomen ≥3) or spine (AIS spine ≥3) injuries.21,22 Patients were considered to have isolated chest injury if the AIS score for all other body regions was ≤2.17,23
We recorded the year of admission and center-level characteristics: number of beds, volume of patients with flail chest and undergoing SSRF, teaching status, trauma center designation level, and hospital payer status (for profit vs. nonprofit/government).
Outcome MeasuresOur primary outcome of interest was hospital mortality. Secondary outcomes were duration of mechanical ventilation, duration of intensive care unit (ICU) stay, duration of hospital stay, discharge status, VAP, and receipt of tracheostomy. Patients undergoing tracheostomy were identified using ICD-10 procedure codes. All complications were defined according to standard TQIP definitions.24
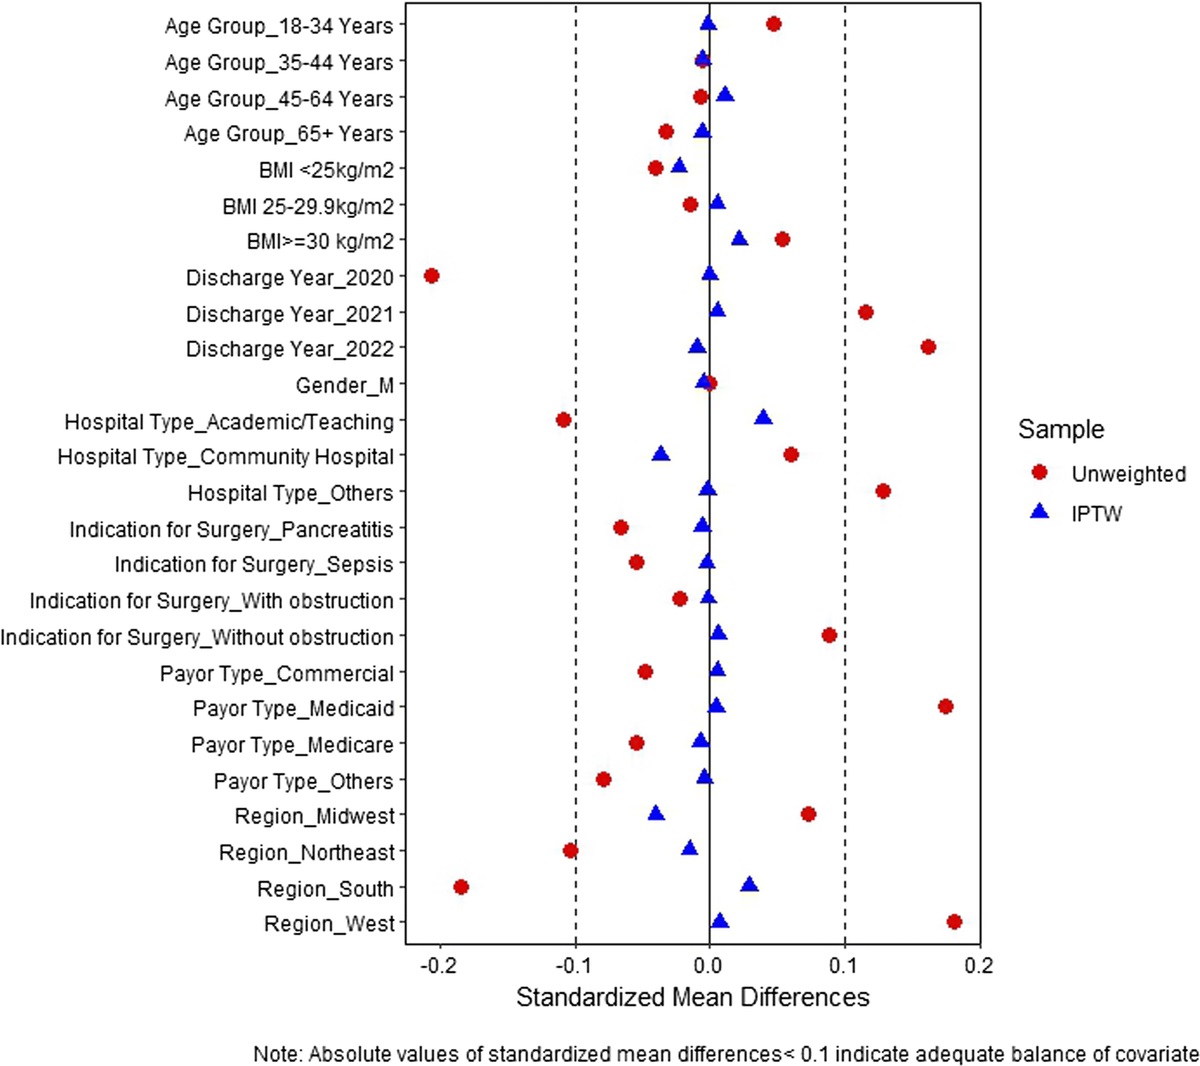
Statistical AnalysisBaseline characteristics were reported using descriptive statistics. Means ± standard deviation (SD) or medians and interquartile range (IQR) were calculated as appropriate for continuous variables, while counts and proportions were used for categorical variables. Proportions were compared across groups using Pearson's χ2 or Fisher's exact tests, while medians were compared using Wilcoxon’s rank-sum Kruskal-Wallis tests. Standardized mean differences (SMD) were used to compare characteristics of patients in the two treatment groups, and were considered statistically significant if greater than 0.1.25 Statistical analyses were performed using R version 4.2.1 (R Foundation for Statistical Computing, Vienna, Austria) and Stata BE version 17.0 (StataCorp, College Station, TX).26,27
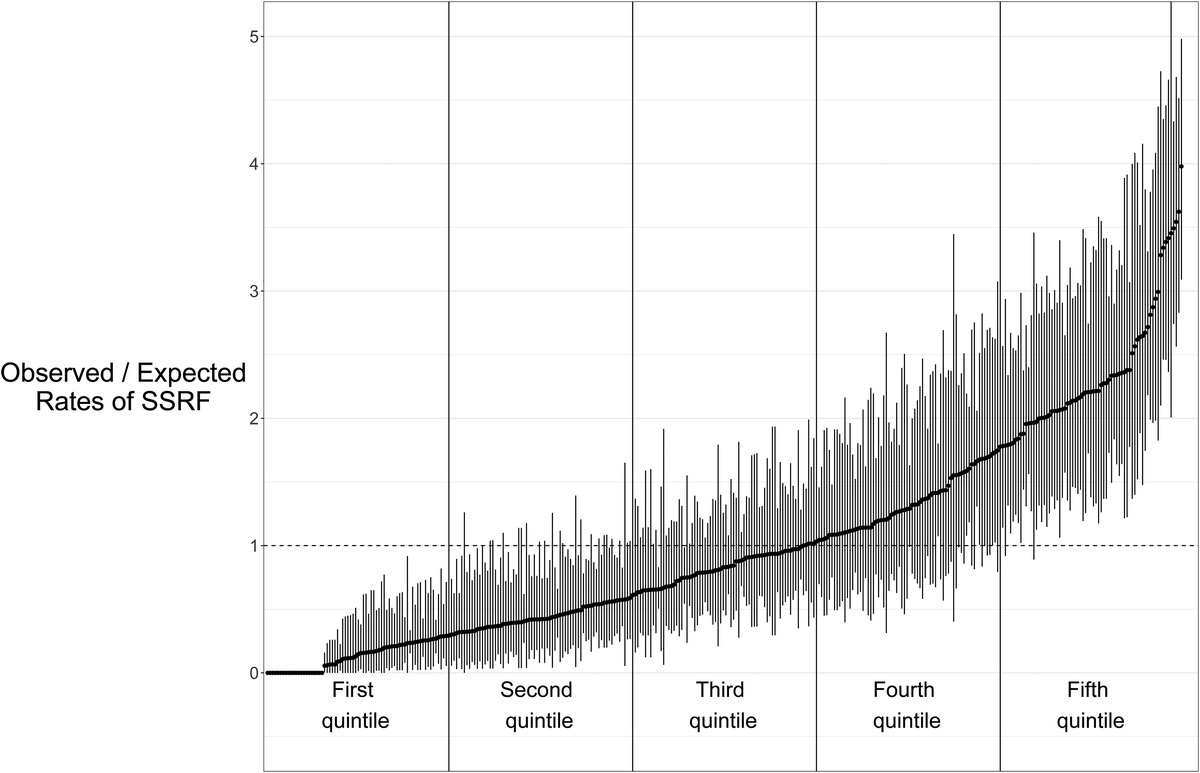
Impact of Center-Level Propensity to Perform SSRFWe hypothesized that case-mix differences across centers might confound associations between the center-level SSRF rate and outcomes. It is conceivable that centers with a higher proportion of patients with favorable prognostic factors might also have a more liberal approach to SSRF. To correct for this potential confounding, we calculated the case-mix adjusted rate of SSRF for each center. We first performed a multivariable logistic regression to estimate an individual's likelihood of undergoing SSRF. This model was adjusted for patient factors anticipated to influence the decision to proceed with SSRF including age, sex, race/ethnicity, insurance status, chronic obstructive pulmonary disease, functionally dependent status, congestive heart failure, chronic renal failure, total number of comorbidities, year of admission, ISS, shock on presentation, severe TBI, severe spinal injury, severe abdominal injury, isolated chest injury, mechanism, and whether patients were intubated in the ED. This model allowed us to estimate each patient’s predicted probability of SSRF. The sum of individual patient predicted probabilities within each center was then calculated to determine the number of patients expected to undergo SSRF. The observed number of patients undergoing SSRF at each center was divided by the expected number to obtain the center-level observed/expected (O/E) ratio of patients undergoing SSRF. This metric placed centers on a continuum from liberal to restrictive in terms of their approach to SSRF. Centers that perform SSRF on more patients than would be expected have an O/E ratio greater than one, while those who perform SSRF on fewer patients than expected have an O/E ratio below one. Centers were then grouped into quintiles based on their O/E ratios, with the fifth quintile representing the group of centers with the most liberal approach to SSRF.
We then performed a mixed-effects logistic regression to determine the independent association between center-level O/E ratio quintile and mortality. This analysis was repeated for all secondary outcomes, with duration of mechanical ventilation, ICU length of stay, and hospital length of stay analyzed using negative binomial regression. Mixed-effects models were used to account for clustering at the hospital level. We included the following covariates in each model: age, sex, race/ethnicity, insurance status, number of comorbidities, presence of severe brain, abdominal or spinal injury, shock on presentation, interfacility transfer, ISS, hospital teaching status, trauma center level, center size (number of beds), high-volume center (>12 SSRF procedures annually), mechanism of injury and year of admission. We chose a threshold of 12 cases/year to define a high-volume center based on previous studies demonstrating improved outcomes at centers that met this criterion.7
Subgroups of InterestWe hypothesized that certain subgroups of patients would be more prone to derive benefits from SSRF. Elderly patients (age ≥65 years), those with a severe brain injury, or with multisystem injuries may be less likely to benefit from SSRF, as they may have a more limited potential for recovery than younger patients or those with isolated chest injuries. We also hypothesized that patients intubated prior to undergoing SSRF were more likely to derive benefit, as suggested by a recent randomized trial.14 Since ACS-TQIP does not provide information on the timing of mechanical ventilation (that is, prior to vs. following SSRF), we restricted this subgroup analysis to patients intubated in the ED.
Impact of Undergoing SSRF at the Patient-LevelWe also explored the impact of SSRF at the patient level. While a center-level center measure of SSRF might appear to be harmful or neutral overall, there might nevertheless be select patients where SSRF is beneficial and who might not be identified in the overall cohort. Due to the complexity in decision-making related to SSRF, it is likely that the relationship between undergoing SSRF and outcomes is confounded by multiple factors, not all of which are accounted for in the ACS TQIP data set (frailty, anatomic considerations, etc.). To account for this unmeasured confounding, we performed an instrumental variable analysis to determine the association between patient-level SSRF and mortality. An instrumental variable analysis is a pseudo-randomized method that accounts for both measured and unmeasured confounding variables.28 The technique relies on two basic assumptions: 1) the instrumental variable is correlated with the independent variable of interest (in this case, undergoing SSRF); and 2) the instrumental variable is not correlated with the outcome of interest (i.e., hospital mortality), except through its association with the independent variable of interest. The instrumental variable chosen for our analysis was the center-level O/E ratio of SSRF. Treatment patterns at the center-level are commonly used as instrumental variables.17,29,30 Of note, instrumental variable analysis provides estimates of association in so-called marginal patients—that is, the subgroup of patients likely to receive different treatment depending on which center they are admitted to (high vs. low O/E ratio centers).31,32
We used the full-information maximum likelihood bivariate probit estimate to estimate the association between SSRF and mortality. To account for residual differences in patient and hospital characteristics across levels of the instrument, we included the same covariates in the model as for previous logistic regression analyses. As we were unable to confirm that the underlying assumptions of the instrumental variable were met within each subgroup of interest, the instrumental variable analysis was restricted to the primary cohort.
RESULTSWe identified a total of 23,619 patients with flail chest that met inclusions criteria across 354 trauma centers over the 5-year period. The median age was 56 (IQR 44–65) years, the majority were male (76.6%, n = 18,096), and over half (n = 13,834, 58.6%) had an isolated chest injury (Table 1). Overall mortality was 5.2% (n = 1,239). The median number of patients per center admitted with a flail chest over the 5-year period was 50 (IQR, 33–79) (Table 2).
TABLE 1 - Baseline Characteristics, by Treatment Approach Overall, N = 23,619 Nonoperative, n = 18,498 Operative, n = 5,121 Standardized Difference* Age, median (IQR) 56 (44–65) 56 (44–65) 55 (44–64) 0.02 Age category, n (%) 0.05 <65 17,503 (74) 13,631 (74) 3,872 (76) 65–69 2,515 (11) 1,981 (11) 534 (10) 70–74 2,027 (8.6) 1,626 (8.8) 401 (7.8) 75–80 1,574 (6.7) 1,260 (6.8) 314 (6.1) Female sex, n (%) 5,523 (23) 4,329 (23) 1,194 (23) 0.00 Race/ethnicity, n (%) 0.07 Non-Hispanic White 17,931 (76) 13,919 (75) 4,012 (78) Black 2,206 (9.3) 1,770 (9.6) 436 (8.5) Hispanic or Latino 2,126 (9.0) 1,724 (9.3) 402 (7.9) Other 1,356 (5.7) 1,085 (5.9) 271 (5.3) No. comorbidities, n (%) 0.01 0 9,010 (38) 7,084 (38) 1,926 (38) 1–2 12,036 (51) 9,350 (51) 2,686 (52) ≥ 3 2,573 (11) 2,064 (11) 509 (9.9) Insurance, n (%) 0.01 Private/commercial 11,336 (48) 8,801 (48) 2,535 (50) Noncommercial 8,692 (37) 6,934 (37) 1,758 (34) Self-pay 2,256 (9.6) 1,775 (9.6) 481 (9.4) Other 1,335 (5.7) 988 (5.3) 347 (6.8) Mechanism, n (%) 0.09 Fall 6,020 (25) 4,894 (26) 1,126 (22) Motor vehicle collision 11,968 (51) 9,288 (50) 2,680 (52) Pedestrian/cyclist struck 2,984 (13) 2,304 (12) 680 (13) Other 2,647 (11) 2,012 (11) 635 (12) Shock on presentation, n (%) 1,581 (6.7) 1,178 (6.4) 403 (7.9) 0.06 STBI, n (%) 1,916 (8.1) 1,629 (8.8) 287 (5.6) 0.12 Prehospital cardiac arrest, n (%) 224 (1.2) 190 (1.3) 34 (0.8) 0.05 Interfacility transfer, n (%) 6,811 (29) 5,357 (29) 1,454 (28) 0.01 ISS, median (IQR) 21 (16, 29) 21 (14, 29) 22 (17, 29) 0.08 ISS category, n (%) 0.13 9–15 5,903 (25) 4,919 (27) 984 (19) 16–24 9,065 (38) 6,911 (37) 2,154 (42) 25–75 8,651 (37) 6,668 (36) 1,983 (39) Isolated chest injury, n (%) 13,834 (59) 10,831 (59) 3,003 (59) 0.00 Severe abdominal injury, n (%) 3,693 (16) 2,768 (15) 925 (18) 0.08 Severe spine injury, n (%) 1,453 (6.2) 1,179 (6.4) 274 (5.4) 0.04 Intubated in the ED, n (%) 3,533 (15) 2,717 (15) 816 (16) 0.03 Head AIS ≥ 3, n (%) 4,302 (18) 3,551 (19) 751 (15) 0.12 Thorax AIS, n (%) 0.21 3 11,393 (48) 9,362 (51) 2,031 (40) 4 9,743 (41) 7,302 (39) 2,441 (48) 5 2,483 (11) 1,834 (9.9) 649 (13) Motor GCS on presentation, n (%) 0.02 1–2 2,758 (12) 2,158 (12) 600 (12) 3–4 666 (2.8) 505 (2.7) 161 (3.2) 5–6 20,132 (85) 15,782 (86) 4,350 (85) Year, n (%) 0.19 2016 4,384 (19) 3,656 (20) 728 (14) 2017 4,542 (19) 3,655 (20) 887 (17) 2018 4,533 (19) 3,529 (19) 1,004 (20) 2019 4,834 (20) 3,703 (20) 1,131 (22) 2020 5,326 (23) 3,955 (21) 1,371 (27) Trauma center level, n (%) 0.03 Level I 15,553 (66) 12,236 (66) 3,317 (65) Level II 8,066 (34) 6,262 (34) 1,804 (35) Hospital size (no. beds), n (%) 0.03 200 or fewer 1,055 (4.5) 829 (4.5) 226 (4.4) 201–400 5,126 (22) 3,891 (21) 1,235 (24) 401–600 7,430 (31) 5,961 (32) 1,469 (29) More than 600 10,008 (42) 7,817 (42) 2,191 (43) For-profit hospital, n (%) 2,267 (9.6) 1,693 (9.2) 574 (11) 0.07 Teaching status, n (%) 0.08 University teaching 12,823 (55) 10,234 (56) 2,589 (51) Community teaching 8,016 (34) 6,128 (33) 1,888 (37) Nonteaching 2,577 (11) 1,979 (11) 598 (12)*Statistical significance threshold >0.1
STBI, severe traumatic brain injury; COPD, chronic obstructive pulmonary disease.
留言 (0)