
記住我
Hypertension is a common chronic, noncommunicable disease that not only damages the health of vital organs such as the heart, brain, and kidneys but also affects the health of the eyes. Hypertensive retinopathy (HR) is defined as structural and functional damage of the retinal microcirculatory system due to hypertension, including retinal arteriosclerosis (RA), vascular compression indentation (VCI), retinal hemorrhage (RH), retinal exudation (RE), edema, and neovascularization.1 Hypertensive retinopathy is one of the most common ocular complications of hypertension, and the prevalence increases as the degree and duration increase.2 Hypertensive retinopathy not only affects vision but is also closely related to the occurrence and prognosis of cardiovascular diseases. Studies have shown that HR is an independent risk factor of cardiovascular and cerebrovascular events, such as myocardial infarction, stroke, heart failure, and renal failure, and the severity of HR is positively correlated with the risk of cardiovascular and cerebrovascular events.3 Therefore, timely detection and diagnosis of HR is important for the management of hypertensive patients.
Fundus examination is the main method for diagnosing HR. Traditional methods of fundus examination include direct ophthalmoscopy, indirect ophthalmoscopy, and fundus photography (FP). These methods can observe clinical changes in the retina, such as retinal vessel thinning, VCI, RH, and exudation. However, the traditional FP has a limited range of light wavelengths (480–600 nm) and cannot display structures below the retinal layer. Therefore, it cannot observe changes in the choroidal structure. It also cannot observe the functional information of the retina, such as blood flow perfusion and blood oxygen saturation. On the other hand, fundus fluorescein angiography (FFA), as the “gold standard” for examining retinal vascular diseases, can visually and dynamically observe retinal vascular perfusion.4 However, its disadvantage is the need for intravenous injection of contrast agents, which may have adverse effects on patients.5 Retrospective studies have shown an incidence of 0.083% of anaphylactic shock caused by fluorescein,6 and this adverse reaction should not be ignored. In addition, similar to FP, FFA can only observe changes in the retina and cannot display changes in the choroid of patients with HR. Multispectral fundus imaging (MSI) is a new purely optical ophthalmic examination technique that can obtain information about the retina and choroid at different depths and tissue compositions by taking advantage of the different absorption abilities of ocular tissues to different wavelength spectra. It can directly reflect changes in retinal and choroidal vascular layers and analyze their blood oxygen saturation, blood flow perfusion, and other information.7,8 Compared with FFA and FP, MSI has the advantages of being noninvasive, fast imaging speed, capable of imaging the choroid, and does not require pupil dilation. Therefore, it is more suitable for early screening of HR. Owing to its unique imaging method, MSI has become a new method for diagnosing retinal and choroidal diseases. It has been applied in some ophthalmic diseases, such as diabetic retinopathy9 and macular degeneration.10 Research shows that the reduction of oxygen content in retinal tissue plays a role in the development of many retinal diseases, such as diabetic retinopathy,11 arteriovenous occlusion,12 age-related macular degeneration,13 and glaucoma.14 Some studies have shown that multispectral fundus imaging technology can be used as a noninvasive means to analyze the oxygen saturation in human retinal and choroidal vessels.15,16 The aim of this study was to observe the consistency, sensitivity, and specificity of MSI, traditional FP, and FFA in the diagnosis of HR and explores the application value of MSI in HR diagnosis. In addition, this study also uses 780-nm spectral MSI to measure the choroidal vascular index (CVI), which reveals the content of oxyhemoglobin in the choroidal vessels to some extent. So far, there has been no report on the application of multispectral layered imaging systems in the diagnosis and grading of HR and its vascular changes at home and abroad.
Materials and Methods Subjects of the StudyThis study was approved by the Ethics Committee of the First People's Hospital of Zigong City and follows the ethical principles stipulated in the China Food and Drug Administration (CFDA) “Good Clinical Practice for Drugs Clinical Trials,” “Good Clinical Practice for Medical Device Clinical Trials,” World Medical Association (WMA) “Declaration of Helsinki,” and Council for International Organizations of Medical Sciences (CIOMS) “International Ethical Guidelines for Biomedical Research Involving Human Subjects,” and all subjects were informed of the relevant information and signed informed consent forms. All subjects underwent examination at Zigong First People's Hospital from January 2019 to November 2021. Overall, 100 patients with HR and 40 healthy people were included in this study. The inclusion criteria were: 1) primary hypertension patients over 18 years old with clinical manifestations, such as decreased vision or visual field defects; 2) fundus examination revealed signs of retinal vascular thinning, increased reflection, crossing pressure marks, and so on; 3) clinically diagnosed as HR or diagnosed as HR by FFA. The exclusion criteria were: 1) patients with severe media opacity that affects fundus examination, such as advanced cataracts, keratitis, corneal opacities, and vitreous hemorrhage; 2) patients with other common retinal diseases, such as diabetic retinopathy and macular degeneration; 3) patients with severe eye diseases that affect visual acuity, such as glaucoma and uveitis. Eligible patients underwent fundus color photography (Topcon), MSI examination (MSIC2000, Shenzhen, China), and fundus fluorescein angiography (FFA) examination for patients diagnosed as Grade 3 or 4 HR according to the Keith–Wagener–Barker grading criteria. Combined retinal vein occlusion in some patients with Grade 3 and 4 HR. Routine eye examinations included uncorrected visual acuity, best corrected visual acuity, intraocular pressure, fundus examination, and slit-lamp examination.
Grading Criteria of Hypertensive RetinopathyAccording to the Keith–Wagener–Barker standard, HR is divided into four levels. Level I: mainly vascular constriction and narrowing. The retinal arterioles are slightly thinned, the arteriole diameter is uniform, the arterial reflection band is widened, and there is venous concealment. Level II: mainly arteriosclerosis. The retinal artery sclerosis is aggravated, the arterioles are generally or locally narrowed, the local diameter is irregular, and they are like copper or silver wire. The manifestations at the arteriovenous crossing are: concealment and displacement (Salus sign), distal expansion (venous slope) or compression into a spindle shape (Gunn sign), and they may show right-angle deviation. Level III: diffuse small arterioles are obviously narrowed and irregular in diameter, combined with RH, hard exudation, cotton wool-like spots, and extensive microvascular changes. Level IV: on the basis of level III changes, accompanied by optic disk edema and retinal edema.
Multispectral Fundus ImagingThe MSI model used in this project is MSIC2000, which is produced by Shenzhen Shengda Tongze Technology Company. It can simultaneously obtain fundus images with a wavelength range of 550 nm to 850 nm (550, 600, 620, 680, 780, 810, and 850 nm) and display them in layers. MSI has the following technical parameters: field of view angle, 63°; resolution, ≥60 lp/mm at the center of the field of view; image pixels, 4,096 × 4,096. The MSI imaging process is as follows: instruct the examinee to keep the head fixed and continuously fixate on the green cross mark in the lens; the machine uses automatic focusing technology, continuously collects fundus images under different spectra, repeats collection, and filters out images with motion artifacts, unclear images, and poor lighting, until clear images are collected.
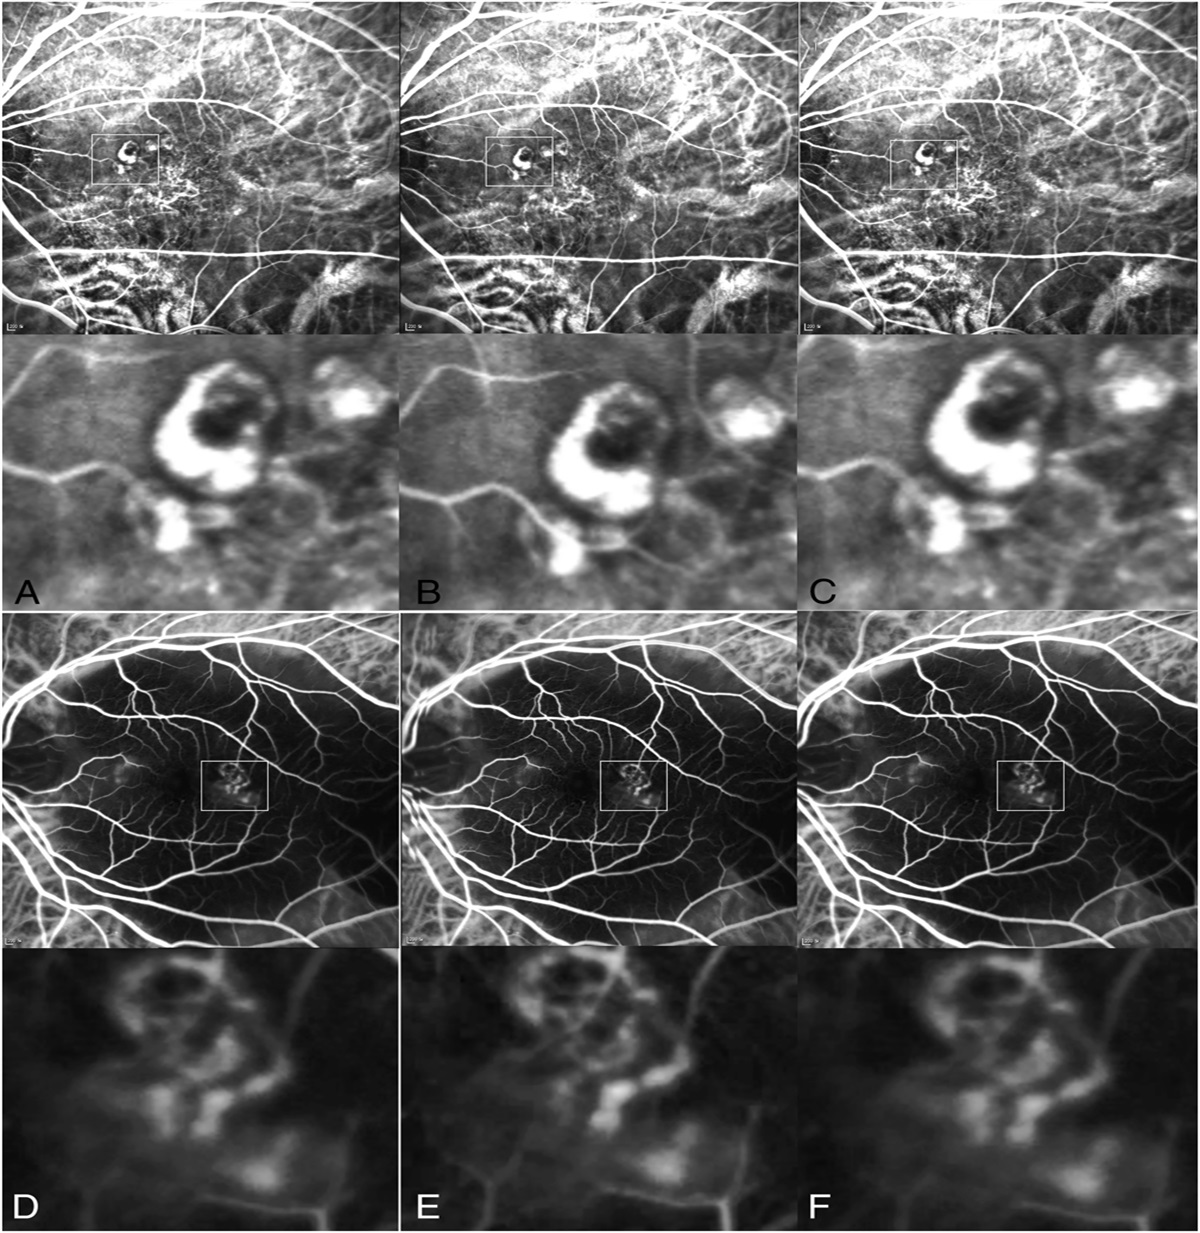
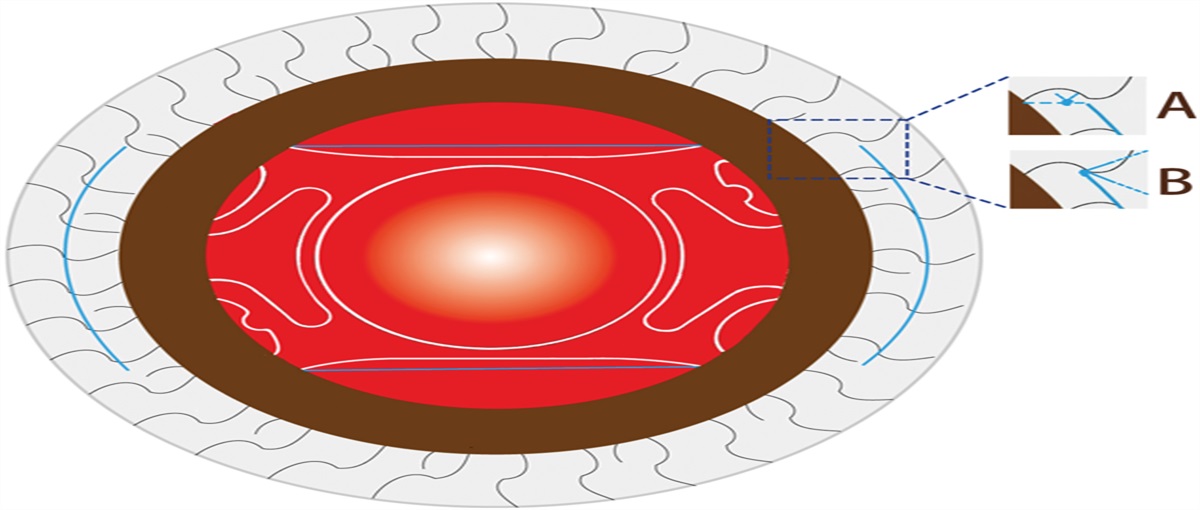
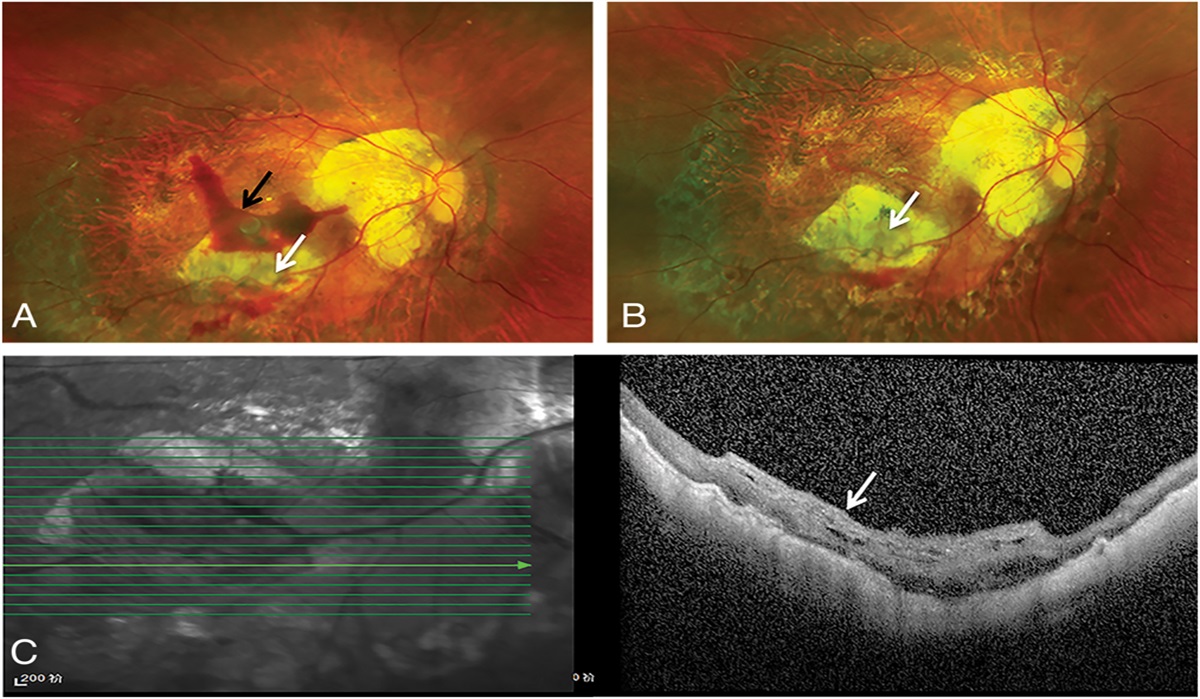
Measurement of Choroidal Vascular IndexMultispectral CVI analysis: As oxyhemoglobin in the choroid has a significant advantage at a wavelength of 780 nm, MSI 780 nm was selected for image analysis. Because of the influence of retinal vessels near the optic disk on choroidal vascular imaging, a square range (500 × 500 pixels) beside the first branch of retinal vessels below the optic disk was selected as the measurement range (Figure 1A), where the measurement area was locally enlarged (Figure 1B). The images were processed using Image J's bioimage analysis mode, and Threshold software was used to binarize the images. After processing, the choroidal vessels were black and the choroidal interstitium was white (Figure 1C). The software was used to measure the different areas selected, and the CVI was the proportion of the vessels in the entire measurement range, that is, vascular pixels/total area pixels ×100%.
 Fig. 1.:
 Choroidal vascular index measurement protocol based on MSI. The red arrow indicates the location of the primary branch of the retinal blood vessels. The white box represents the selected rectangular area (500 × 500 pixels) as the measurement range.
Image Reading and Diagnostic Characteristics of Multispectral Fundus ImagingLight of different wavelengths has different penetrability and tissue absorption in ocular tissues. Therefore, short-wavelength spectra (550, 600, and 620 nm) are used to evaluate retinal abnormalities, mid-wavelength spectra (680 and 780 nm) are used to assess changes in the retinal pigment epithelium (RPE)-Bruch's membrane–choriocapillaris complex, and infrared wavelengths (810 and 850 nm) have stronger penetration and are used to evaluate choroidal changes. We analyzed the manifestations of various pathological changes in HR using MSI. Compared with FP, VCI and increased arteriovenous ratio were more easily identified in MSI at 550 nm, while RA was more easily observed in MSI at 620 nm (Figure 2, first row). Compared with FP, MSI was better able to observe the range and location of HR RH and exudation within the structural layers (Figure 2, second and third rows).
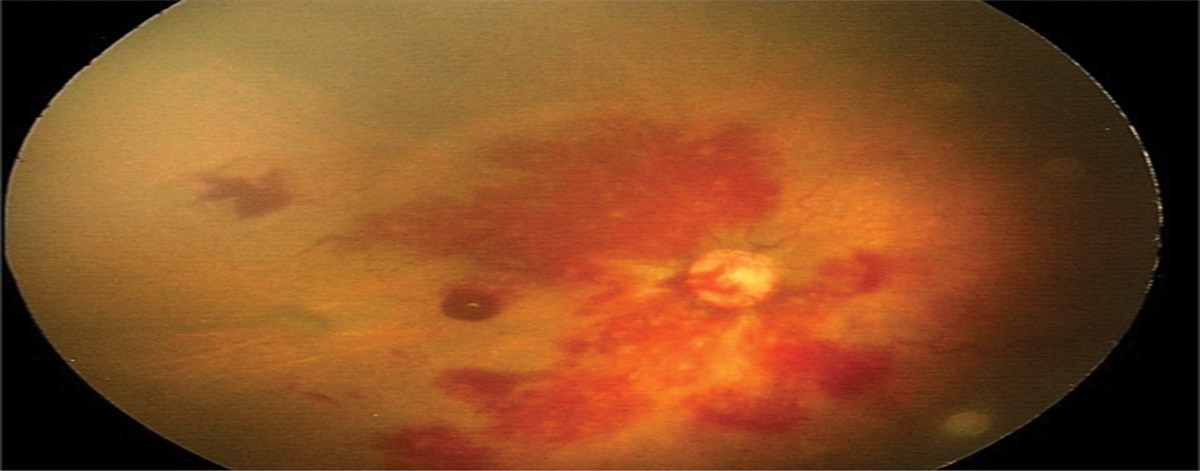
 Fig. 2.:
 Definition features of HR in FP and MSI. The first row (from left to right): VCI (FP, MSI 550 nm), increased arteriovenous ratio (FP, MSI 550 nm), RA (FP, MSI 620 nm). The red arrows indicate arteries, and the blue arrows indicate veins. The second row: cotton wool spot (FP, MSI 550, 600, 620, 680, 780 nm). The yellow arrows indicate cotton wool spots. The third row: RH and hard exudates (FP, MSI 550, 600, 620, 680, 780 nm). The white arrows indicate hemorrhage.
Statistical AnalysisThis project used SPSS 24.0 software for statistical analysis and used Kappa analysis to compare the consistency of MSI and FP in HR grading diagnosis; used one-way analysis of variance, least significant difference (LSD) t-test, to analyze the difference of CVI between patients with HR and controls; used FFA as the diagnostic criterion and compared the sensitivity, specificity, positive predictive value, and negative predictive value of MSI in severe HR diagnosis. P < 0.05 was taken as the significance level.
Results Consistency of MSI and Fundus Photography in Hypertensive Retinopathy Grading DiagnosisMSI and FP have high consistency in the grading diagnosis of HR (Kappa value: 0.883, t = 0.000; see Table 1).
Table 1. - Cross Table of MSI and FP in the Grading of HR MSI Fundus Total 1 2 3 4 1 29 1 0 0 30 2 4 36 0 0 40 3 0 0 24 1 25 4 0 0 2 3 5 Total 33 37 26 4 100The consistency between multispectral fundus image (MSI) and FP in the grading diagnosis of HR was excellent. Kappa value = 0.883, t = 0.000.
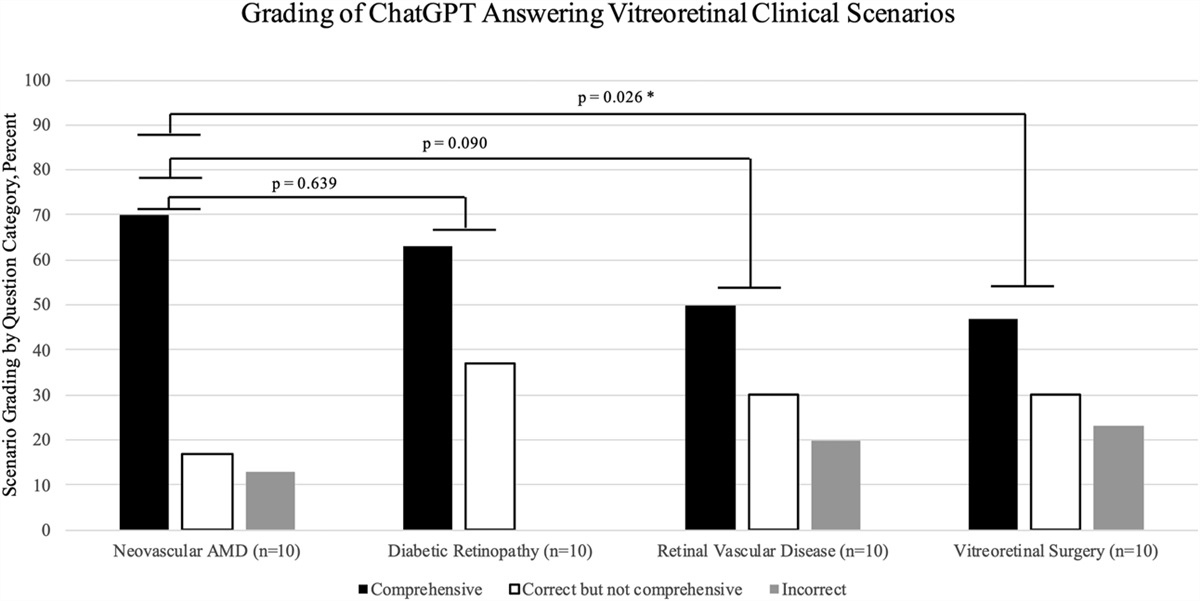
In a total of 28 eyes of 28 patients with HR, 25 eyes showed RH, 19 eyes showed RE, 28 eyes showed RA, 27 eyes showed arteriovenous crossing pressure marks (VCI), and 6 eyes showed vascular white line (VWL) sign on FFA. In MSI, short wavelength (550–620 nm) had the highest detection sensitivity for RH (100%) and RE (100%). MSI wavelength of 620 nm had the highest detection sensitivity for RA (96.43%), VCI (96.29%), and VWL (83.33%). In Table 2, details of the detection rate of each wavelength in finding RH, RE, RA, VCI, and VWL are presented. The performance of each spectrum is shown in Figure 3.
Table 2. - Diagnostic Sensitivity of Different Spectral (nm) MSI Images for Different Lesions (RH, RE, RA, VCI, VWL) in Patients With HR 550 nm (n, %) 600 nm (n, %) 620 nm (n, %) 680 nm (n, %) 780 nm (n, %) 810 nm (n, %) 850 nm (n, %) RH 25 eyes, 100 25 eyes, 100 25 eyes, 100 21 eyes, 84 10 eyes, 40 10 eyes, 40 4 eyes, 16 RE 19 eyes, 100 19 eyes, 100 18 eyes, 94.73 18 eyes, 94.73 17 eyes, 89.47 15 eyes, 78.94 13 eyes, 68.42 RA 22 eyes, 78.57 27 eyes, 96.43 27 eyes, 96.43 25 eyes, 89.29 23 eyes, 82.14 13 eyes, 46.43 9 eyes, 32.14 VCI 24 eyes, 88.88 26 eyes, 96.29 26 eyes, 96.29 25 eyes, 92.59 22 eyes, 81.48 19 eyes, 70.37 13 eyes, 48.14 VWL 4 eyes, 66.66 5 eyes, 83.33 5 eyes, 83.33 4 eyes, 66.66 2 eyes, 33.33 0 0Sensitivity of RH, RE, RA, VCI, and VWL in HR was compared using FFA as diagnostic criteria.
 Fig. 3.:
 Detection sensitivity of RH, RE, RA, VCI, and VWL by different spectral images. Short wavelengths (550, 600, and 620 nm) showed more sensitivity for HR lesion detection.
Sensitivity, Specificity, Positive Predictive Value, and Negative Predictive Value of MSI in the Diagnosis of Retinal Hemorrhage, Retinal Exudation, Retinal Arteriosclerosis, Vascular Compression Indentation, and Vascular White Line in Patients With Hypertensive RetinopathyUsing FFA as the diagnostic criterion, MSI had a sensitivity, specificity, positive predictive value, and positive predictive value of 96.00%, 66.66%, 96.00%, and 66.66%, respectively, in detecting RH; a sensitivity and specificity of 89.47% and 77.77%, respectively, in detecting RE; a sensitivity and specificity of 100% and 96.29%, respectively, in detecting RA; a sensitivity and specificity of 96.15% and 50%, respectively, in detecting VCI; and a sensitivity and specificity of 80% and 100%, respectively, in detecting VWL (Table 3).
Table 3. - Sensitivity, Specificity, Positive Prediction Value, and Negative Prediction Value of MSI in the Diagnosis of RH, RE, RA, VCI, and VWL in Patients With HR Lesion Sensitivity (%) Specificity (%) Positive Prediction (%) Negative Prediction (%) RH 96.00 66.66 96.00 66.66 RE 89.47 77.77 89.47 77.77 RA 100.00 96.29 100.00 50.00 VCI 96.15 50.00 96.15 50.00 VWL 80.00 100.00 95.45 100.00The detection sensitivity, specificity, positive prediction value, and negative prediction value of MSI were compared with FFA. Short wavelengths (550, 600, and 620 nm) were used to calculate the detection sensitivity and specificity for different lesions of HR.
Twenty-eight patients clinically diagnosed as stage 3 or 4 HR were selected as the experimental group, and 40 normal people with good general and ocular health status were selected as the control group. The 780-nm wavelength in multispectral layered imaging was selected as the CVI measurement. Choroidal vascular index measurement was completed in 84.38% (81/96) of the eyes, while the remaining cases were neglected due to poor image quality and unclear refractive media. There was no statistical difference in sex, age, and eye axis between the two groups of patients in the HR group and the control group (Table 4). Based on MSI measurements at 780 nm, the CVI of the control group was (53.39 ± 1.10)%, whereas those of the HR and fellow eye groups were (57.97 ± 0.76)% and (53.39 ± 1.10)%, respectively. Compared with the control group, the difference in the HR eye group was statistically significant (P = 0.003); compared with the control group, the difference in the fellow eye group was statistically significant (P = 0.003); compared with the fellow eye group, there was no statistical difference in the HR eye group (P = 1.000) (Table 5).
Table 4. - General Information of Involved Patients in Our Study, Including the Control Group and HR Group Control Group (n = 37) HR Group (n = 23) P Sex (M/F) 19/18 11/12 0.792 Age (years) 56.59 ± 7.76 57.96 ± 11.07 0.577 Eye axis (mm) 24.06 ± 0.20 24.14 ± 0.77 0.526P
Control eyes 37 57.97 ± 0.76a 8.56 <0.001 HR eyes 21 53.39 ± 1.10b Fellow eyes 23 53.61 ± 0.90c a, b, c indicates different groups. a versus b:P
= 0.003, a versus c:P
= 0.003, b versus c:P
= 1.000.MSI imaging utilizes multiple monochromatic light-emitting diode (LED) light sources to project into different depths of the ocular tissues. By exploiting the variations in spectral absorption by different tissues, the reflected monochromatic light from different depths of the fundus is collected and imaged, resulting in monochromatic spectral images that allow for the observation of changes in different layers of the ocular tissues. Traditional FP imaging, on the other hand, uses white light as the source to capture the reflected light from the retinal tissue and generate an image, lacking the capability of layered imaging. This study compared the consistency of MSI and FP in HR diagnosis and found that they had a high consistency in HR diagnosis, with a Kappa value of 0.83. Many studies have shown that MSI and routine fundus examination have a high consistency in the diagnosis of various fundus diseases. Li et al9 showed that compared with FP, MSI had a consistency of 0.614 in the diagnosis of diabetic retinopathy (DR). Xu et al showed that in retinal vein occlusion, MSI had a better diagnostic performance than FP (area under the curve [AUC] = 0.911 vs. 0.768, P = 0.0318).17 In our study, when the MSI wavelength is between 550 nm and 600 nm, it enhances the specular reflection of the anterior and middle parts of the retina, improving the visibility of retinal vessels. In addition, short wavelengths do not have the ability to penetrate the choroid, making short-wavelength MSI more suitable for observing changes in retinal vessels compared with FP imaging, which may be affected by choroidal vessels and pigment imaging interference. These changes include increased arteriovenous ratio and VCI (Figure 1). As the wavelength increases, the reflection of retinal arteries gradually strengthens. When the wavelength is 620 nm, the reflection of retinal arteries is the strongest. Compared with FP, MSI at 620 nm is more suitable for observing the presence of retinal artery sclerosis (Figure 1). Therefore, compared with FP, MSI imaging has advantages in the early diagnosis of HR. For severe HR changes such as RH, retinal exudates, and cotton wool spots, MSI spectral imaging at different wavelengths can be used to observe the affected layers. For example, in traditional FP imaging, the location of hemorrhage can only be inferred based on its morphology (e.g., radial hemorrhage in the nerve fiber layer, dot hemorrhage in the deep layer of the retina). In MSI, in addition to observing the morphology of hemorrhage, we can also locate the lesion in different structural layers by observing images at different wavelengths (Figure 1). Furthermore, MSI also has a more powerful choroidal imaging function, which facilitates the observation of choroidal vascular changes in patients with HR. However, there is currently a lack of corresponding diagnostic criteria for choroidal vascular changes, and it is believed that these criteria will be established in future clinical practice and research. In summary, in this study, we think that MSI is superior to FP in the diagnosis of HR.
In addition, this study also used FFA as a diagnostic criterion to analyze the diagnostic sensitivity, specificity, positive predictive value, and negative predictive value of MSI in various retinal changes in HR. Our study found that short-wave MSI had higher sensitivity and positive predictive value for HR lesions. These changes include retinal vascular thinning, increased reflection, arteriovenous crossing pressure, RH, and RE. Previous studies have shown that in retinal vein occlusion, the sensitivity of MSI to RH is 80.0%, the sensitivity to cotton wool spots is 90.0%, and the sensitivity to hard exudates is 90.9%,17 which is similar to our research results. This indicates that short-wave MSI images can clearly display retinal vascular abnormalities. However, the specificity and negative predictive value of this study are lower than previous research results.17 The reason for this may be that we selected patients with severe HR, and most positive signs observed were present in varying degrees in each patient, while negative signs were less common. Therefore, the specificity and negative predictive value calculated in this study are not representative, and further expansion of the sample size and inclusion of patients with more complete disease courses are needed.
Choroidal vessels are composed of a capillary layer, Sattler's medium vessel layer, and Haller's large vessel layer. The average diameters of arteries and veins in the choroidal large and medium vessel layers are 28.2 µm and 37.1 µm, respectively.18 Therefore, both choroidal large vessels and retinal arteries belong to small arteries in terms of tissue. As a systemic disease, hypertension often affects the small vessels of various target organs in the body first. At present, the retinal vascular damage caused by HR is relatively clear, but there are relatively few reports on the damage of choroidal vessels in hypertensive patients. This study analyzed the difference in CVI between HR patients and normal people by MSI and found that the CVI of patients with HR was lower than that of the normal control group. The cross-sectional study by Waghamare et al19 demonstrated that choroidal thickness was significantly lower in the hypertensive group compared with the control group. The choroidal thickness of the hypertensive group was significantly negatively correlated with systolic blood pressure and duration of hypertension. The study group included 68 eyes of 34 adult individuals diagnosed with essential hypertension. Wei et al20 showed that after correcting for age, sex, eye axis, lens thickness, anterior chamber depth, and other factors, subfoveal choroidal thickness (SFCT) was not significantly correlated with hypertension, but HR was correlated with choroidal thickness. However, SFCT only provides an estimate of the overall choroidal volume and does not reflect the choroidal vascular structure. In recent literature, CVI has been proposed as a measure of vascular volume. The choroidal vascular index is defined as the ratio of the choroidal vascular area to the total choroidal area.21,22 Therefore, we measured CVI in this study and found that the CVI of patients with HR was significantly lower than that of normal people. Hwang et al23 studied the CVI of patients with branch retinal vein occlusion and found that it was lower than that of contralateral healthy eyes and eyes after anti-vascular endothelial growth factor (VEGF) treatment. Foo et al showed that the macular Haller layer CVI of diabetic eyes without DR was significantly lower than that of the healthy control group. With the prolongation of the diabetes course, regardless of diabetes control status, the CVI of the subretinal Sattler layer continued to decline.24 These studies are similar to our finding, the possible reason is that patients with HR have long-term hypertension leading to narrowing of choroidal vessel diameter. In addition to structural imaging, MSI is also a functional imaging technique. When MSI wavelength is 780 nm, it has an obvious imaging advantage for oxygenated hemoglobin in choroidal vessels. As early as 1959, Hickam and Frayser12 used dual-wavelength imaging to calculate retinal oxygen saturation. Later, Kristjansdottir et al16 used noninvasive spectrophotometric oximeter to measure hemoglobin oxygen saturation in human choroidal vessels. Our study used 780-nm spectral MSI to measure CVI, which revealed the content of oxygenated hemoglobin in choroidal vessels to some extent. It suggests that the decrease of CVI measured by MSI in patients with HR may be related to the decrease of oxygenated hemoglobin content in choroidal vessels.
In conclusion, as a new noninvasive optical imaging technique, MSI has high concordance with FP in the diagnosis of HR. Taking FFA as the diagnostic standard, MSI has high sensitivity in the diagnosis of various fundus manifestations of HR. In addition, because of its special optical imaging technology, it has obvious diagnostic advantages over the traditional FP and FFA in the choroidal manifestations of patients with HR. This suggests that MSI could be a new modality for the diagnosis and evaluation of HR. The limitation of this study is that the number of patients evaluated is relatively small. Larger-scale prospective and continuous case studies in the future may demonstrate better diagnostic capabilities than this study. In addition, the current calculation of CVI on MSI images still relies on manual methods, resulting in a two-dimensional area ratio for CVI values. Future research directions for MSI images to measure CVI may involve more automated methods to obtain volume ratios, which would better reflect actual changes in the choroid. Currently, there is no clear diagnostic criterion for choroidal changes in HR. Larger-scale prospective case studies in the future are still needed to provide evidence for establishing diagnostic criteria.
References 1. Di Marco E, Aiello F, Lombardo M, et al. A literature review of hypertensive retinopathy: systemic correlations and new technologies. Eur Rev Med Pharmacol Sci 2022;26:6424–6443. 2. Modi P, Arsiwalla T. Hypertensive Retinopathy. Treasure Island. Statpearls Publishing; 2022. 3. Liew G, Xie J, Nguyen H, et al. Hypertensive retinopathy and cardiovascular disease risk: 6 population-based cohorts meta-analysis. Int J Cardiol Cardiovasc Risk Prev 2023;17:200180. 4. Hvarfner C, Andreasson S, Larsson J. Multifocal electroretinography and fluorescein angiography in retinal vein occlusion. Retina 2006;26:292–296. 5. Rahimy E, Sarraf D, Dollin ML, et al. Paracentral acute middle maculopathy in nonischemic central retinal vein occlusion. Am J Ophthalmol 2014;158:372–380.e1. 6. Ha SO, Kim DY, Sohn CH, Lim KS. Anaphylaxis caused by intravenous fluorescein: clinical characteristics and review of literature. Intern Emerg Med 2014;9:325–330. 7. De carvalho ER, Hoveling RJ, Van noorden CJ, et al. Functional imaging of the ocular fundus using an 8-band retinal multispectral imaging system. Instruments 2020;4:12. 8. Ma F, Yuan M, Kozak I. Multispectral imaging: review of current applications. Surv Ophthalmol 2023;68:889–904. 9. Li L, Zhang P, Liu H, et al. Evaluation of multispectral imaging in diagnosing diabetic retinopathy. Retina 2019;39:1701–1709. 10. Nam J, Ly A, Kalloniatis M, Nivison-Smith L. Multispectral pattern recognition measures change in drusen area in age-related macular degeneration with high congruency to expert graders. Scientific Rep 2022;12:7442. 11. Berkowitz BA, Luan H, Gupta RR, et al. Regulation of the early subnormal retinal oxygenation response in experimental diabetes by inducible nitric oxide synthase. Diabetes 2004;53:173–178. 12. Hickam JB, Frayser R. Studies of the retinal circulation in man: observations on vessel diameter, arteriovenous oxygen difference, and mean circulation time. Circulation 1966;33:302–316. 13. Zarbin M. Age-related macular degeneration: review of pathogenesis. Eur J Ophthalmol 1998;8:199–206. 14. Mozaffarieh M, Grieshaber MC, Flammer J. Oxygen and blood flow: players in the pathogenesis of glaucoma. Mol Vis 2008;14:224–233. 15. Khoobehi B, Wafapoor H, Eaton A, et al. Noninvasive measurement of oxygen saturation in human retinal blood vessels and tissues with multispectral confocal imaging. Ophthalmic Surg Lasers Imaging Retina 2022;53:275–283. 16. Kristjansdottir JV, Hardarson SH, Harvey AR, et al. Choroidal oximetry with a noninvasive spectrophotometric oximeter. Invest Ophthalmol Vis Sci 2013;54:3234–3239. 17. Xu Y, Liu X, Cheng L, et al. A light‐emitting diode (LED)‐based multispectral imaging system in evaluating retinal vein occlusion. Lasers Surg Med 2015;47:549–558. 18. Spraul CW, Lang GE, Lang GK, Grossniklaus HE. Morphometric changes of the choriocapillaris and the choroidal vasculature in eyes with advanced glaucomatous changes. Vis Res 2002;42:923–932. 19. Waghamare SR, Mittal S, Pathania M, et al. Comparison of choroidal thickness in systemic hypertensive subjects with healthy individuals by spectral domain optical coherence tomography. Indian J Ophthalmol 2021;69:1183–1188. 20. Shao L, Zhou LX, Xu L, Wei WB. The relationship between subfoveal choroidal thickness and hypertensive retinopathy. Sci Rep 2021;11:5460. 21. Sonoda S, Sakamoto T, Yamashita T, et al. Luminal and stromal areas of choroid determined by binarization method of optical coherence tomographic images. Am J Ophthalmol 2015;159:1123–1131.e1. 22. Agrawal R, Ding J, Sen P, et al. Exploring choroidal angioarchitecture in health and disease using choroidal vascularity index. Prog Retin Eye Res 2020;77:100829. 23. Hwang B, Kim M, Park Y. Role of the choroidal vascularity index in branch retinal vein occlusion (BRVO) with macular edema. PLoS One 2021;16:e0258728. 24. Foo VHX, Gupta P, Nguyen QD, et al. Decrease in choroidal vascularity index of Haller's layer in diabetic eyes precedes retinopathy. BMJ Open Diabetes Res Care 2020;8:e001295.
留言 (0)