
記住我


Idiopathic inflammatory myopathies (IIMs) represent a rare and heterogeneous group of immune-related conditions that impact skeletal muscles and various organ systems, including the skin, lungs, and joints.1 The annual incidence ranges from 1 to 10 cases per million.2 Idiopathic inflammatory myopathy is classified into subtypes such as dermatomyositis, polymyositis, inclusion body myositis, and immune-mediated necrotizing myositis based on clinical and histopathological features, along with the presence of myositis-specific autoantibodies.3 The precise etiology of IIMs remains complex and not fully elucidated, with current hypotheses considering genetic predisposition,4,5 autoimmune mechanisms,6 and environmental factors,7 resulting in the onset of IIMs. Treatment options for IIMs include high-dose corticosteroids along with various immunosuppressive and immunomodulatory agents.8
The recognition of the association between IIMs and cancer dates back to 1916, with the report of 2 cases of dermatomyositis with gastric cancer.4 Subsequent population-based studies have consistently confirmed an elevated risk of malignancy in IIM patients, characterized by standardized incidence ratios (SIRs) ranging from approximately 3.0 to 6.0.9–11 Malignancies may precede, coincide with, or follow the diagnosis of IIMs, with the highest cancer incidence occurring in the year preceding or following the diagnosis of IIMs.12,13 The types of cancer associated with IIMs seem to mirror the incidence of cancer in the general population.14 Frequently observed malignancies in IIMs encompass lung, ovarian, breast, colorectal, cervical, bladder, nasopharyngeal, esophageal, pancreatic, and kidney cancers.10,13,15 Varying risks of myositis-associated malignancies may be observed among different populations and IIM subtypes, with a notable concern for lung cancer (LC), as studies consistently ranked LC risk among the highest in investigations examining the co-occurrence of IIMs and tumors.10,12,13 Investigating the relationship between IIMs and LC may yield insights into the early diagnosis of both diseases. Nevertheless, the nature and directionality of the association between IIMs and LC remain unresolved.
Mendelian randomization (MR) is a strategy that utilizes genetic variants as instrumental variables (IVs) for exposure to assess causal relationships with outcomes, overcoming the inherent limitations of unobserved confounding and reverse causality seen in observational studies.16 In this study, 2-sample MR analyses were conducted using publicly available genome-wide association studies (GWASs) data to examine the bidirectional causal effects and the strength of the association between IIMs and LC, including its subtypes such as lung adenocarcinoma (LUAD), lung squamous cell carcinoma (LUSC), and small cell lung cancer (SCLC).
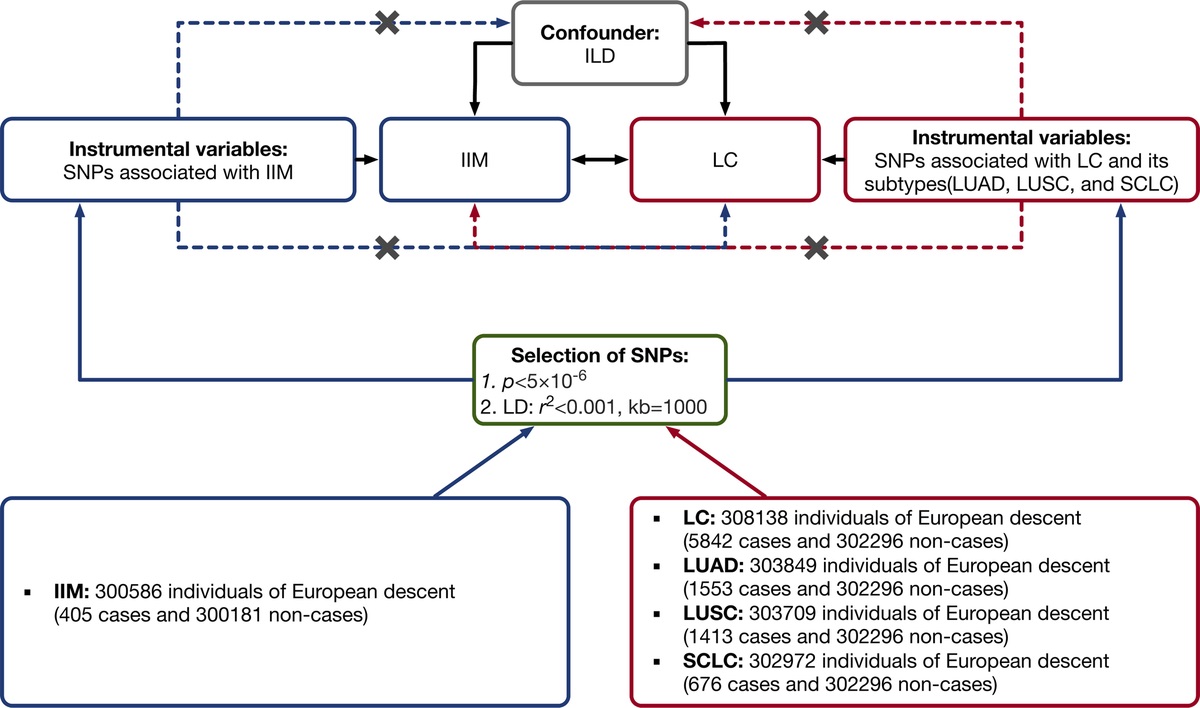
METHODS Study DesignFigure 1 provides a concise overview of the bidirectional MR design used in this study. Mendelian randomization analysis relies on 3 fundamental assumptions: (1) the IVs are directly associated with the exposure; (2) the IVs are unrelated to any potential confounders of the exposure-outcome relationship; and (3) genetic variants exclusively influence the outcome through the exposure.16
 FIGURE 1:
 Study design of the present bidirectional MR study on the associations between IIMs and LC, including LC subtypes. Black lines show the relationship across IVs, exposures, and outcomes in the MR study examining the bidirectional effects of IIMs and LC. Dashed lines represent associations that would violate the MR assumptions (i.e., relationships not allowed in the present MR study). ILD, interstitial lung disease; LD, linkage disequilibrium.
In this study, MR analysis was used to evaluate the bidirectional causal connections between IIMs and LC, encompassing LC subtypes.
Data SourcesAll datasets used in this MR analysis were obtained from the FinnGen database (http://www.finngen.fi/en/) (v1.15.0, accessed on September 2, 2023),17 and they had approval from the ethics committee. FinnGen, a pioneering public-private partnership, collects and analyzes genomic and health data from 500,000 participants in the Finnish biobank, offering valuable insights for personalized medicine. This collaboration involves diverse stakeholders, making the database a world-class resource for comprehensive studies and research initiatives. To mitigate bias introduced by ethnically related confounding factors, we restricted the study population's genetic background to individuals of European origin. Summary-level GWAS data for LC as a whole (finn-b-C3_BRONCHUS_LUNG_EXALLC) included 5842 cases and 302,296 controls. The LUAD data (finn-b-C3_NSCLC_ADENO_EXALLC) included 1553 cases and 302,296 controls. The LUSC data (finn-b-C3_NSCLC_SQUAM_EXALLC) included 1413 cases and 302,296 controls. The SCLC data (finn-b-C3_SCLC_EXALLC) included 676 cases and 302,296 controls. The IIM data (finn-b-DERMATOPOLY_FG) included 405 cases and 300,181 controls.
Instrument SelectionWe used a genome-wide significance threshold of p < 5 × 10⁻⁶. To avoid linkage disequilibrium, a clumping algorithm with criteria of r2 = 0.001 and kb = 1000 were implemented. Palindromic single-nucleotide polymorphisms (SNPs) were excluded during the harmonization phase. If necessary, proxy SNPs with an r2 greater than 0.8 were searched in the outcome datasets. Single-nucleotide polymorphisms associated with outcomes at a threshold of p < 5 × 10⁻⁶ were also excluded. No SNPs were excluded based on an F statistic less than 10. Subsequently, PhenoScanner (www.phenoscanner.medschl.cam.ac.uk) (accessed on September 2, 2023), a comprehensive database of genotype and phenotype relationships in humans, was consulted to assess if the SNPs were linked to potential confounders.18 We considered interstitial lung disease as a confounder associated with both IIMs and LC19,20; however, no SNP was excluded.
In the MR analysis with IIMs as the exposure, 6, 7, 6, and 7 SNPs were selected for LC as a whole, LUAD, LUSC, and SCLC, respectively. In the reverse MR analysis with LC and its subtypes as exposures, 26, 5, 8, and 3 SNPs associated with LC as a whole, LUAD, LUSC, and SCLC were selected, respectively. Detailed information on IVs is available in Supplementary Tables 1–8 (https://links.lww.com/RHU/A659).
Statistical AnalysesTo identify horizontal pleiotropic outliers, we initially used the MR pleiotropy residual sum and outlier (MR-PRESSO) test. If MR-PRESSO identified any outlier SNPs, these outliers were removed, and the remaining IVs underwent further statistical assessment.
To establish causal associations, MR analyses were conducted, including inverse variance weighted (IVW), MR-Egger, and weighted median methods. The IVW method, offering robust statistical power, uses a meta-analysis approach to combine Wald ratios of causal effects for each SNP. Mendelian randomization–Egger regression generates a weighted linear regression of outcome variables against exposure variables. The weighted median estimate provides a reliable effect estimate of causal influence when at least 50% of the weight in the analysis originates from valid IVs. Causal effect estimates were reported as odds ratios (ORs) with 95% confidence intervals (CIs). Significance of MR analysis results was considered when the Bonferroni-corrected p value was <0.00625 (0.05/8).
To address potential violations of MR assumptions, multiple sensitivity analyses were conducted to assess whether pleiotropy and heterogeneity within genetic instruments could bias the MR results.21 Mendelian randomization–Egger regression was used to evaluate the potential presence of directional pleiotropy when the magnitude of the intercept deviates from zero. Cochran Q statistic was used to assess between-SNPs heterogeneity in IVW estimates. Funnel and scatterplots of MR analyses were used for visual assessment of horizontal pleiotropy and heterogeneity. Finally, leave-one-out analysis was used to examine the potential influence of each SNP on MR estimates by sequentially removing each SNP.
All analyses were 2-sided and conducted using the TwoSampleMR package (version 0.5.7; https://mrcieu.github.io/TwoSampleMR/) in R software (version 4.2.0; www.r-project.org/).
Power AnalysisPower calculations were based on an online tool utilizing several parameters to determine the probability of correctly detecting the causal effects (https://shiny.cnsgenomics.com/mRnd/).22 The parameters for power calculation in binary outcomes encompass sample size, α (type I error rate), K (proportion of cases in the study), OR, and R2 (proportion of variance explained for the association between the IVs and the exposure variable).
RESULTS Associations of Genetic Liability to LC With the Risk of IIMsOur findings suggest a causal relationship between IIMs and an increased risk of LC within the European population. Following the removal of a potentially distorted outlier (rs6679677 in LC and LUSC) through MR-PRESSO analysis, we used the IVW method to demonstrate that IIM was associated with the overall risk of LC (OR, 1.114; 95% CI, 1.057–1.173; p = 5.63 × 10⁻⁵). Further examination of the causal effects of IIMs on LC subtypes revealed a significant association with the risk of LUSC (OR, 1.168; 95% CI, 1.049–1.300; p = 0.00451), whereas no significant associations were found with LUAD (OR, 1.018; 95% CI, 0.944–1.099; p = 0.641) and SCLC (OR, 0.946; 95% CI, 0.844–1.061; p = 0.345). Figure 2 illustrates the forest plots depicting the causal relationships between genetically predicted IIMs and the risk of LC and its subtypes, whereas Figure 3 displays scatterplots of the MR analysis. These associations remained consistent across sensitivity analyses, even though significance was not achieved in the MR-Egger regression analysis (Fig. 2). Supplementary Figure 1 (https://links.lww.com/RHU/A659) presents the forest plot for the causal effects of each SNP. Cochran Q value did not indicate heterogeneity, and MR-Egger regression analysis did not reveal any evidence of potential unbalanced pleiotropy among estimates derived from individual SNPs (Table; Supplementary Fig. 2, https://links.lww.com/RHU/A659). Leave-one-out analysis further confirmed that the observed association was not driven by any SNP (Supplementary Fig. 3, https://links.lww.com/RHU/A659).
 FIGURE 2:
 Mendelian randomization results of causal estimates between IIMs and LC, including LC subtypes. The IVW, weighted median, and MR-Egger methods were performed to investigate bidirectional causal effects between IIMs and LC. Estimates of causality are reported as ORs with 95% CIs and deemed statistically significant when the Bonferroni corrected p value is <0.00625 (0.05/8). Power analysis implies the probability of correctly detecting the causal effects.
 FIGURE 3:
 Scatterplots of causal estimates between IIMs and LC, including LC subtypes. Scatterplot: The slope of each line corresponds to the causal estimates for each method. Individual SNP effect on the outcome (point and vertical line) against its effect on the exposure (point and horizontal line) is delineated in the background. Scatterplot of causal estimates for (A) IIMs on LC; (B) IIMs on LUAD; (C) IIMs on LUSC; (D) IIMs on SCLC; (E) LC on IIMs; (F) LUAD on IIMs; (G) LUSC on IIMs; and (H) SCLC on IIMs.
TABLE - Heterogeneity and Pleiotropy Tests Exposure Outcome No. SNPs Heterogeneity Test MR-Egger Pleiotropy Test Q p value Intercept p value IIMs LC 6 7.636 0.177 −0.072 0.255 IIMs LUAD 7 2.352 0.885 −0.029 0.735 IIMs LUSC 6 8.150 0.148 −0.162 0.200 IIMs SCLC 7 2.977 0.812 0.098 0.464 LC IIMs 26 23.101 0.572 −0.061 0.230 LUAD IIMs 5 8.326 0.080 0.360 0.089 LUSC IIMs 8 11.223 0.129 0.088 0.558 SCLC IIMs 3 9.662 0.008 −0.459 0.251In the reverse MR analysis, we aimed to determine the causal relationship of LC and its subtypes with IIMs. Following the exclusion of 2 potentially distorted outliers (rs2427012 and rs73487885 in SCLC) via MR-PRESSO analysis, IVW indicated that LC as a whole (OR, 1.153; 95% CI, 0.883–1.506; p = 0.296) was not causally associated with the risk of IIMs. Similarly, when assessing the causal effects of LC subtypes on IIMs using IVW, none of LUAD (OR, 1.121, 95% CI =0.692–1.816; p = 0.643), LUSC (OR, 1.173; 95% CI, 0.851–1.617; p = 0.329), and SCLC (OR, 0.739; 95% CI, 0.323–1.691; p = 0.739) displayed a causal connection to IIMs. Figure 2 presents the forest plots illustrating the causal relationships between genetically predicted LC and its subtypes and the risk of IIMs, whereas Figure 3 shows scatterplots of the MR analysis. These results were consistent across sensitivity analyses, although significance was not attained in the MR-Egger regression analysis (Fig. 2). Supplementary Figure 1 (https://links.lww.com/RHU/A659) provides the forest plot for the causal effect of each SNP. Mendelian randomization–Egger regression did not reveal evidence of directional pleiotropy for the impact of LC and its subtypes on IIMs. Significant heterogeneity was observed by Cochran Q test among SNPs in SCLC (Q = 9.662, p = 0.008) (Table 1; Supplementary Fig. 2, https://links.lww.com/RHU/A659). However, an additional MR analysis using the random-effects IVW method confirmed consistent causal effect estimates. In addition, leave-one-out analysis confirmed that no SNP exerted a substantial influence on the overall effect of each exposure on IIMs (Supplementary Fig. 3, https://links.lww.com/RHU/A659).
Power CalculationPower calculations conducted online indicated that the MR analyses had 100% power at a significance level of 0.05 to detect the previously estimated causal effect sizes of IIMs on LC (OR, 1.114) and LUSC (OR, 1.168) (Fig. 2).
DISCUSSIONPrevious observational studies have hinted at a possible association between IIMs and LC, but drawing causal inferences from observational research can be challenging because of the influence of potential confounding variables and reverse causality. Randomized controlled trials are considered the criterion standard for establishing causality, but they are often prohibitively expensive and time-consuming, and there may not always be appropriate interventions to test specific hypotheses.16 To date, there has been no randomized controlled trial specifically examining the relationship between IIMs and LC. Thus, the existence of an association between IIMs and LC, and its directionality if it does exist, remains uncertain. Bidirectional MR offers an efficient and cost-effective alternative to address these questions. Our study provides critical insights into the bidirectional causal relationships between IIMs and LC and its subtypes in the European population. Employing the MR approach, we found compelling evidence for IIM's positive causal association with LC, specifically LUSC, underscoring the importance of considering IIM characteristics during LC diagnosis. In contrast, no evidence supported LC causality in IIM development.
In our study, MR analysis was initially conducted to uncover the associations between genetic susceptibility to LC and the risk of IIMs. Previous epidemiological studies have suggested a potential link between IIMs and an increased risk of LC. For example, a population-based study from Sweden, Denmark, and Finland, comprising 618 cases of dermatomyositis and 914 cases of polymyositis, found a strong association of dermatomyositis (SIR, 5.9; 95% CI, 3.7–9.2) and polymyositis (SIR, 2.8; 95% CI, 1.8–4.4) with subsequent LC.10 Similarly, a large cohort study in China from 2006 to 2015 demonstrated significantly elevated SIRs for developing LC among IIM patients (SIR, 5.94; 95% CI, 3.40–9.65).11 A meta-analysis of 20 observational studies also found a significant association between dermatomyositis (pooled risk ratio, 3.65; 95% CI, 1.58–5.73) and polymyositis (pooled risk ratio, 15.01; 95% CI, 5.35–24.67) with LC.23 Another cohort study in Taiwan, comprising 1655 IIM patients without prior malignancy history, revealed an elevated risk of LC among individuals with dermatomyositis (SIR, 20.58; 95% CI, 19.71–21.44) and polymyositis (SIR, 5.38; 95% CI, 4.92–5.87).13 Our bidirectional MR analysis supported these findings by showing that IIM was indeed causally associated with a higher risk of LC as a whole (OR, 1.114; 95% CI, 1.057–1.173; p = 5.63 × 10⁻⁵). We further detected the causal effects of subtypes of LC on IIM etiology. To the best of our knowledge, there is only one documented case in the literature investigating the clinical characteristics of primary LC in individuals with IIMs. This retrospective analysis of 24 patients revealed that IIMs often preceded the detection of LC, with 7 cases of SCLC, 5 cases of LUSC, and 2 cases of LUAD identified.24 Our analysis revealed a causal effect of IIMs on the risk of LUSC (OR, 1.168; 95% CI, 1.049–1.300; p = 0.00451), whereas no significant causal effects were observed for LUAD and SCLC. The observed causal effect of IIMs on LC risk substantiates the idea that IIMs may share common immunological and inflammatory pathways with LC, leading to carcinogenesis.25,26 Idiopathic inflammatory myopathy–associated autoantibodies, such as anti–transcription intermediary factor 1γ and anti–nuclear matrix protein 2, have been implicated in malignancy development,27 further supporting the notion that IIM itself may act as a paraneoplastic syndrome.28 Regarding the causal relationship between IIMs and the risk of LUSC, it is indeed a significant finding. First, it is crucial to clarify that our study's conclusion is solely based on genetic predisposition and does not account for other factors such as environmental influences, autoimmunity, gut microbiome, and treatment status, which may contribute to the development of IIMs to LUSC. The underlying reasons besides genetic influences for this discovery remain unclear, and one theoretical explanation could be associated with immune dysregulation. Idiopathic inflammatory myopathies are typical autoimmune disorders with recent single-cell profiling revealing muscle-infiltrating T cells in IIMs.29 Similarly, LUSC has been shown to exhibit significant enrichments of T-cell exhaustion signatures and a high fraction of immunosuppressive cells.30 In addition, environmental factors such as tobacco, known for its proinflammatory effects leading to immune microenvironment alterations, could play a role.31 Moreover, immunomodulatory therapies such as calcineurin inhibitors, often prescribed once IIM is diagnosed, may target T cells, potentially contributing to T-cell exhaustion and an increased risk of LUSC occurrence. It is crucial for health care professionals to consider the increased LC risk, particularly LUSC, in IIM patients, which can guide the development of more targeted and closely monitored LC screening strategies for early detection and intervention. Importantly, understanding the causal relationship between IIMs and LC may alter clinical diagnoses and treatment plans. Clinicians should consider the potential overlap of symptoms in patients with IIMs or LC when evaluating individuals with symptoms related to either condition.
Subsequently, in the reverse MR analysis, we aimed to determine whether genetic liability to IIMs was associated with an increased risk of LC and its subtypes. Prior observational studies have presented conflicting evidence regarding whether LC may be a factor leading to the diagnosis of cancer-associated myositis. In a case-control study involving 1419 patients diagnosed with IIMs between 2002 and 2016, an increased adjusted OR was observed for the occurrence of LC before the diagnosis of IIMs (adjusted OR, 5.4; 95% CI, 2.5–11.6).32 A comparative study suggested an elevated occurrence of myositis within 3 years of a LC diagnosis (SIR, 7.27; 95% CI, 1.98–18.61).33 On the contrary, a population-based study involving 537 patients who were diagnosed with biopsy-positive IIMs between 1981 and 1995 revealed that 42 patients had been diagnosed with malignant diseases before their myositis diagnosis. Among these cases, only one was related to LC, suggesting that LC may not be associated with the onset of IIMs.9 In a South Australian study of 373 patients with confirmed IIMs, 8 cases had LC before IIM diagnosis, which was fewer than cases seen with melanoma, blood cancers, breast cancer, and prostate cancer.34 Regarding this controversy, our comprehensive MR study supported the latter perspective, suggesting that there is no significant genetic susceptibility linking LC and its subtypes to an increased risk of IIMs. The absence of evidence supporting the idea that LC causally contributes to the development of IIMs is a crucial finding. This suggests that, genetically, LC may not directly influence the pathogenesis of IIMs. Clinicians should consider this information when managing patients with LC, particularly in the absence of IIM-related symptoms. Although cancer-associated myositis is a well-recognized entity, our results imply that this relationship might be more complex and potentially mediated by factors other than shared genetic variants.4 Cancer-associated myositis could be influenced by a combination of factors such as tumor-specific antigens,35 immune responses,26,36 and paraneoplastic mechanisms.37
Our study benefits from the application of MR analysis, which minimizes confounding factors and mitigates the risk of reverse causation present in observational studies. The ORs we derived exhibit slight differences from earlier reported estimates, which could stem from divergent research methodologies and variations in study populations. To ensure the reliability of the findings and the consistency of the causal estimation, sensitivity analyses were carried out. In addition, the utilization of a large, publicly available genetic dataset enhances the generalizability of our findings.
However, it is crucial to acknowledge several limitations to our study. First, sample overlap may arise as both the IIM and LC GWASs originated from the FinnGen study. However, recent studies have validated the use of the 2-sample MR method for large datasets, surpassing 300,000 samples from a single source.38 Furthermore, we calculated the F statistic as a metric to gauge the robustness and effectiveness of the IVs in our analyses, and all IVs exhibited F values exceeding 10, strengthening confidence in the reliability of our analysis.39 To evaluate potential overlap bias, we used an online tool based on a pertinent study (https://sb452.shinyapps.io/overlap/) for calculating overlap bias.40 The results indicated that the bias values across all groups were 0.000, even under a 100% overlap assumption, with a type I error rate of 0.05. This implies that demographic overlap is unlikely to skew our results. Second, the limited number of IVs resulted in the establishment of a lower P threshold to ensure that no fewer than 3 SNPs were used for analysis. Although F statistic tests showed no evidence of mild instrument bias and the mean F statistics were consistently high, caution should still be exercised when interpreting the results. In addition, the relatively small case size of IIM patients limited our ability to investigate causal relationships between IIM subtypes and LC. As more cases accumulate in the future, more comprehensive research with a specific focus on different subtypes of IIMs should be conducted. Furthermore, our study's results, which were based on individuals of European descent, may not be directly applicable to other racial groups. For future studies, expanding the sample size and including samples with diverse origins are a priority Last but not least, although our study focused on genetic predisposition, it does not account for other factors such as the treatment status that may contribute to IIM or LC development, because the FinnGen database lacks detailed information, including clinical profiles, test results, and treatment status for individuals in our study. Future research is anticipated to address these issues as more high-quality GWASs become available.
CONCLUSIONSIn this MR study, the results indicate a causal relationship between IIMs and LC, particularly LUSC, in the European population. However, there is no evidence to support the idea that LC causally contributes to the development of IIMs. These findings emphasize the importance of considering the co-occurrence of IIMs and LC, especially in the context of LUSC, when it comes to clinical management and screening efforts. Further research is needed to better understand the precise mechanisms underlying this association and to explore potential interventions for reducing LC risk in individuals with IIMs.
 ACKNOWLEDGMENTS
The authors thank the FinnGen Consortium and all study participants for providing access to the data used in this study.
REFERENCES 1. Lundberg IE, Fujimoto M, Vencovsky J, et al. Idiopathic inflammatory myopathies. Nat Rev Dis Primers. 2021;7:87. 2. Mammen AL. Autoimmune myopathies: autoantibodies, phenotypes and pathogenesis. Nat Rev Neurol. 2011;7:343–354. 3. Dalakas MC. Inflammatory muscle diseases. N Engl J Med. 2015;372:1734–1747. 4. Patasova K, Lundberg IE, Holmqvist M. Genetic influences in cancer-associated myositis. Arthritis Rheumatol. 2023;75:153–163. 5. Lamb JA. The genetics of autoimmune myositis. Front Immunol. 2022;13:886290. 6. Che WI, Westerlind H, Lundberg IE, et al. Familial autoimmunity in patients with idiopathic inflammatory myopathies. J Intern Med. 2023;293:200–211. 7. Miller FW, Lamb JA, Schmidt J, et al. Risk factors and disease mechanisms in myositis. Nat Rev Rheumatol. 2018;14:255–268. 8. Oddis CV, Aggarwal R. Treatment in myositis. Nat Rev Rheumatol. 2018;14:279–289. 9. Buchbinder R, Forbes A, Hall S, et al. Incidence of malignant disease in biopsy-proven inflammatory myopathy. A population-based cohort study. Ann Intern Med. 2001;134:1087–1095. 10. Hill CL, Zhang Y, Sigurgeirsson B, et al. Frequency of specific cancer types in dermatomyositis and polymyositis: a population-based study. Lancet. 2001;357:96–100. 11. Zhou Z, Liu H, Yang Y, et al. The five major autoimmune diseases increase the risk of cancer: epidemiological data from a large-scale cohort study in China. Cancer Commun (Lond). 2022;42:435–446. 12. Tiniakou E, Mammen AL. Idiopathic inflammatory myopathies and malignancy: a comprehensive review. Clin Rev Allergy Immunol. 2017;52:20–33. 13. Chen YJ, Wu CY, Huang YL, et al. Cancer risks of dermatomyositis and polymyositis: a nationwide cohort study in Taiwan. Arthritis Res Ther. 2010;12:R70. 14. Mecoli CA, Igusa T, Chen M, et al. Subsets of idiopathic inflammatory myositis enriched for contemporaneous cancer relative to the general population. Arthritis Rheumatol. 2023;75:620–629. 15. Ungprasert P, Leeaphorn N, Hosiriluck N, et al. Clinical features of inflammatory myopathies and their association with malignancy: a systematic review in Asian population. ISRN Rheumatol. 2013;2013:509354. 16. Emdin CA, Khera AV, Kathiresan S. Mendelian randomization. JAMA. 2017;318:1925–1926. 17. Kurki MI, Karjalainen J, Palta P, et al. FinnGen: unique genetic insights from combining isolated population and national health register data. medRxiv. 2022. 03.03.22271360, 2022. 18. Kamat MA, Blackshaw JA, Young R, et al. PhenoScanner V2: an expanded tool for searching human genotype-phenotype associations. Bioinformatics. 2019;35:4851–4853. 19. Waldman R, DeWane ME, Lu J. Dermatomyositis: diagnosis and treatment. J Am Acad Dermatol. 2020;82:283–296. 20. Long K, Danoff SK. Interstitial lung disease in polymyositis and dermatomyositis. Clin Chest Med. 2019;40:561–572. 21. Burgess S, Bowden J, Fall T, et al. Sensitivity analyses for robust causal inference from Mendelian randomization analyses with multiple genetic variants. Epidemiology. 2017;28:30–42. 22. Brion MJ, Shakhbazov K, Visscher PM. Calculating statistical power in Mendelian randomization studies. Int J Epidemiol. 2013;42:1497–1501. 23. Yang Z, Lin F, Qin B, et al. Polymyositis/dermatomyositis and malignancy risk: a metaanalysis study. J Rheumatol. 2015;42:282–291. 24. Fujita J, Tokuda M, Bandoh S, et al. Primary lung cancer associated with polymyositis/dermatomyositis, with a review of the literature. Rheumatol Int. 2001;20:81–84. 25. Torres-Ruiz J, Alcala-Carmona B, Alejandre-Aguilar R, et al. Inflammatory myopathies and beyond: the dual role of neutrophils in muscle damage and regeneration. Front Immunol. 2023;14:1113214. 26. Thompson C, Piguet V, Choy E. The pathogenesis of dermatomyositis. Br J Dermatol. 2018;179:1256–1262. 27. Chinoy H, Fertig N, Oddis CV, et al. The diagnostic utility of myositis autoantibody testing for predicting the risk of cancer-associated myositis. Ann Rheum Dis. 2007;66:1345–1349. 28. Manger B, Schett G. Paraneoplastic syndromes in rheumatology. Nat Rev Rheumatol. 2014;10:662–670. 29. Argyriou A, Horuluoglu B, Galindo-Feria AS, et al. Single-cell profiling of muscle-infiltrating T cells in idiopathic inflammatory myopathies. EMBO Mol Med. 2023;15:e17240. 30. Hao B, Zhang Z, Lu Z, et al. Single-cell RNA sequencing analysis revealed cellular and molecular immune profiles in lung squamous cell carcinoma. Transl Oncol. 2023;27:101568. 31. Desrichard A, Kuo F, Chowell D, et al. Tobacco smoking-associated alterations in the immune microenvironment of squamous cell carcinomas. J Natl Cancer Inst. 2018;110:1386–1392. 32. Dani L, Ian Che W, Lundberg IE, et al. Overall and site-specific cancer before and after diagnosis of idiopathic inflammatory myopathies: a nationwide study 2002–2016. Semin Arthritis Rheum. 2021;51:331–337. 33. Kang EH, Lee SJ, Ascherman DP, et al. Temporal relationship between cancer and myositis identifies two distinctive subgroups of cancers: impact on cancer risk and survival in patients with myositis. Rheumatology (Oxford). 2016;55:1631–1641. 34. Limaye V, Luke C, Tucker G, et al. The incidence and associations of malignancy in a large cohort of patients with biopsy-determined idiopathic inflammatory myositis. Rheumatol Int. 2013;33:965–971. 35. Muro Y, Ishikawa A, Sugiura K, et al. Clinical features of anti–TIF1-alpha antibody-positive dermatomyositis patients are closely associated with coexistent dermatomyositis-specific autoantibodies and anti–TIF1-gamma or anti–mi-2 autoantibodies. Rheumatology (Oxford). 2012;51:1508–1513. 36. Fiorentino DF, Chung LS, Christopher-Stine L, et al. Most patients with cancer-associated dermatomyositis have antibodies to nuclear matrix protein NXP-2 or transcription intermediary factor 1gamma. Arthritis Rheum. 2013;65:2954–2962. 37. Zahr ZA, Baer AN. Malignancy in myositis. Curr Rheumatol Rep. 2011;13:208–215. 38. Minelli C, del Greco MF, van der Plaat DA, et al. The use of two-sample methods for Mendelian randomization analyses on single large datasets. Int J Epidemiol. 2021;50:1651–1659. 39. Pierce BL, Ahsan H, Vanderweele TJ. Power and instrument strength requirements for Mendelian randomization studies using multiple genetic variants. Int J Epidemiol. 2011;40:740–752. 40. Burgess S, Davies NM, Thompson SG. Bias due to participant overlap in two-sample Mendelian randomization. Genet Epidemiol. 2016;40:597–608.
留言 (0)