
記住我


Umbilical cord blood (UCB) has become an important source of hematopoietic stem cells because of its abundance, timely acquisition, low requirements for human leukocyte antigen (HLA) matching, and low incidence and mild degree of chronic graft-versus-host disease (cGVHD).[1–4] However, due to the limited number of UCB cells, the time of immune reconstitution (IR) after UCB transplantation (UCBT) is considered delayed, resulting in an increased incidence of transplant-related complications.[5,6] IR after hematopoietic stem cell transplantation (HSCT) is critical for control infection, GVHD, and enhanced antileukemia effects,[7–10] which can be affected by various factors such as conditioning regimen and stem cell source.[11,12] Waller et al[13] monitored the IR process in 410 patients after bone marrow or peripheral blood stem cell transplantation using flow cytometry and reported the time axis and differences in IR from different stem cell sources. Thus, the detection of lymphocyte subsets could be used to monitor patient condition after transplantation and may provide preemptive therapy. However, few studies analyzed the kinetics of IR after UCBT according to normal reference range of healthy volunteers, and the double-negative T (DNT) cell subgroup almost ignored in the analysis of IR after transplantation.
Lymphocyte subtypes mainly comprise T, B, and natural killer (NK) cells, which play a critical role in maintaining immune homeostasis in the human body by affecting innate and adaptive immunity.[14–18] Regulatory T (Treg) and B (Breg) cells are key regulators of inflammation and are important for immune tolerance and balance. In the previous studies, these two cells were shown to secrete interleukin-10 (IL-10), transforming growth factor-beta (TGF-β), and IL-35 to exert their immunomodulatory functions.[19–22] In addition, DNT cells are a special type of T cell that are expressing cluster of differentation 3 (CD3) but without CD4 or CD8 expression; they have some regulatory-T cell characteristics that could play a role in immune homeostasis. DNT cells have been shown to suppress activated CD8+ and CD4+ T cells, B cells, and dendritic cells in various mouse models that rely on cell contact.[23,24] Using single-cell ribonucleic acid (RNA) sequencing, Yang et al[25] identified five DNT subgroups, including resting DNT (nDNT0), which contributed to synthetic proteins, keeping themselves alive and preparing for activation; helper DNT (nDNT1), which could secret cytokines, such as IL-17; intermediate DNT (nDNT2), cytotoxic DNT (nDNT3), as well as innate DNT (nDNT4) cells. Besides, the sequencing indicated that IKZF2 is a distinguished transcriptional factor of DNT cells. However, it is precise because of the heterogeneity of DNT cells that they exhibit functional diversity. Recent researches indicate that DNT cells are involved in various chronic inflammatory diseases, but it is not entirely clear whether they ultimately play a pathogenic or regulatory role.[26]
In this study, we measured the baseline data of different lymphocyte subgroups in healthy people, and then reported the kinetics of each subgroup IR after UCBT and compared them with the baseline. Finally, we identified the relationship between each lymphocyte subset reconstitution and acute GVHD (aGVHD), especially DNT cell reconstitution after UCBT.
Methods Study populationHealthy volunteers were recruited from the First Affiliated Hospital of the University of Science and Technology of China. From August 20th to October 15th 2021, 362 eligible healthy volunteers aged 17 years to 84 years were enrolled in the study. All individuals underwent routine medical examinations. None of the participants used specific medications, such as steroids or other immunosuppressive drugs. This study was approved by the Ethics Committee of the First Affiliated Hospital of the University of Science and Technology of China (No. 2021-N[H]-120).
From August 14th 2018 to June 14th 2021, a total of 131 patients (aged 17–65 years) with hematological malignancies who underwent a single-unit UCBT for the first time were recruited from the Department of Hematology of the First Affiliated Hospital of USTC. IR analysis was performed after transplantation. All subjects conducted lymphocyte subsets testing at least once in the first year after UCBT. This study was approved by the Ethics Committee of the First Affiliated Hospital of the University of Science and Technology of China (No. 2022-RE-255na).
All participants signed an informed consent form before participating in the study. All procedures were performed in accordance with the ethical standards of the Declaration of Helsinki.
Sample and lymphocyte subset collection using flow cytometryAll peripheral blood samples were collected after routine blood examination using ethylenediaminetetraacetic acid anticoagulant tubes. All samples were detected using a multiparameter flow cytometer with the Diva program (four lasers, 18 colors; BD Biosciences, San Jose, CA, USA) within 24 h after collection.[27,28] The panels for lymphocyte subsets contained the following reagents: anti-CD3-allophycocyanin (APC)-cyanine (Cy)-7, anti-CD4-Brilliant Violet (BV)510, anti-CD8-APC, anti-CD19-BV421, anti-CD24-phycoerythrin (PE)-Cy7, anti-CD38-PE-Cy5, anti-CD45-Alexa Fluor (AF)700, anti-CD56-BV650, anti-CD25-Brilliant Blue (BB) 515, and anti-CD127-BV605 (all antibodies were obtained from BD Biosciences). The immunophenotypes of lymphocyte subsets were as follows: CD3+ T cells (CD45+CD3+), CD4+ T cells (CD45+CD3+CD4+), CD8+ T cells (CD45+CD3+CD8+), DNT cells (CD45+CD3+CD4-CD8-), Treg cells (CD45+CD3+CD4+CD25+CD1271ow/-), NK cells (CD45+CD3-CD56+), NKT cells (CD45+CD3+CD56+), B cells (CD45+CD3-CD19+), and Breg cells (CD45+CD3-CD19+CD24highCD38high).[21,29]
After lysis of red blood cells (RBCs) using RBC lysis buffer (Catalog #R1010, Solarbio, Beijing, China), mononuclear cells were obtained and stained with antibodies for 15–20 min in the dark at 4°C. The samples were then washed twice and measured using multifunctional flow cytometry (MFC), according to the manufacturer's protocol. For each sample, at least 10,000 cells were acquired and analyzed using FlowJo 10.0 software (https://www.univ-bio.cn/service-3.html?id=509).[27]
Compensation was performed using CompBeads (negative control and anti-mouse IgG from BD Biosciences). The flow gate determined all lymphocyte subsets based on various cell-specific surface molecular markers [Supplementary Figure 1, https://links.lww.com/CM9/B729]. White blood cell counts were used to calculate absolute cell counts. The percentage and absolute number of lymphocyte subsets were determined for the study population [Supplementary Table 1, https://links.lww.com/CM9/B729].
Cord blood selection and HLA typingHLA typing of the cord blood of patients was determined using molecular techniques with 10 allele-level resolutions for human leukocyte antigen-A (HLA-A), HLA-B, HLA-C,HLA-DRB1, and HLA-DQB1. All patients received single-unit cord blood samples, which were identified and obtained from the Chinese Cord Blood Bank. Each unit was matched with a recipient at a high-resolution match rate of ≥5/10 and contained at least 3.0 × 10⁷ total nucleated cells (TNCs)/kg of recipient body weight and 1.2 × 10⁵ CD34+ cells/kg of recipient body weight before freezing. Anti-HLA antibodies in recipients were detected before transplantation, and cord blood units with donor-specific antigens were avoided.
TransplantationsAll patients received a myeloablative conditioning regimen, specifically containing busulfan (Bu; 0.8 mg/kg every 6 h for 3 days or 4 days) or total marrow irradiation (TMI; total 12 Gy, four fractions) combined with cyclophosphamide (Cy; 60 mg/kg daily for 2 days). Fludarabine (Flu; 30 mg/m2 daily for 4 days) was added to all Bu/Cy (n = 123) and TMI/Cy (n = 8) regimens. For GVHD prophylaxis, all patients received cyclosporine and mycophenolate mofetil-based regimens, as previously reported,[30] which were performed according to previous standard UCBT procedures.[31]
DefinitionsThe diagnosis and classification of acute and chronic GVHD were performed according to published criteria.[32,33] Acute GVHD was classified into grades 0–4, grade 0: no stage 1–4 of any organ; grade I: stage 1–2 skin without liver, upper gastrointestinal tract (GI) or lower GI involvement; grade II: stage 3 rash and/or stage 1 liver and/or stage 1 upper GI and/or stage 1 lower GI; grade III: stage 2–3 liver and/or stage 2–3 lower GI, with stage 0–3 skin and/or stage 0–1 upper GI; grade IV: stage 4 skin, liver or lower GI involvement, with stage 0–1 upper GI. Chronic GVHD was classified as mild, moderate, and severe grades. GVHD-free and relapse-free survival (GRFS) was defined as survival without grade III–IV aGVHD, cGVHD requiring systemic immunosuppression therapy, or relapse.
Statistical analysisContinuous variables with a normal distribution were presented as means ± standard deviations (SDs); variables with a skewed were shown as medians (Q1, Q3). Categorical variables were reported as frequencies (%). Comparisons of clinical characteristics between groups were performed using t-tests for parametric data and Mann–Whitney U tests for non-parametric data. For repeated-measures analysis, a generalized linear model was used to determine whether there is a difference in each test indicator between the two groups. Kaplan–Meiercurves were used to describe the survival and cumulative incidence of events. The Fine-Gray proportional hazard regression for competing events model and Cox proportional hazard regression model were used for univariate and multivariate analyses. P <0.05 was considered statistically significant. Data were analyzed using IBM SPSS Statistics software (version 22.0, SPSS, Inc., Armonk, NY, USA) and R software packages, version 4.0.5 (R Foundation for Statistical Computing, Vienna, Austria). All figures were constructed using GraphPad Prism 9 software (Graphpad Software, Inc., San Diego, CA, USA).
Results DNT cells for sex- and age-specific groups in healthy volunteersA total of 362 healthy volunteers who met the screening criteria were enrolled in this analysis. Among them, 182 volunteers were male, with a median age of 45.0 years (range, 17.0–84.0 years). The 362 healthy volunteers were divided into three subgroups by age: young group (42.8% [155/362]; 17.0–39.0 years; 69 men, 86 women; median age 27.0 years), middle-aged group (38.4% [139/362]; 40.0–59.0 years; 70 men, 69 women; median age 48.0 years), and elderly group (18.8% [68/362]; 60.0 years and above; 43 men, 25 women; median age 66.0 years).
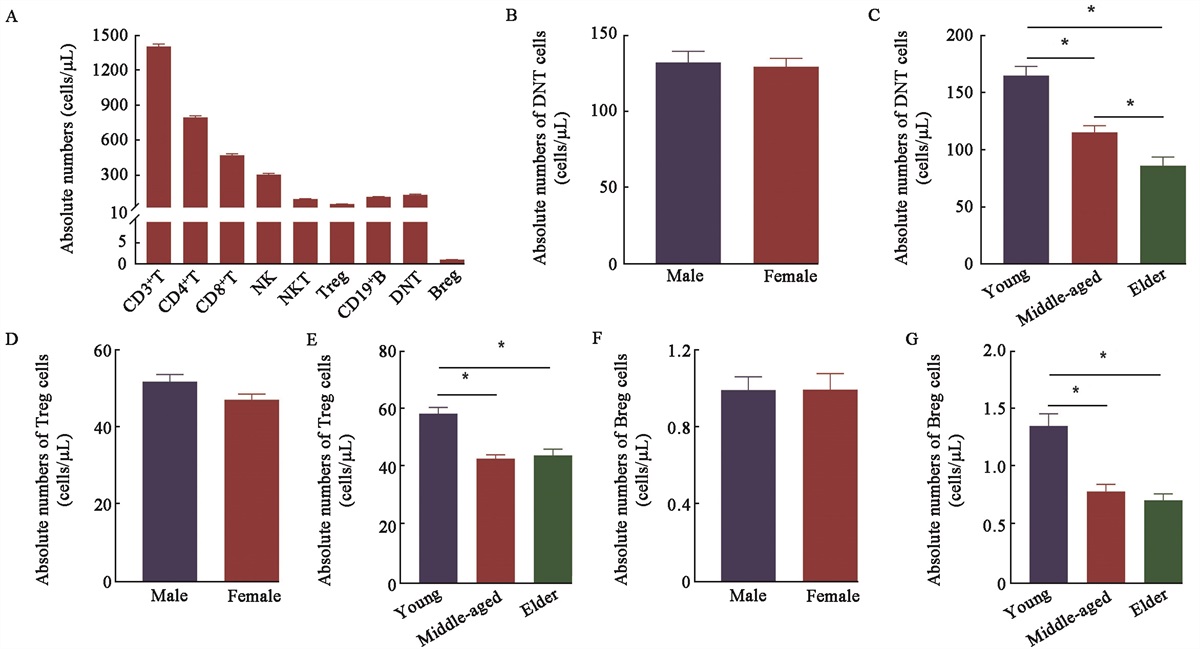
It can be seen in Supplementary Table 1, https://links.lww.com/CM9/B729, that DNT cells only accounted for 5.82% (3.98–8.19)% of lymphocytes. As shown in Figure 1A and Supplementary Figure 2A, https://links.lww.com/CM9/B729, the absolute numbers and percentage of nine kinds of lymphocyte subsets were analyzed in this study: CD3+ T, CD4+ T, CD8+ T, Treg, CD19+ B, Breg, DNT, NK, and NKT cells (refer to Supplementary Table 1, https://links.lww.com/CM9/B729 for details). To evaluate the influence of sex on DNT, Treg, and Breg cells, we compared the median and reference ranges for their absolute numbers and percentages between the male and female populations. No significant differences were found in the absolute number of DNT, Treg, and Breg cells [Figure 1B,D,F] between the male and female populations. However, there was a significant difference in the percentage of Treg cells, rather than DNT and Breg cells, between the male and female populations [Supplementary Figure 2B,D,F, https://links.lww.com/CM9/B729]. To identify age-associated differences in the reference ranges of DNT, Treg, and Breg cells, we divided participants into three subgroups: a young group, a middle-aged group, and an elderly group (as above). As shown, a significant decreasing trend in the absolute numbers and percentages of DNT cells was observed with increasing age. For the absolute numbers and percentages of Treg and Breg cells, the young volunteers presented higher levels than the other two groups [Figure 1C,E,G and Supplementary Figure 2C,E,G, https://links.lww.com/CM9/B729].
 Figure 1:
 Reference range of 362 healthy volunteers' lymphocytes. (A) absolute number of lymphocyte subsets; comparisons of absolute number of DNT cells between different (B)sex and (C) age groups;comparisons of absolute number of Treg cells between different (D) sex and (E) age groups; comparisons of absolute number of Breg cells between different (F) sex and (G) age groups. Breg: Regulatory B; DNT: Double-negative T; Treg: Regulatory T; CD: Cluster of differentation; NK: Natural killer; NKT: Natural killer T; *P <0.001.
Clinical characteristics and outcomes in UCBT patientsAmong the 131 patients with hematological malignancies who received UCBT, 58 were female, with a median age of 31.0 years (range, 18.0–65.0 years), and the remaining 73 were male, with a median age of 31.5 years (range, 17.0–61.0 years). A total of 51.9% (68/131) of the patients were diagnosed with acute myeloid leukemia, 35.1% (46/131) with acute lymphocytic leukemia, and 13.0% (17/131) with myelodysplastic syndrome. A total of 111 patients achieved complete remission before transplantation, whereas the remaining 20 had non-remission status before transplantation. All patients received at least 5/10 high-resolution HLA compatibility UCB, of which only 6 (4.6%) patients had HLA compatibility ≥9/10. The median infused TNC was 2.51 (range, 0.11–5.43) × 107/kg, and the median infused CD34+ cells was 1.58 (range, 0.10–12.03) × 105/kg. Demographic and transplant characteristics of the patients were presented in Supplementary Table 2, https://links.lww.com/CM9/B729.
All surviving patients were followed up until June 30, 2022, and the median follow-up time was 1034 (range: 243–1417) days. The cumulative incidence of 42-day neutrophil engraftment was 100%, and that of 120-day platelet engraftment was 87.0% (95% confidence interval [CI], 79.8%–91.7%). The cumulative incidence of 100-day aGVHD, II–IV aGVHD, and 1-year cGVHD was 46.6% (95% CI, 37.3%–54.5%), 32.1% (95% CI, 23.6%–39.6%), and 19.8% (95% CI, 12.7%–26.4%), respectively. The 1-year overall survival rate, leukemia-free survival rate, and GRFS rate were 86.9% (95% CI, 79.8%–91.7%), 83.9% (95% CI, 76.3%–89.2%), and 52.6% (95% CI, 43.6%–60.8%), respectively.
IR characteristics of patients after UCBTTo identify the IR characteristics of patients after UCBT, we first established the reference range of lymphocyte subsets from a total of 362 healthy volunteers. The absolute numbers of CD3+ T, CD4+ T, CD8+ T, DNT, NK, NKT, B, Treg, and Breg cells were 1347 (1128–1636), 767 (616–942), 435 (319–579), 109 (70–157), 252 (158–379), 69 (47–114), 105 (77–137), 45 (33–60), and 1 (0–1)/μL, respectively. The percentages of CD3+ T, CD4+ T, CD8+ T, DNT, NK, NKT, B, Treg, and Breg cells in lymphocytes were 74.53% (67.28%–80.52%), (41.77 ± 9.16)%, (24.12 ± 7.15)%, 5.82% (3.98%–8.19%), 13.81% (9.11%–20.51%), 3.73% (2.52–6.11%), 5.56% (4.29–7.09%), 2.44% (1.93%–2.99%), and 0.04% (0.02%–0.07%), respectively [Supplementary Table 1, https://links.lww.com/CM9/B729]. The absolute numbers and percentages of healthy volunteers in each subgroup were shown respectively in Figure 1A and Supplementary Figure 2A, https://links.lww.com/CM9/B729.
Next, we analyzed the data from 131 patients at different time points after UCBT (1 month, 3 months, 6 months, 9 months, and 12 months). Meanwhile, reference lines were drawn using the detected values of 262 healthy volunteers who matched gender and age. Compared with the normal range, DNT and Treg cells increased slowly and failed to reach the normal range within one year after UCBT. CD8+ T, NK, and Breg cells recovered rapidly after UCBT. Absolute numbers of CD3+ T, CD4+ T, and B cells recovered to normal levels approximately 6 months after UCBT. The trends in the percentage and absolute cells of most immune cell subsets were consistent, except for NK cells [Figure 2].
 Figure 2:
 Reconstitution of lymphocyte subsets in GVHD and non-GVHD groups at 1 month, 3 months, 6 months, 9 months, and 12 months after UCBT in absolute numbers and percentages. The black dotted lines were fitted to the median of individual lymphocyte cells from healthy volunteers. Absolute number and frequency of DNT cells (A,B) , Treg cells (C,D), Breg cells (E,F), CD3+ T cells (G,H), CD4+ T cells (I,J), CD8+ T cells (K,L), NK cells (M,N), and B cells (O,P) in the two groups, respectively. Each solid point represents the mean, and the error bars represent SEM. aGVHD: Acute graft‐versus‐host disease; Breg: Regulatory B; CD: Cluster of differentation; DNT: Double-negative T; NK: Natural killer; SEM: Standard error of the mean; Treg: Regulatory T; UCBT: Umbilical cord blood transplantation.
Faster DNT cell reconstitution and occurrence of aGVHDTo identify whether IR was associated with the occurrence of aGVHD after UCBT, the patients were divided into an aGVHD group (61 cases) and a non-aGVHD group (70 cases) according to whether aGVHD occurred. The absolute number and percentage of DNT cells in the T cell subgroup were significantly higher in the non-aGVHD group than in the aGVHD group within one year (F = 4.684, P = 0.039 and F = 5.583, P = 0.026, respectively). Comparing the Treg cells of the two groups, it was found that only the percentage of Treg cells in CD4+ cell subgroup was different (F = 4.727, P = 0.039). No significant differences were noted in both the absolute numbers and percentages of CD3+ T, CD4+ T, CD8+ T, NK, B, and Breg cells between the two groups [Figure 2].
To determine the effect of DNT reconstitution on GVHD, we analyzed the DNT cells at different time points after UCBT (1 month, 3 months, 6 months, 9 months, and 12 months). As shown in Figure 3A,B, the absolute numbers and percentages of DNT cells were significantly higher in the non-aGVHD group than in the aGVHD group at 1 month and 12 months (22 ± 6 vs. 8 ± 2, Z = 2.853, P = 0.004; (2.12 ± 0.69)% vs. (1.00 ± 0.20)%, Z = 2.004, P = 0.045 and 114 ± 24 vs. 55 ± 9, Z = 2.475, P = 0.013; (3.04 ± 0.37)% vs. (2.03 ± 0.30)%, Z = 2.354, P = 0.019, respectively). We also analyzed the influence of DNT reconstitution at different time points on cGVHD. No significant differences were found between groups in terms of DNT cells [Supplementary Figure 3, https://links.lww.com/CM9/B729].
 Figure 3:
 Comparisons of absolute numbers and frequencies of DNT cells at 1 month, 3 months, 6 months, 9 months, and 12 months after UCBT between non-GVHD, I–II GVHD, and III–IV groups. Absolute number (A) and frequency (B) of DNT cells among patients with or without aGVHD. Absolute number (C) and frequency (D) of DNT cells in non-GVHD, I–II GVHD, and III–IV groups. aGVHD: Acute graft‐versus‐host disease; DNT: Double-negative T; UCBT: Umbilical cord blood transplantation; *P <0.05, †P <0.01, ‡P <0.001.
To further determine the influence of different degrees of aGVHD on DNT cells, patients with aGVHD were divided into I–II and III–IV aGVHD groups according to the grade of aGVHD. A decreasing trend in the absolute numbers of DNT cells was observed with increasing severity of aGVHD at one month (22 ± 6 vs. 9 ± 3 vs. 5 ± 2; Z = 2.082, P = 0.037 and Z = 2.744, P = 0.006); the same trend was also observed in the percentage of lymphocytes, but only the non-aGVHD group and the III–IV aGVHD group had significant statistical differences ([2.12 ± 0.69]% vs. [0.64 ± 0.14]%; Z = 2.626, P = 0.009). The percentages ([3.99 ± 0.49]% vs. [2.41 ± 0.47]%; Z = 1.995, P = 0.046) but not the absolute numbers of DNT cells were significantly higher in the non-aGVHD group than those in the I–II aGVHD group at six months. The absolute numbers and percentages of DNT cells were significantly higher in the non-aGVHD group than those in the I–II aGVHD group (114 ± 24 vs. 54 ± 13; Z = 2.344, P = 0.019 and [3.04 ± 0.37]% vs. [1.96 ± 0.37]%; Z = 2.054, P = 0.040, respectively) at 12 months after transplantation [Figure 3C,D].
Faster DNT cell reconstitution and aGVHDTo further clarify the predictive value of DNT cells for aGVHD, 75 patients with complete IR data in the first month were selected from the 131 patients and divided into two groups according to the median of 5.8 cells/μL of the absolute number of DNT cells in the first month: a DNT-low group (≤5.8/μL) and a DNT-high group (>5.8/μL). Upon comparing the characteristics of the two groups, there were no differences in terms of sex, age, weight, diagnostics, ABO incompatibility, HLA matching, pre-transplantation disease status, or the number of infused cells, except for the difference in the donor to recipient sex (χ2 = 4.337; P = 0.037) [Table 1].
Table 1 - Characteristics of patients between low-DNT group and high-DNT group. Characteristics Low-DNT group (N = 38) High-DNT group (N = 37) χ 2/t P-value Sex, n (%) 0.011* 0.916 Male 21 (55.3) 20 (54.1) Female 17 (44.7) 17 (45.9) Age (years), median (range) 31 (17–65) 31.5 (18–61) 0.648† 0.519 Weight (kg), median (range) 60 (43–102) 61 (41–85) 0.483† 0.631 Diagnosis 0.664* 0.717 AML 23 (60.5) 19 (51.4) ALL 12 (31.6) 14 (37.8) MDS 3 (7.9) 4 (10.8) ABO incompatibility, n (%) 1.960* 0.581 Identical 11 (28.9) 10 (27.0) Major incompatibility 14 (36.8) 9 (24.3) Minor incompatibility 9 (23.7) 13 (35.1) Bidirectional incompatibility 4 (10.5) 5 (13.5) High-resolution HLA compatibility (/10), n (%) 1.247* 0.536 ≤6 13 (34.2) 9 (24.3) 7 or 8 22 (57.9) 26 (70.3) ≥9 3 (7.9) 2 (5.4) Donor to recipient sex 4.337* 0.037 F/M 10 (26.3) 3 (8.1) Others 28 (73.7) 34 (91.9) Remission status before transplantation 1.375* 0.503 CR1 21 (55.3) 25 (67.6) CR2/CR3 10 (26.3) 8 (21.6) NR 7 (18.4) 4 (10.8) Conditioning regimen All patients with MAC NA Infused TNCs, median (range) (×107/kg) 2.35 (0.11–4.48) 2.60 (0.85–4.31) 1.794† 0.077 Infused CD34+ cell, median (range) (×105/kg) 1.41 (0.10–6.69) 1.82 (0.43–8.58) 1.788† 0.078ALL: Acute lymphocyte leukemia; AML: Acute myelocytic leukemia; CR: Complete remission; HLA: Human leukocyte antigen; MAC: Myeloablative conditioning; MDS: Myelodysplastic syndrome; NA: Not available; TNCs: Total nucleated cells; *χ2-value; †t-value.
Then, we found that the incidences of I–IV and II–IV aGVHD in the DNT-high group were significantly lower than those in the DNT-low group (35.1% [20.2%–50.5%] vs. 68.4% [50.6%–80.9%], P = 0.005; 21.7% [7.2%–33.9%] vs. 42.1% [24.1%–55.9%], P = 0.046), and the GRFS of the former was significantly higher than that of the latter (68.6% [50.4%–81.3%] vs. 44.7% [28.7%–59.5%], P = 0.039). In addition, the cumulative incidence of III–IV aGVHD incidence, cGVHD and relapse, 1-year overall survival, and 1-year Leukemia-free survival rates were not statistically different between the two groups [Supplementary Figure 4, https://links.lww.com/CM9/B729].
Finally, through univariate analysis, we found that sex, weight, the absolute number of lymphocytes, T-cells, DNT cells, Treg cells, and B cells might be factors that affect the occurrence of aGVHD. Then, through multivariate analysis, it was finally determined that male sex, DNT absolute number >5.8 cells/μL, and Treg absolute number >3.2 cells/μL in the first month after transplantation were independent protective factors for the occurrence of aGVHD (hazard ratio [HR]: 0.48, 95% CI: 0.27–0.87, P = 0.016; HR: 0.46, P = 0.031; HR: 0.50, 95% CI: 0.23–0.93, P = 0.049) [Table 2].
Table 2 - Univariate and multivariate analysis on aGVHD in 75 patients. Baseline values Compared values Univariate Multivariate HR (95% CI) P-value HR (95% CI) P-value Sex 0.52 (0.28–0.97) 0.039 0.48 (0.27–0.87) 0.016 Female Male Weight, median (kg) 0.49 (0.25–0.96) 0.036 ≤60 >60 Age, median (years) 0.64 (0.34–1.21) 0.17 ≤31 >31 Diagnostics AML Reference; ALL 1.10 (0.56–2.15) 0.77 MDS 1.07 (0.41–2.78) 0.89 ABO incompatibility Match Reference; Major incompatibilities 1.03 (0.48–2.24) 0.93 Minor incompatibilities 0.72 (0.32–1.61) 0.42 Bilateral incompatibilities 0.65 (0.23–1.88) 0.43 HLA matching, n (%) 9–10/10 7–8/10 1.41 (0.34–5.92) 0.64 ≤6/10
留言 (0)