
記住我

This section presents a multipronged approach to the assessment of technology that builds on (1) conventional cost effectiveness and inclusive of patient-centeredness and equity (microeconomic and qualitative approaches combined), followed by (2) a macroeconomic analysis of the intervention’s impacts, and (3) a voting scheme consisting of a combination of the outputs of both (1) and (2) to create decision rules for the adoption of the intervention like the four quadrants of the cost-effectiveness plane (Fig. 1).
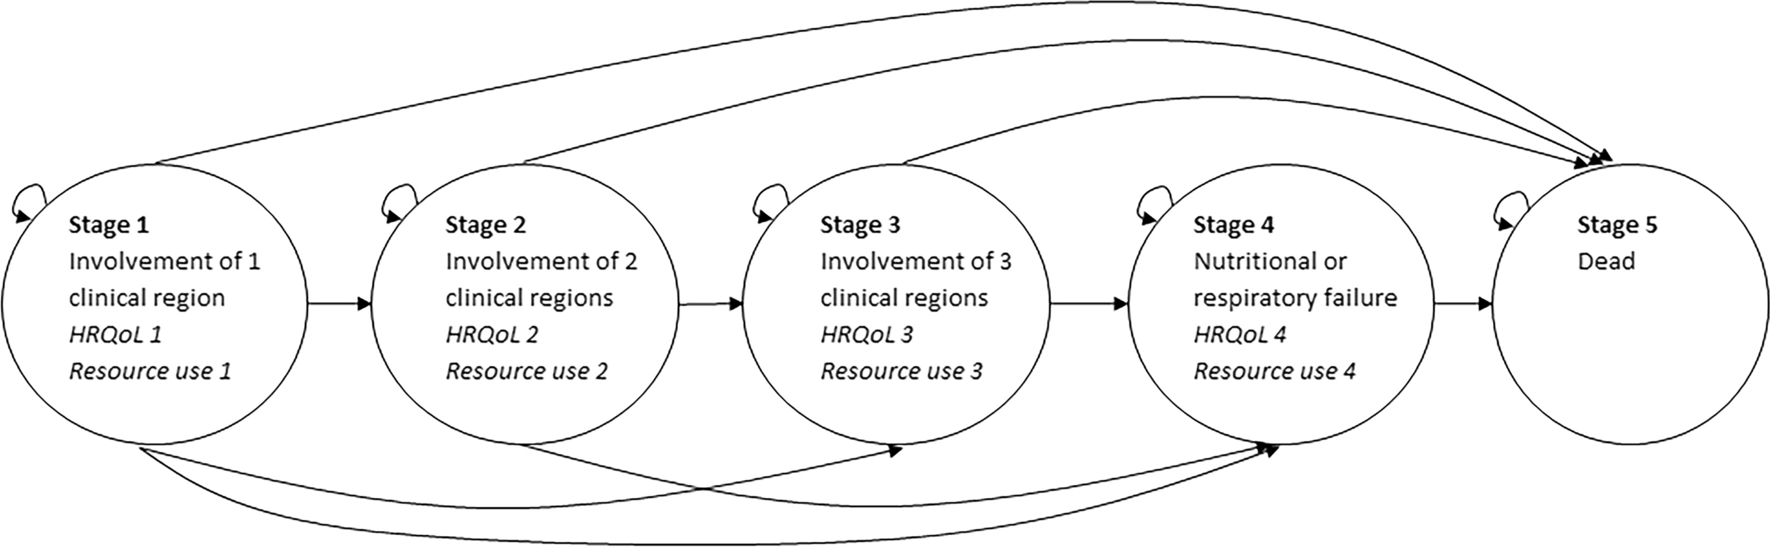
Fig. 1
Proposed conceptual framework
3.1 A Conventional Cost-Effectiveness Analysis Augmented with Patient Centricity and Equity: Distributional Cost-Effectiveness Analysis (DCEA)Distributional cost-effectiveness analysis (DCEA) enhances traditional cost-effectiveness analysis (CEA) by incorporating equity considerations, assessing how healthcare interventions impact different population subgroups and their distributional effects [22]. DCEA aims to uncover the effects of interventions on health inequalities, determining whether benefits are equitably distributed or exacerbate disparities. Implementing DCEA involves several steps, which are explained in detail elsewhere [23]. Briefly, we present steps conducive to a successful implementation.
Step 1: Defining the relevant groups of interest: This step starts with identifying relevant population groups by geography, age, or socioeconomic status [24], ensuring data availability for each. The disease’s prevalence or incidence in each group is then measured, followed by evaluating the intervention’s effectiveness in improving health outcomes, measured in quality-adjusted life-expectancy (QALE) for each subgroup.
Step 2: Establishing the baseline QALE: Establishing the baseline QALE for each socioeconomic group is the cornerstone of DCEA. This step involves collecting data on life expectancy and adjusting it for quality of life, typically derived from health surveys, life tables, and disease registries. The quality adjustment reflects the utility value of different health states, which can be gathered from the literature or through population surveys. Researchers must ensure the data are representative of the different predefined subgroups in Step 1 to accurately reflect the baseline health disparities. This step sets the stage for the analysis by providing a snapshot of the health status quo before any intervention (pre-intervention).
Step 3: Determining the average QALE: Determining the average QALE across groups is a critical step that sets the stage for identifying and quantifying health inequalities. The average QALE is calculated across all socioeconomic groups’ prespecified subgroups in Step 1 to establish the reference point against which disparities will be measured. This average serves as a benchmark to identify the extent of baseline inequalities in health outcomes.
Step 4: Applying the inequality aversion parameter (α): The inequality aversion parameter (α) is applied using an exponential function to the difference between individual QALEs and the average QALE [22]. This quantifies societal discomfort with inequality, where a higher exponential value indicates greater aversion, particularly for disadvantaged groups. This step requires an understanding of how to model preferences and may involve sensitivity analyses to explore how different values of α affect the results.
Step 5: Introducing the interventions: This step involves the application of health interventions to the model to evaluate their impact on QALE. For each socioeconomic group, we reassess QALE post-intervention. This requires detailed intervention data on effectiveness and utilization across different groups, often sourced from clinical trials, observational studies, and healthcare databases.
Step 6: Reassessing inequality with the Kolm Index: Post-intervention, inequality is reassessed using the Kolm Index, which accounts for absolute differences in health outcomes across groups. Calculating the Kolm Index post-intervention involves applying the α parameter to the differences in QALE post-intervention and the average QALE [22]. This index is particularly responsive to changes at the lower end of the health distribution, thus highlighting the intervention’s impact on the most disadvantaged groups.
Step 7: Computing the equally distributed equivalent (EDE) post-intervention: Finally, the EDE QALE post-intervention is calculated, which represents the average QALE that would result if the health gains observed were distributed equally across all socioeconomic groups. This step may utilize mathematical programming or simulation techniques to redistribute health gains and compute the EDE. It is a crucial step as it synthesizes the equity considerations into a single measure, allowing for a comparison of the equity impact of different health interventions.
Step 8: Uncertainty analysis: DCEA extends traditional CEA by incorporating differential effects of health interventions across socioeconomic strata. This methodology enables the quantification of an intervention’s influence on overall population health while simultaneously capturing its impact on health equity among distinct population groups. Central to DCEA is the assessment of uncertainty, which pertains to both the potential health benefits of an intervention and its effects on health inequality [33]. Addressing decision uncertainty is critical, as it informs the confidence in policy recommendations derived from DCEA outcomes. Two principal analytical methods are employed in this assessment: value of information (VOI) analysis and analysis of covariance (ANCOVA). VOI analysis quantifies the expected benefit of acquiring additional information, thus elucidating the value derived from mitigating uncertainty. This method aids in pinpointing where further research could yield significant impacts on policy direction, based on the existing evidence base. It provides a systematic approach to evaluating whether the potential reduction in uncertainty justifies the investment in additional data collection or research, particularly when an intervention shows promise but its distributional effects remain uncertain. ANCOVA complements VOI analysis by statistically parsing the factors contributing to outcome variability in a DCEA. Through this analysis, researchers can investigate how different covariates—such as baseline health conditions, adherence to treatment protocols, and differential effectiveness across demographic profiles—affect the cost effectiveness and equity dimensions of an intervention. This methodological approach is instrumental in identifying the sources of uncertainty and guiding subsequent research to areas that promise the greatest impact on policy decisions. The incorporation of uncertainty analysis into DCEA enhances the ability to inform HTA decisions that are both data-driven and ethically informed, ensuring that efforts to improve health outcomes are aligned with the goal of reducing disparities across socioeconomic groups.
Each parameter and step in this DCEA approach is critical to providing insight into both the effectiveness and equity of health interventions. The QALE offers a measure of the health benefits of interventions, while α and the Kolm Index bring the equity dimension into focus. Together, they facilitate a comprehensive assessment that informs which interventions can deliver the greatest health benefits across all societal groups equitably. As such, DCEA extends the focus of HTA to include patient-centered outcomes and equity considerations, addressing potential disparities in healthcare access and outcomes. However, it stops short of capturing broader societal impacts of health technologies. Thus, we recommend augmenting DCEA with macroeconomic analysis to explore the wider economic effects of healthcare interventions, providing a more complete assessment of their societal value.
3.2 Extended HTA Analysis with Input-Output Modeling3.2.1 Overview of the Input-Output ModelThe input-output model can be effectively utilized to assess the wide-ranging economic effects of healthcare interventions. The model, conceived by economist Wassily Leontief [25], is a practical tool for mapping out how different sectors of the economy interact with one another, showing us how the activities of the healthcare sector can have ripple effects throughout the economy.
Extended HTA analysis, augmented with input-output modeling, broadens the scope of traditional HTA by integrating techniques that quantify the wider economic impacts of healthcare interventions. This enhanced approach provides a thorough evaluation of secondary effects, including shifts in productivity, innovation, and social welfare. Originating from the work of economist Wassily Leontief [25], the input-output model serves as a valuable instrument for charting the intersectoral dynamics of the economy, highlighting the far-reaching impact that healthcare sector activities have beyond their direct environment.
At its core, the input-output model employs a matrix (input-output table) to manifest the transactions between sectors within the economy, painting a detailed picture of how expenditures and consumptions traverse through various industries. The input-output table is instrumental in visualizing the intersectoral flow of economic value, quantifying how healthcare investments can propagate through and impact the economy at large.
By embracing the linear relationships intrinsic to this model, we can project how changes within the healthcare sector influence the production functions of interconnected sectors. Although the model traditionally operates on the premise of fixed coefficients and an inexhaustible supply capability, assumptions that offer a degree of simplification, the analysis acknowledges and adjusts for these parameters to ensure nuanced and realistic estimations.
Furthermore, while the input-output model often considers a closed economy, the approach can expand this horizon to encapsulate the dynamism of global trade, thereby refining the understanding of healthcare interventions’ international repercussions, as needed.
This approach not only underscores the direct impact of healthcare interventions but also illuminates their extended influence on sectors seemingly remote from healthcare. It equips us with a quantitative foundation to argue for a more comprehensive appreciation of the healthcare sector’s contributions, advocating for policies that recognize and reward the full spectrum of impacts that healthcare interventions yield across the entire economy. The following subsections outline the steps necessary for the successful implementation of this approach.
Step 1: Choice of aggregation level: In an input-output model, aggregation analysis refers to the grouping of economic sectors and activities for analysis. This allows for a more manageable analysis, as many sectors can be consolidated into broader categories, rather than analyzing each sector individually. The aggregation level of the analysis depends on the research question being addressed, the availability of input-output tables and the data on the final demand, which is the spending component of the gross domestic product (GDP). Typically, input-output tables are created with data related to specific economic areas, which may be the national economy and also an economic region. One can construct a symmetric industry-by-industry input-output table (SIOT) from the ‘Make and Use’ tables in the ‘After Redefinition Tables’ of the Bureau of Economic Analysis (BEA) [26]. The latter reveals how products flow in the economy, from being sold (rows) to being purchased (columns). Each industry is identified using the North American Industry Classification System (NAICS) [27]. Such industries, which are directly relevant to the analysis, are identified based on their contribution to the economic activity under consideration. This may include industries involved in producing goods or services that impact the healthcare sector and disease state for which the intervention is devised.
Step 2: Analyzing the characteristics of a SIOT: The SIOT is divided into four sections, each serving a unique purpose (Online Resource 1 eTable 1). The top left section shows the exchange of materials and services between industries, known as intermediate inputs. It helps us understand how industries rely on one another. The bottom left section focuses on the value-added components within each industry. It reveals the portion of the final price generated within each industry, such as wages, profits, and taxes. The top right section represents the final demand. It captures the total amount of products and services consumed by households, businesses, and the government. The lower right section of the table is left empty as it is not used in this analysis for relevance purposes. In fact, the model is simplified to focus on the key sectors and flows of interest, leaving out parts of the matrix that do not contribute to the analysis at hand (Online Resurce 1 eTable 1).
Step 3: Calculating the Leontief inverse: Upon establishing the SIOT, we can calculate technical coefficients. These coefficients reflect the proportions of inputs utilized by various industries to generate their outputs, serving as a fundamental aspect of input-output analysis [28]. Unlike variable coefficients in other models, these coefficients are assumed to be constant and are organized into what is known as the direct coefficient matrix. This matrix forms the basis for analyzing the input-output relationships within the economy, following a specific production function termed the Leontief production function [29].
The Leontief production function is distinctive because it assumes fixed input ratios, simplifying the analysis of economic interdependencies. This function is operationalized by subtracting the technical coefficient matrix from an identity matrix, often referred to as the unity matrix. The identity matrix is characterized by ones on its main diagonal and zeros elsewhere, establishing a standard reference for matrix operations.
To assess the impact of a change or shock in a specific industry, economists employ multipliers. These multipliers are derived from the inverse of the matrix formed by the Leontief production function, known as the Leontief inverse. They are crucial in measuring the ripple effects of a change in one industry on the broader economy. By using these multipliers in specific equations, we can calculate the overall economic impact of various shocks or changes.
For instance, consider a scenario where there is an increase in demand in the automotive industry. The multipliers can help quantify how this demand increase affects not only the automotive supply chain but also other unrelated sectors and the economy at large. This ability to model economic interconnections is particularly valuable in scenarios and policy simulations [30].
Step 4: Applying the input-output model using simulation scenarios: Through input-output analysis, policymakers and analysts can simulate the effects of various interventions—such as drugs, adjustments in government policies, investment levels, or shifts in demand/supply patterns—to understand the net broader impacts on the economy. As a first step, the model simulates the economy’s baseline estimate using multiplier coefficients that connect economic variables. This baseline scenario represents the current economic situation without considering the intervention’s economic consequences. In the second step, the model creates an alternative scenario by introducing exogenous changes in the economic variables for the US economy over a specific period to explicitly reflect the impact of the intervention. By comparing the outputs of the control scenario with those of the simulation accounting for the exogenous changes, we can quantify the net economic impact. There could be more than one alternative scenario that reflects several interventions or policies that are envisioned to be assessed or analyzed.
Step 5: Uncertainty analysis: Given the assumptions and potential for incomplete data, uncertainty analysis is crucial for interpreting the input-output model results. It begins with identifying sources of uncertainty, such as the estimation of technical coefficients. Sensitivity analysis follows, pinpointing impactful variables. This consists of quantifying the identified sources of uncertainty using appropriate statistical methods. Moreover, VOI analysis can be utilized to gauge the potential advantages linked with diminishing parametric uncertainty [31].
The literature suggests several approaches to quantifying uncertainty in input-output modeling [32]. First, the deterministic error analysis sets boundaries for variables, exemplified by establishing limits on the costs of raw materials and the output of pharmaceutical products. This is complicated by the Leontief inversion, a non-linear mathematical process translating inputs into outputs. The econometric estimation of input-output coefficients then uses statistical methods to understand relationships within the economy. For instance, it might analyze how demand in the chemical industry affects pharmaceutical production, based on data from different business sectors. As for the error transmission method, it focuses on neutralizing random errors to improve result accuracy. This is illustrated by a pharmaceutical company predicting a 10% reduction in hospital admissions with a new drug. If the actual reduction is lower, the discrepancy, potentially caused by random factors like patient adherence, is analyzed to refine the drug’s economic impact assessment. Finally, the full probability density function approach aggregates data from various sources to create a more accurate overall picture, while the extended Monte Carlo simulations and Bayesian/Entropy methods are used for advanced equilibrium analysis and data treatment, enhancing model reliability. Additionally, scenario analysis can be conducted to explore different outcomes under varying conditions. The input-output model is iteratively refined with new data, with methods that are transparently documented, ensuring reproducibility.
3.3 Key Assumptions to Consider When Using DCEA and Input-OutputWhen employing DCEA, it is essential to underpin the analysis with several critical assumptions. These assumptions frame the interpretability and generalizability of the results. It is assumed that the QALYs gained from an intervention are comparable across different socioeconomic groups, which may not always reflect the complexity of real-world effectiveness [34]. This assumption of uniform QALYs valuation requires careful consideration, as the perception of health gains could be influenced by factors unique to each group [22]. Another key assumption is that the intervention’s cost effectiveness derived from trial or modeled data can be extrapolated to different population subgroups. This extrapolation assumes that the intervention’s relative effectiveness and resource utilization are constant, which may not hold true across diverse socioeconomic settings. Additionally, DCEA presupposes that the societal perspective for the value of reducing inequality, as expressed by the inequality aversion parameter (α), is accurately captured and constant. This parameter’s selection is subject to ethical considerations and may significantly influence the outcome of the analysis [35]. It is also crucial to acknowledge that the methods used to quantify health inequalities, such as the Kolm Index or the Concentration Index, are based on assumptions about the social welfare function and the distribution of health states within a population [36]. Lastly, when interpreting the results of a DCEA, it is typically assumed that policymakers will act rationally upon the evidence presented, incorporating both cost effectiveness and distributional impacts into their decision-making processes [37].
In employing an IO model for economic analysis, we must carefully consider the underlying assumptions that govern its framework. The model is predicated on the notion of linear relationships between inputs and outputs across different sectors. It assumes a proportional scale of production, where inputs and outputs increase or decrease in unison. While this linear perspective facilitates a straightforward computational approach, it may not encapsulate the complexities of real-world production where returns to scale can vary dramatically.
Furthermore, the input-output model is built on the assumption of fixed coefficients. These coefficients, which dictate the input needs per unit of output, are considered static. However, this assumption does not hold up well under the dynamic conditions of a real economy where technological advancements and shifts in relative prices can lead to substitutions among inputs, thus altering these coefficients over time.
Another critical assumption is the absence of supply constraints within the model. It posits that sectors have the unfettered capability to meet any level of demand. This ignores the finite nature of resources and the production ceilings imposed by factors such as limited natural resources or production capacity, which are very real challenges that industries face.
Lastly, the model, in its more rudimentary form, operates on the assumption of a closed economy. This means it does not account for the intricacies of international trade, which are integral to most modern economies. Although more sophisticated iterations of the model do consider trade, this simplification can lead to significant inaccuracies in economic analysis when using the basic version of the model.
These foundational assumptions are essential to the input-output model’s operation, yet they also delineate its limitations. Analysts must recognize and adjust for these limitations when applying the model to real-world economic situations, to ensure that the insights derived are both relevant and robust.
3.4 Decision Rules Through Voting SchemeA voting scheme is established to guide the adoption of interventions. It delineates four distinct quadrants, each representing different combinations of net health benefits and net broader impacts (Fig. 2). Quadrant I embodies the epitome of an ideal choice, where interventions not only yield positive augmented net health benefits but also generate extensive net broader impacts. These interventions, characterized by their ability to provide the highest value for money, are actively sought after by organizations and individuals striving to maximize the impact of their allocated resources. Transitioning to quadrant II, we encounter interventions that manifest positive augmented net health benefits but are accompanied by a negative net broader impact. The pursuit of options in this quadrant is warranted when the augmented net health benefits outweigh the negative broader impacts, thereby justifying the investment in the intervention. While acknowledging the existence of some unfavorable consequences, the overall positive health outcomes make this quadrant a viable and prudent choice. Conversely, quadrant III encompasses interventions that exhibit both a negative augmented net health benefit and a negative net broader impact. As such, these interventions are deemed inadequate choices, as they engender detrimental outcomes. To ensure optimal decision making, options within this quadrant should be unequivocally rejected due to their deleterious effects. Lastly, quadrant IV comprises interventions with a negative augmented net health benefit but a positive net broader impact. In certain circumstances, organizations or individuals may opt to pursue options within this quadrant when the positive societal impacts outweigh the negative augmented net health benefits. Consequently, the investment in such interventions can be deemed justified, despite their inability to directly enhance health outcomes.
Fig. 2
Health technology assessment decision quadrants
The voting scheme is designed to integrate multiple stakeholders’ perspectives, including patients, healthcare providers, policymakers, researchers, advocacy groups, payors, and community representatives, ensuring a balanced and inclusive approach to decision making. This integration occurs through a structured voting process where each stakeholder group is given a platform to express their priorities and concerns regarding the interventions under consideration.
Patients provide insights based on their personal experiences and preferences, highlighting the direct impact of interventions on their health and well-being. Healthcare providers, such as doctors and nurses, offer a clinical perspective, evaluating the interventions’ efficacy, safety, and feasibility within the healthcare system. Policymakers consider the broader societal impacts, including economic, ethical, and social implications, ensuring that interventions align with public health goals and resource allocation principles. Stakeholders cast their votes for or against the adoption of interventions, with the results aggregated to identify the options with the broadest impact.
To reconcile differences and reach a consensus, the scheme may employ weighting systems, negotiation rounds, or expert panels to further deliberate on contentious issues. This multifaceted approach facilitates a democratic and transparent decision making process, where the diverse values and priorities of the community are reflected in the final choices [38].
A detailed step-by-step explanation of the proposed voting scheme, integrating elements of decision conferencing [38] for a compelling and inclusive approach to decision making, is as follows:
Step 1: Stakeholder identification and engagement: The first step involves identifying key stakeholders, including patients, healthcare providers, policymakers, researchers, industry representatives, advocacy groups, payors, and community leaders. Each stakeholder group brings a unique perspective and expertise to the decision-making process.
Step 2: Preparation and information sharing: Prior to voting, stakeholders are provided with comprehensive information about the healthcare interventions under consideration. This includes evidence-based data on efficacy, safety, cost effectiveness, and potential societal impacts. Decision conferencing techniques are employed to facilitate constructive dialogue and knowledge exchange among stakeholders.
Step 3: Voting process: Stakeholders are presented with a set of options for each healthcare intervention, ranging from adoption to rejection. They cast their votes based on their assessment of the options, taking into account their respective interests and expertise. Votes are submitted anonymously to encourage candid and unbiased decision making.
Step 4: Aggregation and analysis of results: Once all votes are collected, they are aggregated and analyzed to determine the level of support for each option. This involves tallying the votes and identifying patterns or trends across stakeholder groups. Decision conferencing tools such as visualizations and simulations may be used to facilitate data interpretation.
Step 5: Reconciliation and consensus building: In cases where differences in opinion arise, the voting scheme employs reconciliation mechanisms to facilitate consensus building. This may include weighting systems to account for the relative importance of stakeholder perspectives, negotiation rounds to address conflicting viewpoints, or expert panels to provide additional insights and recommendations.
Step 6: Final decision and implementation: After thorough deliberation and consensus building, a final decision is reached regarding the adoption of healthcare interventions. The decision reflects the collective wisdom and input of all stakeholders involved. Implementation plans are developed to ensure effective execution of the chosen interventions, with ongoing monitoring and evaluation to assess their impact over time
留言 (0)