
記住我


Osteochondral lesions of the talus (OLT) are lesions of the articular cartilage and the underlying subchondral bone. Symptomatic OLT typically result in pain and can be debilitating for patients, especially for those involved in physical activities and sports. Up to 75% of OLT are the sequelae of trauma, such as a sprain or fracture, and the lesions may initiate the cascade toward end-stage ankle osteoarthritis1–3.
Nonoperative treatment is the first-line treatment for OLT, but it fails in up to 55% of patients, meaning that the majority of patients require surgical treatment4,5. In smaller (<150 mm2) primary lesions, the preferred surgical treatment for OLT to date is arthroscopic bone marrow stimulation (BMS)6,7. The advantages of arthroscopic BMS over other treatments are its relative minimal invasiveness, low cost, technical feasibility, and wider availability in less-resourced health-care systems7,8. Moreover, arthroscopic BMS has shown good and reliable results up to mid-term follow-up9,10. There is a concern in the literature, however, that clinical results may deteriorate and/or ankle osteoarthritis may progress over time because biomechanically inferior fibrocartilage is formed after BMS10–14. This may result in recurrent symptoms and the need for subsequent revision surgery15.
The current literature on long-term outcomes following BMS for OLT can be considered limited11. As such, the long-term sustainability of BMS for OLT, with a specific focus on survival outcomes, is understudied and there is sparse evidence on baseline patient and lesion factors that may influence long-term survival free from revision11. The primary aim of the present study was therefore to assess the 10-year survival following arthroscopic BMS for OLT. The secondary aims were to evaluate the median time to revision and the influence of baseline patient and lesion characteristics on survival. These outcomes are of critical importance for patients and physicians during patient counseling and shared decision-making, and could aid in optimizing patient outcomes7,16.
Materials and MethodsThis was a single-center retrospective cohort study. Our institution is an academic tertiary referral hospital that specializes and is (inter)nationally accredited in the treatment of ankle cartilage injuries. This study was approved by the institutional review board (MEC 08/326) and performed in accordance with the Declaration of Helsinki.
Patient SelectionAll patients who underwent arthroscopic BMS for a symptomatic OLT and had a minimum of 10 years of follow-up (i.e., were treated before January 2013) were eligible for inclusion. BMS was defined as arthroscopic debridement with or without microfracture. Patients who underwent treatment had a symptomatic OLT with pain and/or associated clinical symptoms (swelling, locking, etc.) and failure of initial nonoperative management8. BMS was performed in accordance with previously published techniques17,18. Patients were identified, according to the inclusion and exclusion criteria, from an existing historical database of patients with a computed tomography (CT)-confirmed OLT19. After patients were identified, they were contacted by phone for their participation in the study. If patients could not be reached by phone, 2 subsequent emails and/or letters were sent. If no response was received or if the patient had died, they were considered lost to follow-up (i.e., nonresponders). The exclusion criteria are outlined in Table I.
TABLE I. - Exclusion Criteria Revision surgery due to postoperative infection related to the index procedure, requiring surgical debridement of the ankle No preoperative CT scan or MRI available Coexisting osteochondral lesion of the tibial plafond (OLTP) on preoperative CT or MRI Preoperative advanced tibiotalar joint osteoarthritis, defined as severe joint-space narrowing or Kellgren-Lawrence grade ≥3 Objection to study participationThe primary outcome of this study was the 10-year cumulative survival rate, defined as the proportion of ankles that had not undergone revision surgery at 10 years after the index procedure. The index procedure in patients with multiple arthroscopic BMS procedures was defined as the procedure that had the longest follow-up at our institution. Revision surgery was defined in accordance with the definition established by the International Consensus Meeting on Cartilage Repair of the Ankle15. More specifically, the present study defined revision surgery as any surgical procedure for a recurrent OLT after the index procedure, according to the OLT treatment categories defined by Dahmen et al.6, or tibiotalar joint arthrodesis, total ankle replacement, amputation, or ankle realignment surgery.
The secondary outcomes of this study were the time to revision, 15 and 20-year revision rates, and associations of predictive baseline patient and lesion factors with revision surgery. According to the statistical principles of survival analysis, a 10:1 ratio of the number of failures to the number of predictive baseline factors was considered acceptable20. Therefore, before the start of the study, a hierarchy of possible dichotomous predictive factors was defined according to the current evidence-based literature21–28 in order to determine which factors were to be analyzed. The following hierarchy was established: (1) lesion size (≤100 versus >100 mm2), (2) a primary versus non-primary lesion (i.e., following failed primary surgery), (3) the presence versus absence of subchondral cysts on preoperative imaging, (4) a body mass index (BMI) of ≥30 versus <30 kg/m2, and (5) sex.
Data CollectionBaseline patient, lesion, and treatment characteristics were collected from the patient electronic health records. Patient characteristics included sex, age at the time of surgery, BMI, laterality, etiology (traumatic or non-traumatic), the presence of ankle instability (defined as patient-reported recurrent spraining and/or subjective ankle instability, laxity during physical examination, or as concluded by the physician in the clinical report19), and previous ankle surgeries. Lesion characteristics included primary or non-primary lesion type as well as radiographic characteristics. Treatment characteristics included follow-up time (in years), lesion debridement with or without microfracture, anterior or posterior arthroscopy, and any concomitant procedures.
Outcome measures were collected from the patient electronic health records as well as by phone interview to confirm whether patients had or had not undergone revision surgery. If a revision surgery had been performed, the following data were collected: type of revision surgery (according to the previously described categorization of surgical procedures for the OLT), revision surgery date, and reason for revision surgery.
Radiographic EvaluationPreoperative lesion characteristics were collected by 2 independent raters (Q.G.H.R. and M.B.A.) on CT scans (n= 254). If no preoperative CT scan was available, magnetic resonance imaging (MRI) was utilized (n = 8). The following lesion characteristics were collected: lesion size (anterior-posterior and medial-lateral directions as well as depth) measured in millimeters and converted to the area as described by Choi et al.29 and to the volume as described by Angthong et al.30, dominant lesion morphology as described by Rikken et al.19, the presence of cysts, and the location according to a 9-gird scheme31. A consensus meeting was held in case of disagreement on the lesion characteristics between the 2 raters, and if no agreement could be achieved, a third rater (J.D.) made the decision.
Statistical AnalysisData analyses were conducted using Stata (version 15; StataCorp). A 2-sided p value of <0.05 was considered significant. Baseline dichotomous and categorical data are reported as counts with percentages, and continuous data are reported as means with standard deviations. Data were visually assessed for normality using histograms. The primary outcome, namely the cumulative 10-year survival rate, was analyzed by means of the Kaplan-Meier survival method and reported with the 95% confidence interval (CI). Patients who were lost to follow-up were censored for the primary outcome at the time of their latest follow-up visit. No power analysis was performed for the primary outcome, as this study involved an observational outcome in a single cohort. The median time to revision surgery was calculated along with the interquartile range (IQR). The effects of baseline predictive factors on survival were determined using univariate Cox regression analysis and reported as hazard ratios (HRs) with 95% CIs. All variables that were significantly associated with revision in the univariate analyses (at an adjusted significance level of 0.1) were entered into a multivariable Cox regression model. Backward selection was used to identify the factors that remained predictive of revision (at a significance level of 0.05). Multiple imputation was performed for missing data (BMI for 74 ankles [28%] and lesion size for 1 ankle [0.4%]), under the assumption that data were missing at random. All model variables and 2 auxiliary variables (age, sex) were used for imputation of the missing data. Five data sets were created, and pooling of the outcome was performed according to the Rubin rules32. A sensitivity analysis was also performed by means of complete-case analysis. A description of further subanalyses as well as interrater and intrarater reliability measurements are provided in Appendix Supplementary Materials 1.
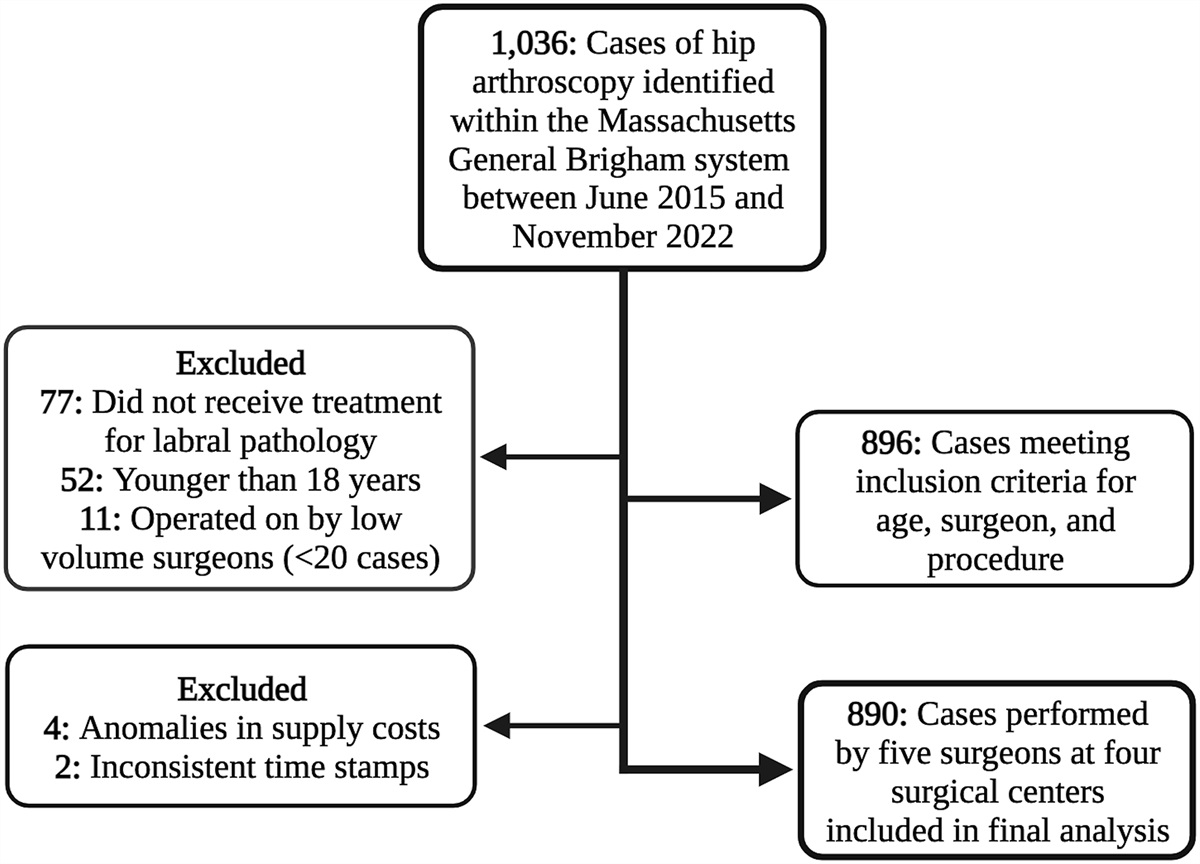
ResultsAt the time of final follow-up, at a mean of 15.3 ± 4.8 years postoperatively, 262 cases were eligible for inclusion; the patient was reached in 217, and the other 45 were censored at a mean of 1.8 ± 3.4 years (Fig. 1). One patient had a bilaterally treated OLT (i.e., 2 cases). An overview of the baseline patient, treatment, and lesion characteristics is shown in Table II. There were no significant differences in baseline characteristics between the patients who were reached and those who were censored, except for a longer follow-up time for censored patients (i.e., nonresponders). The outcomes of the interrater and intrarater reliability measurements are shown in Appendix Supplementary Materials 2.
 Figure 1:
 Flowchart of patient selection. OLTP = osteochondral lesion of the tibial plafond, and OA = osteoarthritis.
TABLE II. - Baseline Patient, Treatment, and Lesion Characteristics* All Cases (N = 262) Responders (N = 217) Nonresponders (N = 45) P Value Value % with Data Value % with Data Value % with Data Sex: male 162 (62%) 100 130 (60%) 100 32 (71%) 100 0.2 Age (yr) 32.3 ± 11.7 100 32.1 ± 11.6 100 33.0 ± 12.2 100 0.8 Time to event†(yr) 10.9 ± 7.3 100 12.8 ± 6.4 100 1.8 ± 3.4 100 NA Follow-up time‡(yr) 15.3 ± 4.8 100 14.9 ± 4.6 100 17.1 ± 5.3 47 <0.01 BMI (kg/m 2 ) 25.7 ± 4.4 72 25.5 ± 4.2 77 26.8 ± 5.5 100 0.2 Laterality: right 137 (52%)§ 100 113 (52%) 100 24 (53%) 100 0.9 Lesion etiology 93 93 93 0.8 Non-traumatic 64 (26%) 53 (26%) 11 (26%) Traumatic 180 (74%) 149 (74%) 31 (74%) 0.1 Ankle instability 50 (20%) 93 40 (20%) 94 10 (25%) 89 Treatment characteristics Arthroscopic approach 97 97 98 0.8 Anterior 197 (77%) 162 (77%) 35 (80%) Posterior 58 (23%) 49 (23%) 9 (20%) Microfracture 99 99 98 0.5 Debridement only 35 (13%) 31 (14%) 4 (9%) Debridement with microfracture 225 (87%) 185 (86%) 40 (91%) Concomitant surgery# 100 100 100 0.1 No. of ankles 107 (41%) 84 (39%) 23 (51%) Total no. of procedures 129 99 30 Resection of osseous impingement 55(43%) 41 (41%) 14 (47%) Resection of soft-tissue impingement 13 (10%) 11 (11%) 2 (7%) Removal of loose body 39 (30%) 32 (32%) 7 (23%) FHL release 11 (9%) 7 (7%) 4 (13%) Resection of os trigonum 8 (6%) 6 (6%) 2 (7%) ATFL/capsular shrinkage 3 (2%) 2 (2%) 1 (3%) Lesion characteristics Primary lesion 212 (81%) 100 173 (80%) 100 39 (87%) 100 0.4 Presence of cyst 139 (53%) 100 113 (52%) 100 26 (58%) 100 0.5 Lesion morphology 100 100 100 0.6 Cyst 127 (48%) 102 (47%) 25 (56%) Crater 85 (32%) 73 (34%) 12 (27%) Fragment 50 (19%) 42 (19%) 8 (18%) Lesion location 100 100 100 0.4 Zone 1 19 (7%) 16 (7%) 3 (7%) Zone 2 1 (0.4%) 1 (0.4%) 0 (0%) Zone 3 10 (4%) 7 (3%) 3 (7%) Zone 4 87 (33%) 75 (35%) 12 (27%) Zone 5 4 (2%) 3 (1%) 1 (2%) Zone 6 29 (11%) 23 (11%) 6 (13%) Zone 7 63 (24%) 52 (24%) 11 (24%) Zone 8 6 (2%) 3 (1%) 3 (7%) Zone 9 43 (16%) 37 (17%) 6 (13%) Lesion size (mm) Anterior-posterior 10.7 ± 4.0 99 10.8 ± 4.0 99 10.4 ± 4.6 100 0.5 Medial-lateral 7.8 ± 3.3 100 7.8 ± 3.2 100 7.7 ± 3.4 100 0.5 Depth 6.5 ± 2.9 100 6.5 ± 3.0 100 6.2 ± 2.5 100 0.5 Lesion area (mm 2 ) 73.1 ± 49.8 99 73.4 ± 49.8 99 71.8 ± 64.8 100 0.4 Lesion volume (mm 3 ) 367.8 ± 385.5 99 369.4 ± 357.9 99 360.0 ± 502.1 100 0.4*The values are given as the mean ± standard deviation or as the count with the percentage in parentheses. All percentages are of the number of cases with available data for the variable except for the individual concomitant procedures, which are of the total number of concomitant procedures. NA = not applicable, FHL = flexor hallucis longus, ATFL = anterior tibiofibular ligament.
†The time to event is the time from the index surgery to censoring (i.e., including the observation time with or without loss to follow-up) or to revision surgery.
‡The follow-up time is from the index procedure to the time of inclusion.
§1 case had bilaterally treated OLT.
#This is the total number of procedures; a patient may have had >1 concomitant procedure.
The 10-year cumulative survival rate of arthroscopic BMS in the 262 cases available in this cohort was 82.3% (95% CI: 76.6% to 86.7%). The Kaplan-Meier survival curve is shown in Figure 2. The median time to revision was 2.4 years (IQR: 1.3 to 5.1 years). A subanalysis revealed no significant differences in baseline patient and lesion characteristics between patients who underwent revision early (<2.5 years of follow-up) or late (>2.5 years of follow-up) revision (see Appendix Supplementary Materials 3).
 Figure 2:
 Kaplan-Meier survival curve at up to 10 years of follow-up. The survival rate is shown using a y axis from 70% to 100%; shading represents the 95% CI. The number of patients at risk and the cumulative number of events at each given time are listed below.
At 15 and 20 years of follow-up, the cumulative survival rate was 81.6% (95% CI: 75.8% to 86.1%, n = 62) and 77.7% (95% CI: 68.5% to 84.0%, n = 33), respectively.
Baseline Factors and Survival OutcomesAs 44 events occurred in the study population, 4 of the 5 predetermined baseline factors (selected according to the prospectively established hierarchy) were analyzed for their association with survival. Table III shows the hazard ratio for each variable. The Kaplan-Meier curves for all variables are shown in Appendix Supplementary Materials 4.
TABLE III. - Cox Regression Analysis of Baseline Factors Associated with Failure* Analysis and Variable HR (95% CI) P Value Univariate Lesion size ≤100 mm2 Reference >100 mm2 0.93 (0.47-1.83) 0.82 Lesion type Primary Reference Non-primary 1.78 (0.93-3.41) 0.08 Presence of cyst No Reference Yes 1.02 (0.57-1.85) 0.94 BMI <30 kg/m2 Reference ≥30 kg/m2 3.04 (1.44-6.43) <0.01 Sex† Male Reference Female 0.60 (0.33-1.08) 0.09* Multivariable Lesion type Primary Reference Non-primary 1.57 (0.83-3.03) 0.18 BMI <30 kg/m2 Reference ≥30 kg/m2 2.82 (1.30-6.1) 0.01 Final model BMI <30 kg/m2 Reference ≥30 kg/m2 3.04 (1.44-6.43) <0.01*After multiple imputation. HR = hazard ratio, CI = confidence interval.
†Sex was not included in the formal analysis because of underpowering, as described in the Materials and Methods section. However, it is shown here to support the secondary analysis and should be interpreted as such.
A baseline BMI of ≥30 kg/m2 was significantly associated with a higher likelihood of revision following BMS (HR: 3.0 [95% CI: 1.44 to 6.43], p < 0.01) (Fig. 3.) A comparison of baseline characteristics is shown in Appendix Supplementary Materials 5.
 Figure 3:
 Kaplan-Meier survival curve comparing the survival of patients with and without obesity. The survival rate is shown using a y axis from 40% to 100%; shading represents the 95% CI. The number of patients at risk and the cumulative number of events at each given time are listed below for each group.
The complete-case analysis, which is shown in Appendix Supplementary Materials 6, found results comparable to those of the primary analysis.
DiscussionThe most important finding of this study is that 82% of ankles that underwent arthroscopic BMS procedures for an OLT remained free from revision at 10 years of follow-up. At 15 and 20 years of follow-up, the cumulative survival rate was 82% and 78%, respectively. Furthermore, this study found that obesity (BMI ≥ 30 kg/m2) may be associated with a higher likelihood of revision surgery.
Survival in orthopaedics is a dynamic outcome that incorporates functional outcomes, pain, complications, return to sports and work, and mental aspects, as well as a patient’s experience and expectations16,33,34. Outcomes in 1 or more of these domains must reasonably be below the level of satisfaction in order for a patient to consider revision surgery. In contrast to arthroplasty studies, few studies to date have specifically focused on survival outcomes in joint preservation surgery for osteochondral lesions of the ankle22,35,36. This study sought to evaluate the long-term clinical survival after arthroscopic BMS for OLT and observed a high rate of survival that was sustained over time. When comparing the outcomes of this study with the literature, it should be noted that a limited number of studies on the long-term outcomes following BMS for OLT have been published, with even fewer assessing its survival11,13,22,37–40. A recent systematic review found an overall survival rate of 93% in 317 ankles from 5 studies with long-term outcomes
留言 (0)