
記住我
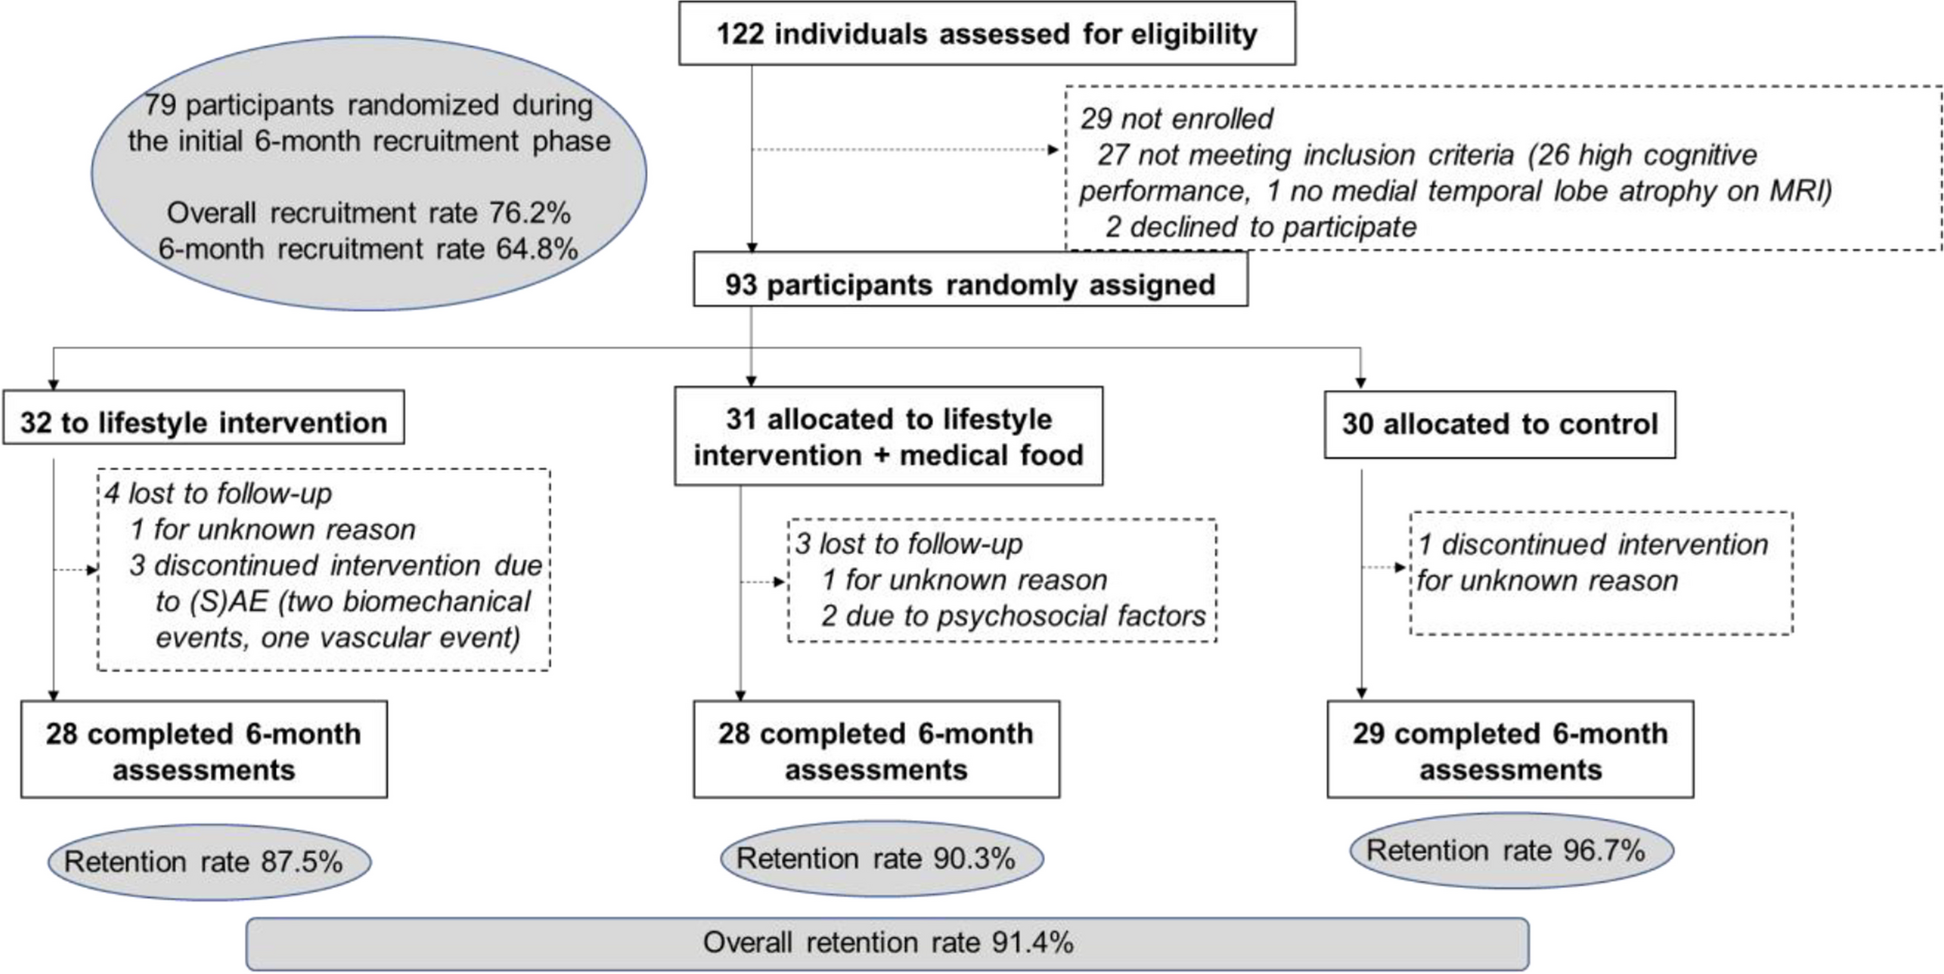


Figure 1 illustrates the study design of the present work. Two independent raters (AA and IL, both neurologists with 25 and 4 years of expertise in neurodegenerative disorders, respectively) blindly assessed the anonymized clinical reports of patients for whom plasma biomarkers were available at three time points.
Fig. 1
Study design. Two raters assessed the clinical reports of the patients at different time points: at T0, based on the clinical first-visit reports; at T1, based also on the plasma biomarker results; and at T2, based also on traditional biomarkers (when available). At each time point, raters were asked to indicate diagnosis and rate their diagnostic confidence (50–100%) in such diagnosis for each patient. Traditional biomarkers included cerebrospinal fluid analyses (CSF Aβ42, p-tau, and total tau), amyloid-PET scan, and genetic assessment
At T0 (baseline), the two raters assessed the clinical reports including all the information collected during the first visit at our center, and were asked to indicate a cognitive stage (i.e., mild cognitive impairment (MCI) or dementia) and diagnosis (i.e., AD, bvFTD, PPA, CBS/PSP), and to rate their diagnostic confidence (50–100%) in such diagnosis. Specifically, the first-visit clinical reports included the patient’s demographics, past and present comorbidities, family history, description of the first symptoms at onset, global cognitive assessment, associated behavioral symptoms, and structural brain imaging in most cases. At T1, the two raters were asked to revise the baseline diagnosis and diagnostic confidence for each patient based on the plasma biomarker results. Specifically, raters had access to and interpreted the values of all available plasma biomarkers at the same time, together with a panel describing values (minimum, median and IQR, mean and SD, and maximum value as well as the distribution; see section e2.1, eTable, and eFigure in Supplement) of a sample of 27 cognitively unimpaired individuals (median ± IQR age: 48 ± 26 years; gender: 44% (12/27) of males) as a reference. Importantly, we did not provide thresholds defining positivity/negativity of the plasma biomarkers (but only the raw values to be interpreted comprehensively based on the values of cognitively unimpaired individuals). More information on material and preparatory activities is reported in section e2.1 in Supplement. Finally, at T2, the two raters were asked to revise diagnosis and diagnostic confidence based on the results of traditional exams such as CSF analyses, amyloid-PET scan, or genetic investigation. When the two raters were not concordant, a third rater (BB) was asked to assess these cases at all time points.
Finally, in order to assess whether raters’ interpretation of plasma biomarkers and the consequent clinical impact (i.e., changes in diagnosis and diagnostic confidence) were appropriate, we used (as the gold standard) the final diagnosis provided by the dementia experts who had the patients in charge and complete access to all available information such as the clinical and instrumental work-up (see "Participants" section). The final diagnosis was commonly achieved approximately 4 months after the first visit.
ParticipantsThe reports of 146 outpatients with cognitive impairment evaluated at the Neurology Unit of the University of Brescia and the ASST Spedali Civili (Brescia, Italy), for whom plasma biomarkers were quantified, were initially considered in the present study. Among them, 24 have been excluded (23 were not informative enough or inconclusive at the first visit report, and 1 was recognized by one rater despite anonymization), for a total of 122 reports included in the analyses. Final diagnosis was consistent with either AD, bvFTD, PPA, CBS, or PSP, according to conventional clinical criteria [16,17,18,19,20,21,22,23]. All included patients underwent a standardized neuropsychological evaluation and brain magnetic resonance imaging (MRI), as previously reported [24]. Furthermore, CSF analyses (i.e., Aβ42, p-tau, and t-tau) and amyloid PET scan were available in 57% (70/122) and 19% (23/122) of cases, respectively, to support or rule-out AD. Proof of pathogenetic mutations was available in 18% (22/122) of cases, supporting definitive diagnosis of FTD (C9orf72 expansion, n = 6; Granulin mutations, n = 13; Microtuble-Associated Protein Tau mutations, n = 2; and TAR DNA-binding protein 43 mutation, n = 1).
The study was approved by the local Ethic Committee (NP1965), and has been conducted in accordance with the principles of the Declaration of Helsinki and the International Conference on Harmonization Good Clinical Practice.
OutcomesThe two primary outcomes were change in diagnosis and change in diagnostic confidence across time points in the whole sample. The diagnoses were categorized into three categories: (i) “AD”, including all the diagnoses involving AD; (ii) “FTD”, including bvFTD and PPA; and (iii) “CBS/PSP” including CBS and PSP. Diagnostic confidence was rated by ticking the percentage corresponding to their appraisal of the diagnostic confidence on a visual numeric scale made of percentages organized spatially from 50 to 100% with incremental 5%-intervals. Before the beginning of the study, the study team (including the raters) defined the following criteria to objectivize, as much as possible, the subjective nature of diagnostic confidence: (i) 50% corresponds to max uncertainty, (ii) 90% defines a “very high” diagnostic confidence as operationalized by previous studies [25], and consistently with previous studies showing that the etiological diagnosis of patients with a diagnostic confidence greater than 90% does not change following amyloid-PET [26], and that the maximal mean diagnostic confidence post amyloid-PET is 86–93% [27,28,29,30], suggesting that this level of diagnostic confidence is a strong, achievable, and replicable reference standard; and (iii) 100% corresponds to max certainty. For the analyses, we considered the diagnosis expressed in agreement by two concordant raters (i.e., the first two raters or, when they were discordant, one of them and the third one), and the average of their diagnostic confidence only for patients with a diagnosis confirmed across different time points.
Assessment of plasma biomarkersPlasma was collected at the first visit by venipuncture, processed and stored in aliquots at -80°C according to standardized procedures, and analyzed in a central laboratory. Specifically, plasma p-tau181 and p-tau231were analyzed using an in-house single-molecule array (Simoa) method developed at the University of Gothenburg [9, 10]. Aβ42/Aβ40, NfL, and GFAP were analyzed using a commercial Simoa multiplex assay [31,32,33]. Plasma samples were thawed, vortexed, and centrifuged (4000 × g for 10 min at RT), then analyzed by a HD-X analyzer using identical batches of reagents across the study. Three quality control plasma samples were added in duplicate to the test plates at the start and end of each run, resulting in an overall coefficient of variation of 4.9% to 12.5% across all the plasma marker measurements.
Statistical analysesContinuous variables were described as median and interquartile range (IQR), and categorical variables as percentages (raw numbers). Differences among groups in the sociodemographic and clinical features were assessed using Kruskal–Wallis rank sum tests for continuous variables, or tests for equality of proportions for categorical variables. If significant, post-hoc pairwise comparisons (Dunn’s all-pairs rank comparison test for continuous variables, or pairwise comparisons for categorical variables) were adjusted using Bonferroni correction.
The inter-rater agreement between the two raters (AA and IL) for the clustered diagnoses (AD and FTLD) at the different time points was assessed using the unweighted Cohen’s k coefficient, and strength of agreement classified as slight (0.00 – 0.20), fair (0.20 – 0.40), moderate (0.40 – 0.60), good (0.60 – 0.80), and very good (> 0.80), with 95% confidence intervals (CI).
Changes in diagnosis (from AD to FTLD) after plasma biomarkers were assessed using the McNemar's Chi-squared test (χ2). Changes in diagnostic confidence in patients with confirmed diagnosis across timepoints were assessed using a linear mixed model with diagnostic confidence as the dependent variable; diagnosis (AD, FTD, or CBS/PSP), time point (T0, T1, and T2), and their interaction as independent variables; and random intercepts and slopes at the subject level.
All statistical analyses were performed with R, version 4.3.0 (The R Project for Statistical Computing, https://www.r-project.org/).
留言 (0)