
記住我


The experimental animals used were 20, 5-week-old, male Wistar rats (n = 5 in each group), weighing approximately 140 g. These rats were randomly allocated to one of two groups, a control unloaded group, in which no superstructure was fitted after implant placement and no load was applied (n = 10), and a loaded group, in which a superstructure was fitted after implant placement and an immediate load was applied (n = 10).
The rats were then kept under normal conditions until either Day 7 or Day 21, when they were euthanized, and their maxillae were harvested (Fig. 1). This animal experiment was conducted with the approval of the Tokyo Dental College Animal Experiment Committee (approval no. 223,302).
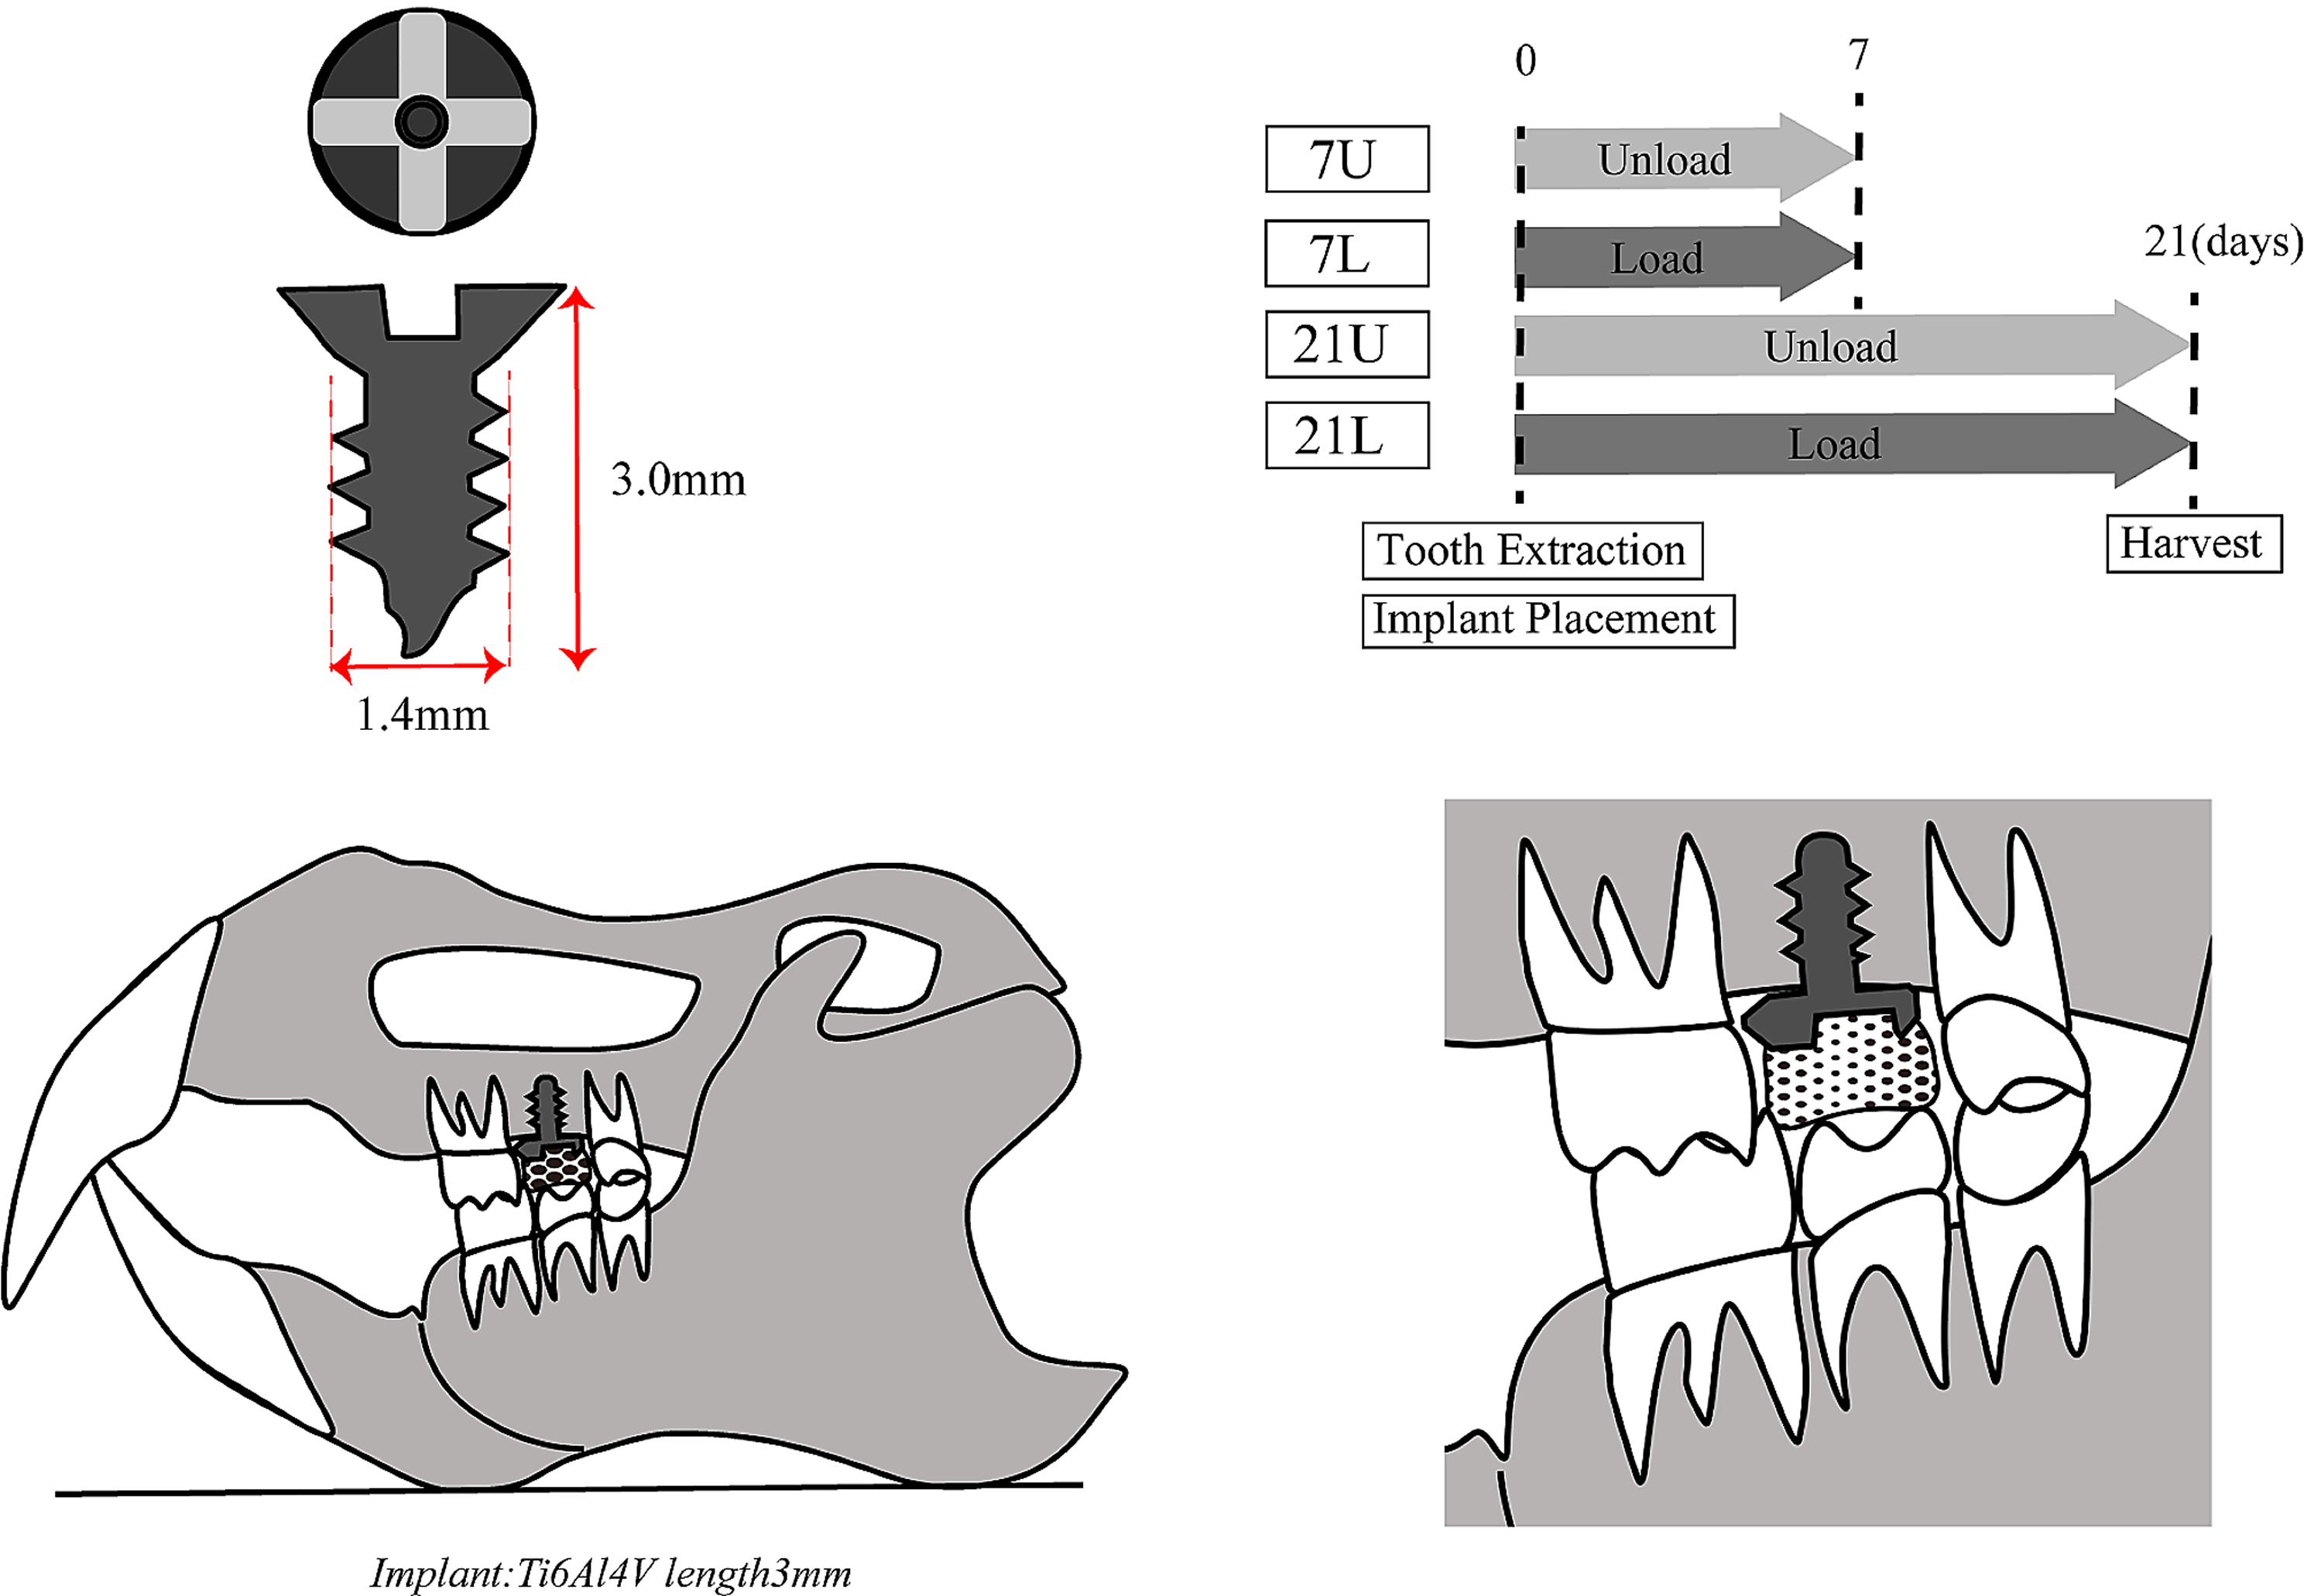
Fig. 1
Experimental design. Implant details and placement location and experimental schedule
Implant surgeryThe implant placement procedure was conducted under general anesthesia induced by the intraperitoneal administration of a combination of three anesthetics (medetomidine hydrochloride 0.375 mg/kg, Nippon Zenyaku Kogyo Co., Ltd., Fukushima, Japan; midazolam 2.0 mg/kg, Sandoz K.K., Tokyo, Japan; and butorphanol tartrate 2.5 mg/kg Meiji Seika Pharma Co., Ltd., Tokyo, Japan). The occlusal status prior to extraction was confirmed by taking an impression with articulating paper. A probe was then used to extract the maxillary right second molar. A titanium alloy implant (Ti-6AL–4 V, length 3 mm, diameter 1.4 mm, and 700 μm and 400 μm thread pitch and height, Pro-seed Corporation, Tokyo, Japan) was placed in the extraction cavity by using a special screwdriver to achieve initial fixation with torque of at least 2 Ncm. Torque was confirmed to be at least 2 Ncm using a torque screwdriver (Nakamura Mfg. Co., Ltd., Tokyo, Japan). The implant head was positioned above the gingival margin to avoid direct occlusal loading and to avoid contact with adjacent teeth (Figs. 1 and 2a).
Fig. 2
Intraoral findings and micro-CT images. (a) The maxillary right second molar is extracted, and a Ti-6A1-4 V implant (length 3 mm, diameter 1.4 mm, and 700 μm and 400 μm thread pitch and height) is placed. (b) After implant placement, the superstructure is built up with layers of resin until it touches the corresponding tooth in the lower jaw, an impression is taken with dental articulating paper, and this is compared with the pre-extraction impression to confirm the occlusal load. (c) Representative micro-CT image of Day 7. (d) Representative micro-CT image of Day 21
Resin (Sun Medical Co., Ltd., Shiga, Japan) was then used to create a superstructure.
The superstructure was gradually built up with layers of resin until it touched the corresponding tooth in the lower jaw, an impression was taken with dental articulating paper (Senjo Co., Ltd., Osaka, Japan), and this was compared with the pre-extraction impression to confirm the occlusal load (Figs. 1 and 2b). The superstructure was verified using dental floss (Ci Medical Co., Ltd., Ishikawa, Japan) to ensure that it was not fixed to both adjacent teeth.
Specimen collection and micro-CT scanningImmediately after harvesting, all samples were immersed in 40 ml of 10% neutral buffered formalin for 2 days. They were then transferred to 70% ethanol and scanned by micro-CT (µCT50; Scanco Medical AG, Wangen-Brüttisellen, Switzerland), and three-dimensional images were reconstructed using a volume rendering technique with TRI/3D-BON (Ratoc System Engineering Co., Ltd., Tokyo, Japan) and VGSTUDIO MAX 3.5 (Volume Graphics GmbH, Heidelberg, Germany) analysis software. The scanning conditions were as follows: tube voltage 90 kV, tube current 155 µA, image matrix 3400 × 3400, and slice thickness 2 μm. A 0.1 mm copper filter was inserted to address metal artifacts around the implant (Fig. 2c and d) [26].
Histological evaluationThe specimens were subjected to graduated dehydration with ethanol, stained with Villanueva Osteochrome Bone Stain (Funakoshi Co., Ltd., Tokyo, Japan), and permeated with styrene monomer (Nissin EM Co., Ltd., Tokyo, Japan). They were then embedded in Rigolac® unsaturated polyester resin (Nissin EM Co., Ltd., Tokyo, Japan). The polymerized blocks were sliced in the XZ plane passing through the center of the implant body using a Leica SP 1600 saw microtome (Wetzlar, Germany) with a 300-µm-thick blade and polished with waterproof abrasive paper (#400, #800, and #1200) to prepare 100-µm-thick samples. These prepared specimens were examined under a general-purpose optical microscope (Axiophot2; Carl Zeiss, Oberkochen, Germany), and the volume of new bone was measured with the accompanying image software (Axiovision; Carl Zeiss).
Bone morphometryThe region of interest was designated in the area of cancellous bone extending for 2.4 mm proximally and distally from the center of the implant (the implant body diameter is 1.4 mm). The bone volume [BV/TV (%)], trabecular number [Tb.N (mm)], trabecular thickness [Tb.Th (µm)], and trabecular separation [Tb.Sp (µm)] and BMD [BMD (mg/cc)] were calculated in three-dimensional structural analysis. The analysis was conducted with Scanco Medical software.
Second harmonic generation (SHG) imagingSecond harmonic generation (SHG) images were acquired by using a multiphoton confocal microscopy system (LSM 880 Airy NLO; Carl Zeiss) with an excitation laser (Chameleon Vision II, wavelengths: 680–1080 nm; repetition rate: 80 MHz; pulse width: 140 fs; Coherent Inc., Santa Clara, CA, USA) and an objective lens (Plan-Apochromat 10×/0.8 M27; Carl Zeiss). The excitation wavelength for collagen fiber observation was 880 nm. The images thus obtained were used to measure the angle between the Z-axis and the negative direction of the collagen fiber bundles in an area measuring 200 μm × 200 μm centered on the implant central region (B and D). Since the collagen fiber bundles are drawn as curves, angle computation was conducted as a straight line connecting the ends of the curves in the area of observation. Collagen fiber bundle tracing and angle measurement were carried out using high-precision image analysis software (Imaris 8.4; Bitplane AG, Zürich, Switzerland). The variation in collagen fiber bundle angle was taken as an index of anisotropy.
BAp crystallite alignment measurementAn optical curved imaging plate (IP) X-ray diffractometer (XRD: D/MAX PAPIDII-CMF; Rigaku Corporation, Tokyo, Japan) was used for the quantitative evaluation of BAp crystallite alignment. Measurements were made at the reference point in the 100-µm-thick, non-decalcified, polished samples, with the irradiation field positioned in the center of the thickness of the compact bone structure using the optical microscope fitted to the XRD (×0.6–4.8 magnification), and X-ray irradiation conducted so that the incident beam was a circular microbeam of diameter 100 μm. The reference axes were designated as previously described, with the X-axis running in the buccolingual direction, the Y-axis in the anterior-posterior direction, and the Z-axis in the implant long axis direction, and the specimens were positioned accordingly. In the implant neck region (A and E), the reference points were the points 100 μm from the implant surface in the X-axis direction.
The central parts of the long axis of the implant body were designated as B and D, and C was designated as the region at the apex of the implant body (Fig. 3). Measurements were made following the method described by Nakano et al. [21] with both the transmission optical system and the reflecting optical system, using Cu-Kα rays as the radiation source, with a tube voltage of 40 kV and tube current of 30 mA.
Fig. 3
Designation of axes and setting the measurement point. Three axes are designated for measurements. The buccolingual direction is designated the X-axis, the mesiodistal direction the Y-axis, and the direction perpendicular to the occlusal plane (the long axis of the implant) the Z-axis. In the implant neck region (A and E), the reference points were the points 100 μm from the implant surface in the X-axis direction. The central parts of the long axis of the implant body were designated as B and D, and C was designated as the region at the apex of the implant body
The diffraction X-ray beam was detected with a curved IP. Using 2D Date Processing Software (Rigaku Corporation, Tokyo, Japan), the X-ray intensity ratio of the two diffraction peaks in the (002) and (310) planes was calculated from the diffraction ring images generated on the IP by the diffraction X-ray beam.
Statistical analysisThe results are expressed as mean values. GraphPad Prism version 6.0 (GraphPad Software, San Diego, CA, USA) was used for calculations and statistical analysis. After each measurement, t-test, one-way analysis of variance and Tukey’s multiple comparison test were conducted, and p < 0.05 was regarded as significant.
留言 (0)