
記住我


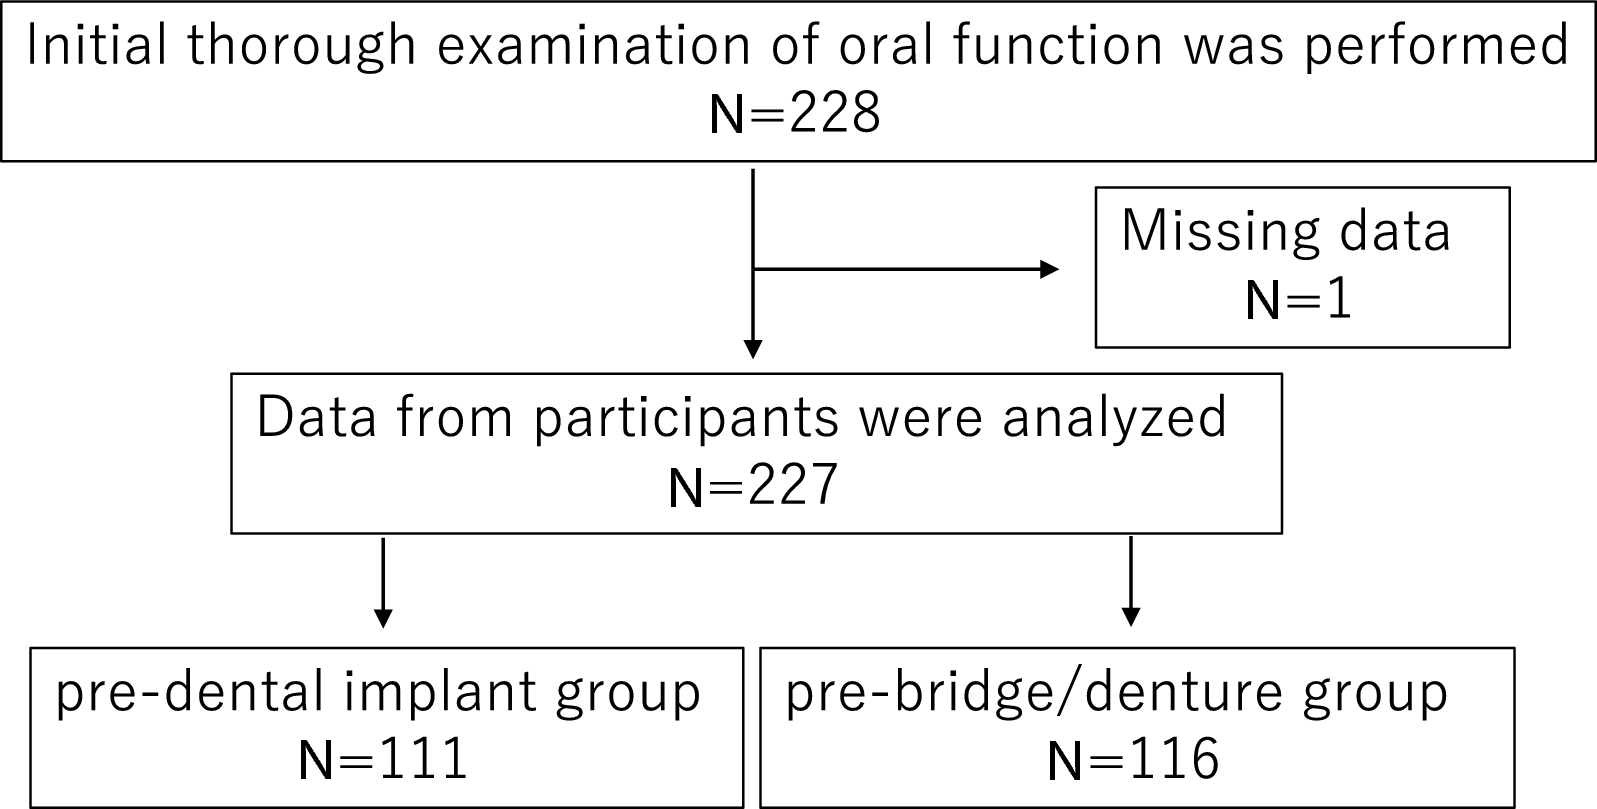


This randomized clinical trial was a single-blinded, two-group, parallel-group study. Participants were randomized on a 1:1 basis to either the HA nano-coated SLA group (test group, with a mean HA thickness of 10 nm and Ra of 2.5 μm; TSIII BA, Osstem Implant, Seoul, Korea) or the HA uncoated SLA group (control group, with Ra of 2.5 μm; TSIII SA, Osstem Implant, Seoul, Korea) (Fig. 1). The primary endpoint was evaluated up to four months after immediate implant placement. This prospective study received approval from the Institutional Review Board of the Seoul National University Dental Hospital (IRB No. CDE21007) and was registered with the Clinical Research Information Service (KCT0006364). All procedures were carried out in accordance with the Declaration of Helsinki, which outlines ethical principles for medical research involving human subjects [13]. Informed consent about the nature of the study was obtained from all participants prior to inclusion in the study. The manuscript was prepared according to the Consolidated Standards of Reporting Trials (CONSORT) guidelines [14]. The CONSORT flowchart of this study is presented in Fig. 2.
Fig. 1
Macroscopic and scanning electron microscopy (SEM) images of control and test implants used in this study. (a-c) control implant, hydroxyapatite uncoated SLA (d-f) test implant, hydroxyapatite nano-coated SLA Magnification: X5,000 (b, e), X10,000 (c, f)
Fig. 2 Study setting and participants
Individuals were considered eligible for inclusion if they satisfied the following criteria: (1) they were 19 years of age or older; (2) they were scheduled to receive implants following tooth extraction in the maxillary posterior region; (3) they had a vertical bone height of 4 mm or more after tooth removal; (4) they exhibited no local pathology in the maxillary posterior region; (5) they voluntarily agreed to participate in the clinical trial and were willing to adhere to the study protocol.
Individuals were excluded from the study if they: (1) had an acute periodontal infection; (2) were anticipated to have difficulty achieving primary stability at the time of implant placement due to extensive bone loss (both buccal and palatal/lingual bone loss > 50%) resulting from periodontal disease, as determined by cone beam computed tomography (CBCT) evaluation; (3) were pregnant or lactating; (4) had uncontrolled hypertension or diabetes; (5) had a history of radiation therapy and/or chemotherapy in the head and neck area; (6) had serious cardiovascular, respiratory, kidney, liver, digestive, blood system, or neuropsychiatric diseases; (7) had a history of drug allergies; (8) had a severe depressive or anxiety disorder that could affect the clinical trial; (9) had engaged in drug or alcohol abuse within the past year; (10) had taken bisphosphonate drugs within the previous four months; (11) were smokers consuming more than one pack (20 cigarettes) per day [15, 16]; (12) had abnormal occlusion due to temporomandibular disorder; (13) were deemed unsuitable for participation in the study due to ethical considerations.
Sample size calculationThe sample size was determined using the G * Power program version 3.1, developed by the University of Düsseldorf in Germany. Based on a previous study, it was projected that a difference of 3 between two groups in terms of implant stability would be clinically significant [17]. With a standard deviation (SD) of 3, an allocation ratio of 1:1, an alpha of 0.05, a power of 80%, and an anticipated exclusion rate of 15%, it was calculated that a total of 40 patients (20 patients per group) would be needed for the study.
Recruitment, randomization, and blindingParticipants were recruited from the outpatient department of Seoul National University Dental Hospital. Study personnel conducted screenings of potential participants. The random number table method was employed, utilizing Excel’s RANDOM function to assign a random sequence. Once a subject was included after the screening, group assignments were made after verifying the encrypted file designated by an individual not involved in this study. Study subject identification codes were documented on the assignment table. To ensure balanced randomization between groups, the block size was set to 20, and randomization was conducted at a 1:1 ratio. Allocation concealment was achieved using sealed, opaque envelopes, which were filled by volunteers and opened on the day of the implant surgery following the implant osteotomy. The researcher responsible for data analysis was blinded to participant group assignments and outcome data. Subject allocation numbers and their corresponding data were anonymized, with the key held by one co-investigator (Y.M.L.) who was not involved in the data analysis.
Preoperative preparationAll subjects who met the inclusion criteria underwent preoperative cone-beam computed tomography (CBCT) (CS9300, Carestream Health, Rochester, NY, USA) for preoperative diagnosis. Digital Imaging and Communications in Medicine (DICOM) format files were then exported in preparation for implant surgery. A digital impression was captured using an intraoral scanner (Medit, Seoul, Korea), and Standard Tessellation Language (STL) files were subsequently exported. All implants were virtually planned using three-dimensional implant planning software (Implant Studio; 3Shape, Copenhagen, Denmark) by a surgeon (J.L.). The positioning of the dental implant was determined at the central axis of the virtual crown. The surgeon decided the length and diameter of the implants based on anatomical considerations and the intermaxillary relationship. In order to achieve sufficient primary stability, the position of implants was planned to include at least 3 mm of residual bone beyond the root apex, and implant platform level was predetermined below subcrestal 2 mm [18,19,20]. Implants with a 10 mm of length were planned, and in cases of inadequate residual bone height, implants were placed with transcrestal sinus augmentation. The diameters of implants were selected as 4 mm for premolar and 5 mm for molar teeth. Given the identical macrodesign of the test and control implants, the planning was performed without group allocation. Consequently, the surgeon was not aware of the subject’s allocation group. The predicted bone quality, defined as the expected bone contact area between the bone and implant, was recorded based on the Hounsfield unit (HU) values using the software (D1; ≥1251, D2; 1250 − 851, D3; 351–850, D4; 151–350, none; ≤ 150; Fig. 3). Following the surgical planning procedure, a surgical guide was fabricated using a 3D printer (Asiga UV Max, Sydney, Australia).
Fig. 3
Flow of the digital surgical guide protocol. (a-c) Preoperative cone-beam computed tomography (CBCT) images and virtual implant position planning. (d) Virtual design and fabrication of the surgical guide. (e) Predicted bone-to-implant contact area according to bone density (HU; Hounsfield unit, D1; ≥1251 [gray], D2; 1250 − 851 [blue], D3; 351–850, [green] D4; 151–350, [yellow] None; ≤ 150 [black])
InterventionsThe surgical procedures are illustrated in Fig. 4 and Supplementary Fig. 1. Prior to surgery, patients were instructed to rinse their mouths with a 0.12% chlorhexidine solution (Bukwang Pharm, Seoul, Korea) for 1 min. The intraoral area was then scrubbed with povidone-iodine before the surgical procedure was conducted under local anesthesia using 2% lidocaine containing 1:100,000 epinephrine (Huons, Gyeonggi-do, Korea). Before tooth extraction, measurements were taken of tooth mobility, probing depth, gingival recession, the width of keratinized gingiva, and vestibule depth. Following tooth extraction, any granulation tissue in the extraction socket was curetted. Subsequently, a solution of doxycycline dissolved in saline was used for irrigation. A prefabricated surgical guide was applied without flap reflection, and the drilling procedure was performed, followed by implant placement. The marginal gap between the implant and the extraction socket wall was recorded. This marginal gap was filled with deproteinized bovine bone mineral (A-Oss, Osstem Implant, Seoul, Korea) and covered with a sponge-type collagen material (TERUPLUG, Olympus Terumo Biomaterials; Tokyo, Japan). At deficient residual bone height sites, transcrestal sinus augmentation was additionally performed with the gap filling procedure, and surgical site was secured with 5/0 Monosyn. All implant placement procedures were performed by an experienced periodontist (J.L.).
Fig. 4
Overall surgical procedures. (a-b) Preoperative clinical photographs. (c) Tooth dissection for nontraumatic extraction. (d) Extraction socket after the debridement of granulation tissue. (e) Fitting digital surgical guide on surgical site. (f) Immediate implant placement. (g) Bone graft using deproteinized bovine bone mineral into marginal gap between socket wall and implant surface with/without transcrestal sinus augmentation. (h) Covering the surgical site with spongy type of collagen material and suturing
All participants were prescribed 100 mg of cefdinir and 650 mg of acetaminophen, to be taken every 8 h daily for a period of 7 days following surgery. Additionally, a 0.12% chlorhexidine solution (Bukwang Pharm, Seoul, Korea) was prescribed for use as a mouth rinse over the same 7-day period. Any use of medications other than those prescribed was duly recorded.
Data collectionData regarding the implant stability quotient (ISQ) were collected at the time of implant surgery, as well as 1, 2, 3, and 4 months post-implant placement. These were the primary time points for data collection. Additionally, to evaluate the correlation between the primary stability of the implant and the quality of the surrounding bone, the proportions of bone mineral density values were also measured using the HU values of the Misch bone-density classification [21] on buccal/palatal and mesial/distal surfaces of virtually planned implant fixtures (Fig. 3).
The plan was to conduct intraoral scans prior to surgery, as well as 1, 4, and 16 weeks post-implant surgery, at the time of prosthesis delivery, and 1, 3, 5, and 10 years after prosthesis delivery. This would allow for the analysis of volumetric changes at the implant sites. In this interim study, we analyzed data from before surgery and from 1, 4, and 16 weeks after implant surgery.
Vertical linear alterations and three-dimensional volume changes at surgical sites were examined using intraoral scan data and a 3D geometric software program (GOM Inspect, GOM, Braunschweig, Germany), as per the methods outlined in previous studies [22, 23]. The two sets of intraoral scan data to be compared were automatically superimposed using the software program (Fig. 5). Changes in vertical linear distances between pre- and post-surgery (at 1, 4, and 16 weeks intervals) were measured in millimeters (mm) at the midpoint of the buccal and palatal marginal gingiva, parallel to the long axis of the pre-existing tooth. Concurrently, three-dimensional volume changes on the buccal and palatal sides were calculated as relative values (%). The horizontal boundary of the volume of interest (VOI) was determined between two contact points of teeth, and the vertical boundary was set to be 3 mm apically from the position of the central gingival margin. After the VOI was divided into buccal and palatal segments, referencing the extension line of the central pits, the volume of each segment was measured.
Fig. 5
The outline of measurements of vertical deviations and volume changes before and after surgery. (a) Preoperative intraoral scan data. (b) Postoperative intraoral scan data. (c) Superimposition of pre-/post-operative intraoral scan data. The plane parallel to the long axis of the pre-existing tooth was set at the most-middle of buccal and palatal sides for vertical deviation measurement. (d) Cross-sectional image virtually dissected by the former plane. Vertical deviations (mm) were measured in a direction parallel to the former plane from buccal and palatal marginal gingiva. (e-f) Representative images of volume changes in buccal and palatal sides. Volumes were measured as absolute value (mm3) and converted into the relative percent (%) of post-/pre-operative volumes
PROMs, including a subjective questionnaire and the Oral Health Impact Profile-14 (OHIP-14) [24], were obtained. The subjective questionnaire, which included questions about pain, swelling, discomfort with the implant placement procedure, satisfaction with the implant surgery, and willingness to undergo the same treatment in the event of future tooth loss, was administered on the day of surgery and again at 1 and 4 weeks post-surgery. Responses were recorded using visual analog scales (VAS, 0 = no pain, 100 = maximum pain). The OHIP-14 was administered 2 weeks prior to surgery, on the day of the operation, and 16 weeks post-surgery. Responses were recorded using a Likert scale (0 = never, 1 = hardly ever, 2 = occasionally, 3 = fairly often, 4 = very often).
The soft tissue inflammation score [25] was recorded at 1 and 4 weeks post-surgery using the following scale: 0 represents healthy peri-implant soft tissue; 1 indicates slight inflammation, characterized by a minor color change in the entire marginal or papillary soft tissue; 2 signifies mild inflammation, with no edema but a mild color change in the entire marginal and papillary soft tissue; 3 denotes moderate inflammation, marked by a glossy and reddened appearance, edema, and overgrowth of the marginal and papillary soft tissue; 4 corresponds to severe inflammation, characterized by significant redness, swelling, and overgrowth, spontaneous bleeding, or ulceration of the marginal and papillary soft tissue.
Statistical analysisThe statistical analyses were conducted using SPSS software (version 25.0, Chicago, Illinois) and GraphPad Prism version 10.0.2 software for Windows (GraphPad Software, San Diego, CA, USA). Variables were expressed as either mean ± SD or median ± IQR, while categorical variables were represented by frequencies.
The changes in ISQ over time were evaluated using repeated-measures analysis of variance (rm-ANOVA), and Sidak multiple comparisons were conducted. A subgroup analysis of ISQ values (< 70 and ≥ 70 at the time of surgery) was performed using rm-ANOVA with Sidak multiple comparisons. The frequencies of ISQ and insertion torque values were compared between the control group and the test group using the chi-square test.
Changes in vertical deviation and volume at the buccal and palatal areas were evaluated using rm-ANOVA and Tukey multiple comparisons for within-group comparisons. The values between two groups at the same time point were compared using the unpaired t-test.
The subjective questionnaire, which included questions about pain and the sensation of swelling, was analyzed using rm-ANOVA with Tukey multiple comparisons test for intragroup comparisons. The unpaired t-test was performed for intergroup comparisons. The results of another subjective questionnaire, which included questions about discomfort with the implant placement procedure, satisfaction with implant surgery, and willingness to undergo the same treatment in the event of tooth loss, were compared between the two groups using the unpaired t-test. rm-ANOVA with the Tukey multiple-comparisons test was used to evaluate the significance of differences in each domain of the OHIP-14 at various time points, including 2 weeks before surgery, on the day of the implant surgery, and 16 weeks post-surgery. The soft tissue inflammation score was analyzed using the Mann-Whitney test for intragroup comparisons between two time points and intergroup comparisons at each timepoint.
A multiple linear regression model was utilized to determine whether candidate variables, including patient-, site-, and implant-related factors, were associated with the ISQ value at the time of implant surgery (V3).
留言 (0)