
記住我


Coronary artery disease (CAD) is a leading public health problem,[1] causing a huge burden on society and individuals. However, despite the emergence and technological advances in percutaneous coronary intervention (PCI), major adverse cardiovascular events (MACE) remain common for patients with CAD. Therefore, potential biomarkers that can be used for improving risk stratification need to be identified.
As we all know, inflammation and immunity play a key role in the pathological process of atherosclerosis.[2] Neutrophils activate macrophages, promote monocyte recruitment, accelerating all stages of atherosclerosis, whereas lymphocytes play an anti-atherosclerotic effect. Various inflammation markers, such as red cell distribution width (RDW), C-reactive protein, neutrophil-to-lymphocyte ratio (NLR), hemoglobin-to-red-cell distribution width ratio (HRR), systemic inflammatory index systemic inflammatory index (SII), and platelet-lymphocyte ratio (PLR) have been used for predicting the occurrence of various adverse events in patients with cardiovascular diseases, as reviewed by recent systematic reviews and meta-analyses.[3–5] However, to the best of our knowledge, few studies have directly compared the predictive values of these biomarkers. In this study, we aimed to evaluate the prediction values of these inflammatory indices for patients underwent PCI, and further develop a nomogram incorporating simple and accessibility indices to clinical data to predict the prognosis of 1 year mortality.
2. Methods 2.1. Study populationThis study was approved by the Ethics Committee of The Second Hospital of Tianjin Medical University (KY2023052-01). The need for informed consent was waived by the ethics committee owing to the retrospective, observational nature of this study. Patients with CAD underwent PCI were consecutively enrolled from January 2019 to February 2022 at the Second Hospital of Tianjin Medical University. The inclusion criteria included: patients aged ≥ 18 years; those who underwent PCI and implanted 1 or more stent; the exclusion criteria were as follows: patients with malignant tumors, infectious diseases, autoimmune diseases, incomplete blood cell count, loss of follow-up.
2.2. Data collection and laboratory measurementsWe collected the demographic, clinical, and laboratory data; neutrophils, RDW, hemoglobin (Hb), platelets, lymphocyte were calculated the following indices, NLR, SII, PLR, and HRR. And also recorded the medications at discharge: antiplatelet drugs (aspirin or clopidogrel), statins, β-blockers.
2.3. Disease definitionHypertension was defined as systolic blood pressure ≥ 140 mm Hg (1 mm Hg = 0.133 kPa) and/or diastolic blood pressure ≥ 90 mm Hg at rest or a previous diagnosis of hypertension with antihypertensive therapy. Diabetes mellitus was defined according to the American Diabetes Association: (1) glycated Hb value of 6.5% or higher, (2) fasting plasma glucose ≥ 126 mg/dL (7.0 mmol/L), (3) 2-h plasma glucose ≥ 200 mg/dL (11.1 mmol/L) during an oral glucose tolerance test using 75 g of glucose, and/or. Dyslipidemia was defined as a serum total cholesterol level ≥ 5.18 mmol/L (200 mg/dL), high-density lipoprotein cholesterol level ≤ 1.04 mmol/L, low-density lipoprotein cholesterol level ≥ 3.37 mmol/L, triglyceride level ≥ 1.7 mmol/L, or a previous diagnosis of dyslipidemia with prescribed medication. Chronic kidney disease (CKD) was defined as eGFR < 60 mL/min, duration > 3 months.
2.4. Study endpoints and follow-upThe endpoint of the present study was 1-year all-cause mortality, which was defined as death from any cause. Follow up data were collected via a review of electronic medical records and/or clinic visits. The median follow-up duration was 429 days.
2.5. Statistical analysisSPSS 25.0 (IBM Corp., Armonk, NY) and R version 4.2.0 was used to statistical analysis. The normality of the continuous variables was determined using the Kolmogorov–Smirnov test. Categorical variables were presented as percentages. Continuous variables are presented as mean ± standard deviation, while those without normal distribution are presented as median and interquartile range. Continuous variables with a normal distribution were compared between the groups by using the independent t test and continuous variables without a normal distribution were compared by using the Mann–Whitney test. Categorical comparisons were performed using Chi-square test.
Receiver operating characteristic (ROC) curve analysis was performed to evaluate the sensitivity and specificity of the inflammation makers for predicting ACM. Age, sex and parameters that were significant on univariable analysis were included in multivariable cox regression models to identify potential risk factors. Restricted cubic spline analysis was performed to evaluate the relationship between RDW, NLR as a continuous parameter and 1-year all ACM mortality.
The predictive ability was assessed by the area under the receiver operating characteristic curve (AUC). Nomogram were developed to predict the probability of 1-year ACM mortality based on the results of the multivariable COX regression. The P values were 2-sided, and P < .05 was considered significant.
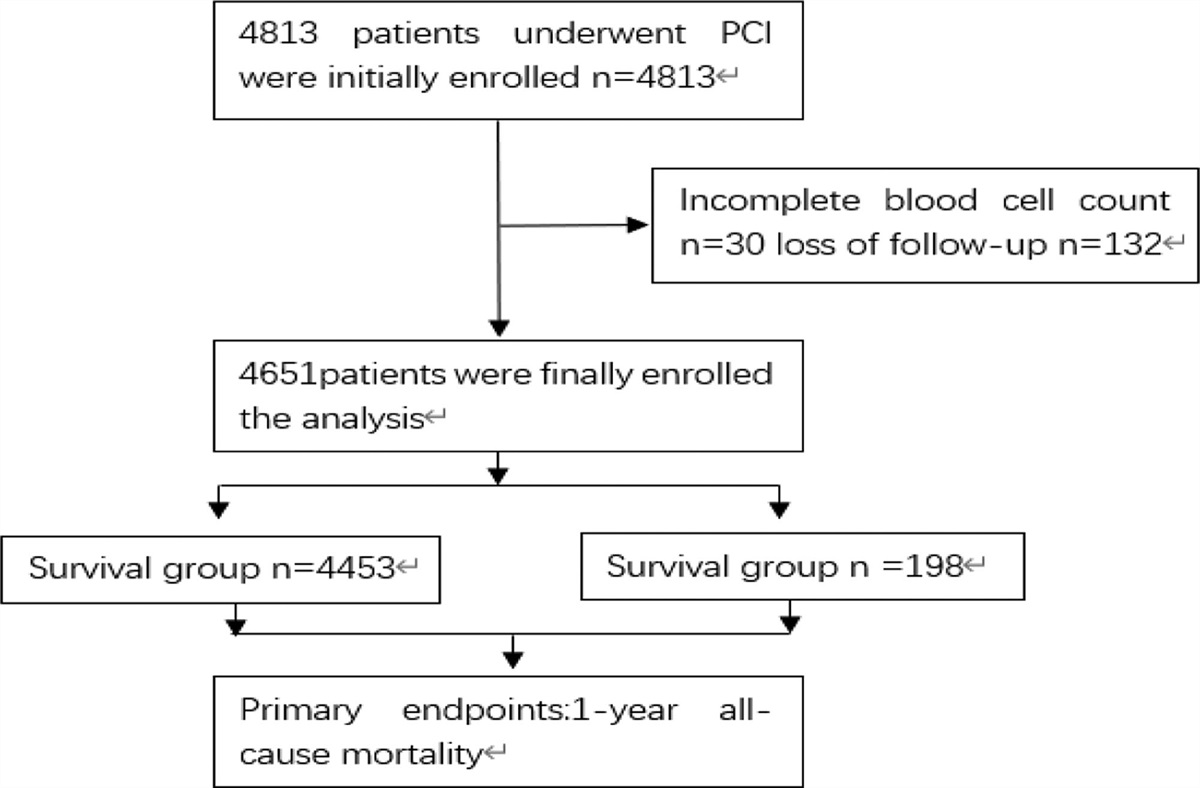
3. Results 3.1. Clinical resultsThe identification of study subjects was shown in the flowchart in Figure 1. A total of 4651 patients were enrolled into this study with a median follow-up of 429 days. 198 patients died, irrespective of the cause of death (1-year all-cause mortality of 4.3%). The baseline characteristics of the study cohort stratified by survival status are shown in Table 1. There were 4453 patients (M/F, 63.7 %/36.3%) in the survival group and 198 patients (M/F, 65.7 %/34.3%) in the non-survival group. Compared to patients who remained alive, those who died had advancing age, higher values of systolic blood pressure, diastolic blood pressure, and heart rate (P < .05), and lower frequencies of hypertension, cerebrovascular accident, and CKD (P < .05). There were significant differences, including white blood cell count, Hb, lymphocytes, neutrophils, percentage of neutrophils, RDW, NLR, SII, and PLR between the 2 groups, as shown in Table 1 and Figure 2 (P < .05).
Table 1 - Patient characteristics (demographical, clinical, and laboratory results). Variables SurvivalCAH = cerebrovascular accident history, CKD = chronic kidney disease, DBP = diastolic blood pressure, Hb = hemoglobin, HR = heart rate, HRR = hemoglobin-to-RDW ratio, MI = myocardial infarction, NLR = neutrophil-lymphocyte ratio, PLR = platelet-lymphocyte ratio, RDW = red cell distribution width, SBP = systolic blood pressure, SII = systemic inflammatory reaction index.
 Figure 1.:
 The flowchart of participants inclusion.
 Figure 2.:
 Boxplots of the RDW, NLR, PLR, and SII showing the distribution in the survival group (n = 4651) and non-survival group (n = 198). NLR = neutrophil-lymphocyte ratio, PLR = platelet-lymphocyte ratio, RDW = red cell distribution width, SII = systemic inflammatory reaction index.
3.2. Association between inflammatory biomarkers and 1-year all-cause mortalityUnivariable Cox regression showed that age, myocardial infarction (MI), co-morbidities (CKD, cerebrovascular accident), inflammatory markers (RDW, NLR, SII, and PLR), and medication at discharge (aspirin, clopidogrel, beta blockers, statins) were significant risk factors for 1-year mortality.
Multivariable Cox regression was performed, and found that age (heart rate [HR] = 0.439, 95% CI 0.330–0.584, P < .001), RDW (HR: 0.319; 95% CI: 0.237–0.429; P < .001), NLR (HR: 0.471; 95% CI: 0.345–0.643; P < .001), remained significant predictors. SII and PLR were only found to be risk factors in the unadjusted model Table 2.
Table 2 - Univariable and multivariable Cox regression to identify significant predictors of 1-year survival. Covariates Univariate Multivariable HR (95% CI) P-value HR (95% CI) P-value Age 1.071 (1.055-1087) <.001 1.051 (1.035–1.066) <.001 Female 1.088 (0.811–1.459) .574 MI 3.206 (2.402–4.279) <.001 2.216 (1.590–3.087) <.001 Hypertension 0.604 (1.154–2.377) .006 CKD 6.66 (5.018–8.839) <.001 2.383 (1.745–3.253) <.001 Cerebrovascular accident history 2.626 (1.954–3.529) <.001 0.575 (0.425–0.778) <.001 DM 0.76 (0.574–1.006) .055 AF 0.446 (1.954–3.529) .145 RDW 1.441 (1.368–1.518) <.001 1.437 (1.346–1.535) <.001 NLR 1.070 (1.060–1.082) <.001 1.038 (1.0221.054) <.001 SII 1.000 (1.000–3.180) <.001 PLR 3.812 (1.901–3.364) <.001 Aspirin 4.931 (3.731–6.516) <.001 Clopidogrel 0.779 (0.585–1.036) .086 Beta blockers 0.549 (0.415–0.726) <.001 1.432 (1.066–1.923) .017 Statins 0.161 (0.120–0.217) <.001 3.093 (2.229–3.093) <.001Restricted cubic spline analysis showed that the relationship between RDW, NLR, and 1-year all-cause mortality was linear after adjusting for all the variables (P for non-linearity < 0.001).cutoff values of RDW and NLR were allocated at 12.9 and 2.9, respectively. With the continuous change of RDW and NLR, the risk of 1-year mortality increased linearly. This analysis demonstrated that there was a continuous increase in the risk with increasing NLR, RDW (Fig. 3), P < .001 for the adjusted linear model.
 Figure 3.:
 Association between RDW, NLR, and 1-year mortality (adjusted for all covariants in multivariable model). NLR = neutrophil-lymphocyte ratio, RDW = red cell distribution width.
3.3. ROC analysis for 1-year all-cause mortalityThe ROC curve was applied to compare the predict value of different inflammatory variables, including NLR, RDW, SII, PLR and the multivariable adjusted model in our cohort at 1-year follow-up. The adjusted model incorporating demographic and comorbidities was better than the stand-alone predictor RDW, NLR, PLR, SII (AUC = 0.83, P < .0001). NLR (AUC: 0.722, P < .001) had the highest predictive power, RDW (AUC: 0.718, P < .001) and SII (AUC: 0.704, P < .001) had higher predictive ability for 1-year all-cause mortality. PLR alone had a lower predictive value (AUC = 0.683, P < .0001), Figure 4.
 Figure 4.:
 Receiver operator characteristics curve of the NLR, RDW, SII, PLR, and the adjusted model for 1-year mortality. NLR = neutrophil-lymphocyte ratio, PLR = platelet-lymphocyte ratio, RDW = red cell distribution width, SII = systemic inflammatory reaction index.
3.4. Subgroup analysisMI and non-MI were used as stratification variables to observe the effect size trend, and a forrest plot of data was performed, Figure 5. It showed that similar results were found in association between RDW, NLR, SII, PLR, and 1-year mortality for patients in MI group.
 Figure 5.:
 Subgroup analysis forest charts.
3.5. A novel nomogram for 1-year mortality after PCINomogram was developed to predict the probability of 1-year mortality, which was established using the significant predictors mentioned earlier, Figure 6. The nomogram allowed direct reading of the probability, after summing the points for each single predictor.
 Figure 6.:
 Nomogram to estimate the risk of 1-year mortality in patients after PCI. PCI = percutaneous coronary intervention.
4. DiscussionThe main findings of our study are that, of the different laboratory biomarkers obtained from routine blood tests, RDW and NLR showed the best predictive value for 1-year mortality prediction, comparing with PLR, SII. With the continuous change of RDW and NLR, the risk of 1-year mortality increased linearly. Multivariable predictive model incorporating RDW, NLR into demographic and clinical risk factors was able to improve risk stratification.
Coronary atherosclerosis is the major pathological process underlying CAD,[6] with important molecular mechanisms including pro-inflammatory changes, high oxidative stress environment and endothelial dysfunction.[7] Clinically, GRACE risk score is most commonly used risk score system for estimating the prognosis for patients presenting with acute coronary syndromes. However, it does not incorporate biomarkers that reflect the underlying pathologic processes of inflammation and oxidative stress. Recent efforts have focused on the use of routinely obtained, low cost and easily accessible biomarkers, such as red cell distribution width (RDW), neutrophil-lymphocyte ratio (NLR), systemic immune-inflammation index (SII), HRR, platelet-lymphocyte ratio (PLR) for risk stratification in cardiovascular diseases.[8–10] Consistent with previous studies, NLR is significantly associated with 1-year mortality in CAD in this current study. Xu et al[11] found that NLR ≥ 3.39 was association with adverse cardiovascular events in patients with left main and/or three-vessel disease. In our study, NLR > 2.9 adjusting for the covariables was an independent predictor of 1-year mortality.
In addition to previous studies focusing on the functional changes of platelets and neutrophils, others have focused on the abnormal structure and function of red blood cells that can serve as biomarkers of prognosis in CVD. The RDW reflects the degree of heterogeneity of erythrocyte volume, which is traditionally for differential diagnosis of anemias. It has been explored as a biomarker for predicting prognosis in cancer, cardiovascular disease, diabetes, venous thromboembolism, atrial fibrillation, stroke, chronic obstructive pulmonary disease and community-acquired pneumonia to name a few. Moreover, RDW is a strong and independent risk factor for mortality in the general population.[12] One of the major determinants of RDW is the hormone erythropoietin, which regulates maturation and survival of erythrocytes. Inflammation and oxidative stress could contribute to decreases in erythrocyte membrane deformability. Inflammation can damage normal bone marrow, lead to the reduced efficiency of red blood cell production, and abnormal RBC membrane homeostasis, and further increases the proportion of immature RBC, thereby increasing RDW.[13] Increased oxidative stress is associated with the variation in erythrocyte size.
Several studies have already suggested elevated RDW level was associated with poor prognosis in patients underwent PCI.
In 2009, Fukuta first reported that RDW was associated with B-type natriuretic peptide in CAD patients undergoing cardiac catheterization.[14] Felker et al[15] found that RDW was an independent predictor of the prognosis in patients with heart failure. Fatemi et al[16] found that RDW was related to 1-year mortality in patients underwent PCI (HR 1.65, CI 1.22–2.23, P = .001). Liao et al[17] analyzed the association between RDW and 1-year all-cause and cardiovascular mortalities in patients undergoing PCI, stratified RDW values into 5 groups (13.4%, 14.1%, 14.8%, and 15.9%), and reported that RDW was an independent predicting factor in patients. Furthermore, Xiao et al[18] conducted a retrospective cohort study investigating the association between change of RDW values defined as ΔRDW with MACE in patients undergoing PCI. They found that the incidence of MACEs in stable RDW group was significantly lower.
Likewise, in our study RDW was an independent predictor for 1-year mortality in patients with CAD undergone PCI, meanwhile the best cutoff value was 12.9 according to restricted cubic spline analysis after adjusting for the covariables.
Furthermore, a research study including 390 STEMI patients demonstrated adding RDW to the GRACE risk score system could enhance the predictive power.[19]
Our findings align with previous research to some extent, adding RDW and NLR to model composed of traditional risk factors, showed incremental prognostic value for predicting 1-year mortality (AUC,0.830, P < .001).
Moreover, SII incorporates information from 3 white blood cells subtypes, neutrophils, platelets, and lymphocytes. It has been shown to predict poor prognosis in several cancers and cardiovascular diseases.[20,21] Many studies showed that patients with higher levels of SII show increased predisposition to stroke or cerebral venous thrombosis.[22] Liu et al[23] found that compared with NLR and C-reactive protein, SII had better predictive value for incident CAD. Weng et al[24] reported that SII was associated with severity following stroke, and SII was an independent prognostic indicator of poor prognosis at 3 months. Conversely, in our study, univariable analysis showed SII > 991.6 was related to 1-year prognosis, but not after adjusting for other significant predictors. It can be speculated that the study population is different, resulting inconsistent findings.
Other studies have found that Hb is a good predictor for MACE and 1-year mortality in PCI patients.[25,26] Regarding HRR, Xiu et al[27] found that it is an independent predictor for long-term mortality with patients with PCI. They enrolled 6046 CAD patients underwent PCI, grouped into 2 groups, according to the HRR median value of 10.25, showed that the lower HRR, the higher long-term all-cause and cardiovascular mortality. By contrast, in our study, HRR was not a significant predictor of all-cause mortality. It may be related to the shorter follow-up in our study.
To our knowledge, it is the first time to compare inflammation biomarkers based on blood routine test, involving NLR, RDW, SII, PLR, and 1-year all-cause mortality in patients underwent PCI. In this research, we developed a nomogram to predict the probability of 1-year mortality, which was established consisting of simple demographic, clinical, and laboratory data.
Nomogram is a simple and readily available predictive tool that may help the clinician in risk stratification in patients with CAD post PCI, providing support for future research.
5. Study limitationsOur study has some limitations. Firstly, despite the relatively large sample size, this was a single-center retrospective cohort study including Chinese patients. Other studies are needed to confirm the generalizability of our results. Secondly, only baseline values of laboratory biomarkers were obtained. Future studies should investigate whether dynamic changes in inflammation markers could further improve risk prediction. Thirdly, to ensure the stability of the study results, we performed subgroup analyses of whether the clinical presentation was myocardial infarction at the admission, but did not perform subgroup analyses for variables such as age and degree of anemia.
6. ConclusionsAmong the laboratory indices, RDW and NLR showed the best performance for mortality risk prediction. Multivariable predictive models incorporating NLR, RDW, and comorbidities significantly improved risk stratification.
AcknowledgmentsWe appreciate all the participants in the study. Also, we would like to thank the Second Hospital of Tianjin Medical University Cardiology Center for their assistance in data collection.
Author contributionsConceptualization: Li Kun Huo, Kang Yin Chen.
Formal analysis: Li Kun Huo, Kang Yin Chen.
Funding acquisition: Kang Yin Chen.
Investigation: Li Kun Huo, Kang Yin Chen.
Methodology: Li Kun Huo, Kang Yin Chen, Tong Liu.
Supervision: Tong Liu, Kang Yin Chen.
Writing – original draft: Li Kun Huo, Gary Tse.
Writing – review & editing: Li Kun Huo, Gary Tse, Kang Yin.
Conceptualization: Li Kun Huo, Kang Yin Chen.
Formal analysis: Li Kun Huo, Kang Yin Chen.
Funding acquisition: Kang Yin Chen.
Investigation: Li Kun Huo, Kang Yin Chen.
Methodology: Li Kun Huo, Kang Yin Chen, Tong Liu.
Supervision: Tong Liu, Kang Yin Chen.
Writing – original draft: Li Kun Huo, Gary Tse.
Writing – review & editing: Li Kun Huo, Gary Tse, Kang Yin Chen.
References [1]. Yusuf S, Joseph P, Rangarajan S, et al. Modifiable risk factors, cardiovascular disease, and mortality in 155 722 individuals from 21 high-income, middle-income, and low-income countries (PURE): a prospective cohort study. Lancet. 2020;395:795–808. [2]. Eisen A, Giugliano RP, Braunwald E. Updates on acute coronary syndrome: a review. JAMA Cardiol. 2016;1:718–30. [3]. Weymann A, Ali-Hasan-Al-Saegh S, Popov AF, et al. Haematological indices as predictors of atrial fibrillation following isolated coronary artery bypass grafting, valvular surgery, or combined procedures: a systematic review with meta-analysis. Kardiol Pol. 2018;76:107–18. [4]. Weymann A, Ali-Hasan-Al-Saegh S, Sabashnikov A, et al. Prediction of new-onset and recurrent atrial fibrillation by complete blood count tests: a comprehensive systematic review with meta-analysis. Med Sci Monit Basic Res. 2017;23:179–222. [5]. Weymann A, Popov AF, Sabashnikov A, et al. Baseline and postoperative levels of C-reactive protein and interleukins as inflammatory predictors of atrial fibrillation following cardiac surgery: a systematic review and meta-analysis. Kardiol Pol. 2018;76:440–51. [6]. Lee YT, Laxton V, Lin HY, et al. Animal models of atherosclerosis. Biomed Rep. 2017;6:259–66. [7]. Figueiredo CS, Roseira ES, Viana TT, et al. Inflammation in coronary atherosclerosis: insights into pathogenesis and therapeutic potential of anti-inflammatory drugs. Pharmaceuticals (Basel, Switzerland). 2023;16:1242. [8]. Tse G, Zhou J, Woo SWD, et al. Multi-modality machine learning approach for risk stratification in heart failure with left ventricular ejection fraction ≤ 45. ESC Heart Fail. 2020;7:3716–25. [9]. Ju C, Zhou J, Lee S, et al. Derivation of an electronic frailty index for predicting short-term mortality in heart failure: a machine learning approach. ESC Heart Fail. 2021;8:2837–45. [10]. Tse G, Zhou J, Lee S, et al. Multi-parametric system for risk stratification in mitral regurgitation: a multi-task Gaussian prediction approach. Eur J Clin Invest. 2020;50:e13321. [11]. Xu N, Tang XF, Yao Y, et al. Predictive value of neutrophil to lymphocyte ratio in long-term outcomes of left main and/or three-vessel disease in patients with acute myocardial infarction. Catheter Cardiovasc Interv. 2018;91:551–7. [12]. Patel KV, Ferrucci L, Ershler WB, Longo DL, Guralnik JM. Red blood cell distribution width and the risk of death in middle-aged and older adults. Arch Intern Med. 2009;169:515–23. [13]. Arbel Y, Birati EY, Finkelstein A, et al. Red blood cell distribution width and 3-year outcome in patients undergoing cardiac catheterization. J Thromb Thrombolysis. 2014;37:469–74. [14]. Fukuta H, Ohte N, Mukai S, et al. Elevated plasma levels of B-type natriuretic Peptide but not C-reactive protein are associated with higher red cell distribution width in patients with coronary artery disease. Int Heart J. 2009;50:301–12. [15]. Felker GM, Allen LA, Pocock SJ, et al. Red cell distribution width as a novel prognostic marker in heart failure: data from the CHARM Program and the Duke Databank. J Am Coll Cardiol. 2007;50:40–7. [16]. Fatemi O, Paranilam J, Rainow A, et al. Red cell distribution width is a predictor of mortality in patients undergoing percutaneous coronary intervention. J Thromb Thrombolysis. 2013;35:57–64. [17]. Liao MT, Lai CL, Wang TC, Lin J-W, Ho Y-L, Chan KA. Red cell distribution width and mortality in patients undergoing percutaneous coronary intervention. Biomedicines. 2021;10:45. [18]. Xiao Q, Yan D, Qin J, et al. Dynamic changes in red cell distribution width can predict major adverse cardiovascular events after PCI in patients with unstable angina pectoris: a retrospective cohort study. Dis Markers. 2022;2022:2735717. [19]. Wei JH, Qiu CG. Combined value of red blood cell distribution width and global registry of acute coronary events risk score on predicting long-term major adverse cardiac events in STEMI patients undergoing primary PCI. Oncotarget. 2018;9:13971–80. [20]. Hu B, Yang XR, Xu Y, et al. Systemic immune-inflammation index predicts prognosis of patients after curative resection for hepatocellular carcinoma. Clin Cancer Res. 2014;20:6212–22. [21]. Toyoda J, Sahara K, Maithel SK, et al. Prognostic utility of systemic immune-inflammation index after resection of extrahepatic cholangiocarcinoma: results from the U.S. extrahepatic biliary malignancy consortium. Ann Surg Oncol. 2022;29:7605–14. [22]. Zhang X, Ding R, Li H, et al. An association between inflammation and cerebral venous thrombosis: a retrospective study. J Stroke Cerebrovasc Dis. 2021;30:106084. [23]. Liu Y, Ye T, Chen L, et al. Systemic immune-inflammation index predicts the severity of coronary stenosis in patients with coronary heart disease. Coron Artery Dis. 2021;32:715–20. [24]. Weng Y, Zeng T, Huang H, et al. Systemic immune inflammation index predicts 3-month functional outcome in acute ischemic stroke patients treated with intravenous thrombolysis. Clin Interv Aging. 2021;16:877–86. [25]. Hosseini SK, Ansari MJ, Lotfi Tokaldany M, Sharafi A, Hakki Kazazi E, Poorhosseini H. Association between preprocedural hemoglobin level and 1-year outcome of elective percutaneous coronary intervention. J Cardiovasc Med (Hagerstown). 2014;15:331–5. [26]. Poludasu S, Marmur JD, Weedon J, Khan W, Cavusoglu E. Effect of hemoglobin level on long-term all-cause mortality after percutaneous coronary intervention in African-Americans. Am J Cardiol. 2009;103:1078–82. [27]. Xiu WJ, Yang H-T, Zheng Y-Y, et al. Hemoglobin-to-red-cell distribution width ratio is a novel predictor of long-term patient outcomes after percutaneous coronary intervention: a retrospective cohort study. Front Cardiovasc Med. 2022;9:709868
留言 (0)