
記住我


In December 2019, a phenomenon called Coronavirus Disease 2019 (COVID-19) emerged in China and attracted global attention. COVID-19 spread rapidly after its discovery in Wuhan, China. In March 2020, pneumonia caused by Severe Acute Respiratory Syndrome Coronavirus 2 (SARS-CoV-2) was declared a global pandemic. Early isolation, diagnosis, and treatment can improve the prognosis of patients, and large-scale testing is crucial for blocking virus transmission and preventing rapid economic decline.[1] The prevention and control plans that have been issued by China many times have proposed that one of the diagnostic criteria is the positive detection of SARS-CoV-2 nucleic acid in the patients respiratory tract samples. However, due to the existence of false negatives, many COVID-19 patients are positive for the SARS-CoV-2 virus after multiple nucleic acid tests,[2,3] and this has had a great impact on epidemic prevention and control. Therefore, it is urgent to improve the detection rate of viral nucleic acid in COVID-19 patients. In China, nasopharyngeal swabs and pharyngeal swabs are the most common methods for detecting viral nucleic acid. With the use of anal swabs and antibodies as supplementary detection methods, the missed detection rate is further reduced,[4] but there is still a high false-negative rate. Due to the existence of false-negative nucleic acid tests, some patients who are suspected to have COVID-19 and have been ill a long time do not have a positive test result for a long time, which delays the Centers for Disease Control and Preventions timely control of close contacts and general contacts and further delays the environmental disinfection and viricidal effects. At the same time, some patients are positive on their respiratory tract samples at an early stage, but they were negative for nucleic acids in their respiratory tract samples for many days after admission. In these cases, it was not proven that the first positive test was incorrect until nucleic acid positivity was detected again later in these patients. This leads to the limitations of the diagnostic gold standard, which is nucleic acid detection, and this has a great impact on the current clearing policy implemented throughout the country and is not conducive to the prevention and control of the epidemic.
At present, many patients will undergo biomarker detection, clinical symptom observation, and imaging examinations during hospitalization, and these types of factors are part of the available data. A retrospective analysis of 100 suspected cases in India showed that there were differences in some of the biomarkers between the nucleic acid-positive patients and nucleic acid-negative patients, but the predictive value of these indicators was not studied. Biomarkers are defined as “objectively measured and evaluated characteristics that serve as indicators of normal biological processes, pathogenic processes, or pharmacological responses to therapeutic interventions.” Biomarkers provide knowledge and guidance for clinical pharmacology and play diagnostic, prognostic, and predictive roles.[5] Many studies have shown that there is a correlation between the clinical severity and strains of COVID-19 and certain biomarkers,[6] which means that the strains or detection rate of viruses can be predicted by biochemical indicators. However, when these related studies[7] selected their control group, they mainly selected cases that were nucleic acid-negative but were suspected cases or non-COVID-19 cases. Therefore, these studies lacked the confirmation of positive cases, and the different selection of the control group may affect the results. To get closer to the research objectives, this study aims to observe the correlation between biomarkers, CT imaging, clinical symptoms and nucleic acid detection results in COVID-19 patients and to discuss the risk factors for false negatives in COVID-19 pneumonia cases. These factors are of great significance to further improve the detection rate of viral nucleic acid for SARS-CoV-2.
Logistic regression analysis is commonly used to model the relationships between binary outcome variables and one or more predictor variables. This method has many applications in clinical biochemical indicators and is also of great significance in various medical fields. However, the main limitation of this method is that if there is multicollinearity between the predicted variables, it may affect the stability and interpretability of the model. The shrinkage method can reduce the risk of overfitting and improve the generalization ability of the model by shrinking the coefficients of related variables until they are zero, thereby addressing multicollinearity problems and improving the performance of predictive models. Among shrinkage methods, classic examples include the Bayesian method,[8] ridge regression method, and Least Absolute Shrinkage and Selection Operators (LASSO) regression method. The aim of this study was to utilize the LASSO regression method for preliminary indicator screening. Since we were unable to obtain quantitative data (CT value) of the patient’s viral content in the early stage, we collected qualitative data of the patient’s nucleic acid results, either positive or negative, as the results of the dependent variables. After utilizing a logistic regression analysis to compare the disease severity and biomarkers in COVID-19 patients, we found that some biomarkers have a strong predictive value (such as D-dimer, C-reactive protein, NLR; area under the area under the subject working curve (AUC) curve is >0.8)[9,10]; however, some biomarkers have a weak predictive value and questionable practicability. If these markers are used to diagnose diseases and to predict the positive rate of nucleic acid tests, they have only a limited effect. Therefore, this study included as many influencing factors as possible, including biomarkers, clinical symptoms, and imaging examination, to explore the correlation and predictive value. In practice, it is difficult to detect biomarkers and perform imaging examinations in the patients every day. Therefore, this study adopts the hierarchical analysis method to conduct a logistic regression analysis on CD cells, routine blood tests, liver function, heart function, coagulation function, symptoms, and CT scores one by one to improve the practical application value.
In the current research, the factors related to the detection rate of nucleic acid mainly include the course of the disease and the sampling location. In the early stage of the course of disease, the detection rate of viral nucleic acid in respiratory tract samples is high; in the late stage of the disease, the detection rate of nucleic acid in gastrointestinal samples is also high. Therefore, this study further stratified the subjects: the patients were divided based on their nucleic acid sampling sites into the respiratory tract sample group and the digestive tract sample group. The nucleic acid detection time data of the patients were limited to the early stage of the disease, that is, 14 days before the onset, to reduce confounding factors.
2. Research dataThis is a retrospective logistic regression analysis. From January 18, 2020 to January 24, 2021, we collected the clinical data of biomarkers, clinical symptoms, and CT images that were recorded for several days in the early course of the disease, and there were 116 confirmed cases of COVID-19 and asymptomatic infections in Zhuhai. The nucleic acid test results of that day were also recorded. All patients met the definition standard of COVID-19, including “SARS-CoV-2 nucleic acid real-time polymerase chain reaction (RT-PCR) test positive” to determine either confirmed cases or asymptomatic infected persons based on the COVID-19 diagnosis and treatment protocol of the National Health Commission of the People’s Republic of China (trial version 8).
2.1. Comparisons of the group classification and definitionAccording to the results of the RT-PCR, biomarkers, clinical symptoms and imaging examination in the early stage of the disease, we divided the patients into 4 groups: the respiratory tract specimen nucleic acid-positive group, respiratory tract specimen nucleic acid-negative group, digestive tract specimen nucleic acid-positive group, and digestive tract specimen nucleic acid-negative group. Among them, a positive respiratory tract specimen was defined when at least the pharyngeal swab or nasopharynx swab, or both, was positive, and a positive digestive tract specimen was defined when the anal swab was positive.
The nucleic acid-positive respiratory tract samples group was defined when the respiratory tract samples are positive for SARS-CoV-2 RT-PCR on a certain day, and we evaluated the corresponding biomarkers, clinical symptoms and imaging examination values. The other 3 groups were defined by analogy. When collecting the sample data, each case included the data, such as the nucleic acid test results, and biomarkers that were evaluated for at least 1 day.
2.2. Sample collection and testingThe sample collection was mainly completed by the medical staff of the Fifth Affiliated Hospital of Sun Yat-sen University, the designated hospital for treating patients with infectious diseases in Zhuhai. The types of samples that were evaluated in the statistics include respiratory tract samples (pharyngeal swabs, nasopharyngeal swabs) and digestive tract samples (anal swabs). The testing institutions included the Zhuhai Center for Disease Prevention and Control and the Fifth Affiliated Hospital of Sun Yat-sen University. The detection method was SARS-CoV-2 RT-PCR. The test kit was provided by 6 companies (Sun Yat-sen University Daan Gene, Jiangsu Shuoshi Biotechnology, Shanghai Huirui Biotechnology, Innotech Biology, Shanghai Zhijiang Biology, and Shanghai Berger Medical Technology). The Zhuhai Centers for Disease Control and Prevention rechecked and confirmed all positive results. The study was approved by Medical research ethics committee of Zhuhai Center for Disease Control and Prevention.
3. Research methodsAccording to the research objectives, this study uses the case-case-time-control design method. The case-case-time-control design is a case-only design.[11–13] By selecting future cases as controls, selection bias can be reduced, but there is also a certain time effect bias. Therefore, this method is mainly applicable to studies where the outcome variables will not affect the next outcome. The study was approved by the Medical research ethics committee of Zhuhai Center for Disease, Guangdong, China, and conducted in accordance with the Declaration of Helsinki. All patients gave signed informed consent before being included in the study.
4. Statistical methodsLASSO is a variable selection method proposed by statistician Robert Tibshirani in 1996. Compared with traditional regression methods, LASSO regression can handle more potential predictive variables and select the variables most relevant to the disease. Therefore, LASSO is used for screening disease risk factors and establishing predictive models, often combined with binary logistic regression.[14–17]
All the data were processed with SPSS 22.0 and SPSSPRO for statistical analysis. The preliminary screening of variables was conducted using LASSO regression analysis. Multiple logistic binary regression analysis was performed on indicators with coefficients other than 0. The 5 subindicators and biomarkers (CD cells, routine blood examination, liver function, cardiac function, and coagulation function), clinical symptoms and CT images were analyzed, and the correlation between these variables and the detection results of the nucleic acid tests (respiratory tract samples or digestive tract samples) was analyzed. P < .05 was considered statistically significant. Finally, the discrimination of the model was quantified by the AUC.
5. Research resultsA total of 120 patients were included in the study, of which 4 patients with several missing laboratory parameters were excluded. Finally, 116 patients were included, and there was a total of 605 days of nucleic acid detection days used to evaluate the biological samples and the corresponding biomarkers, clinical symptoms, and imaging examination values. Among them, 332 days were included in the positive nucleic acid test group, and 273 days were included in the negative nucleic acid test group. Each data point could include one or more of the groups of biomarkers or clinical symptoms and imaging examination data.
The general data of each group were compared,[18] and the study included 63 males and 53 females. The patients’ average age was 37.6 years (1–80). The main clinical symptoms were fever (91/116, 78.4%) and dry cough (73/116, 62.9%). Additionally, 25.9% (30/116) of the patients had chronic diseases. We also found that 64.7% (75/116) of the patients had moderate COVID-19, 16.4% of the patients had severe and critical disease, and 15.5% of the patients were mild cases. The difference was not statistically significant and comparable (see Table 1).
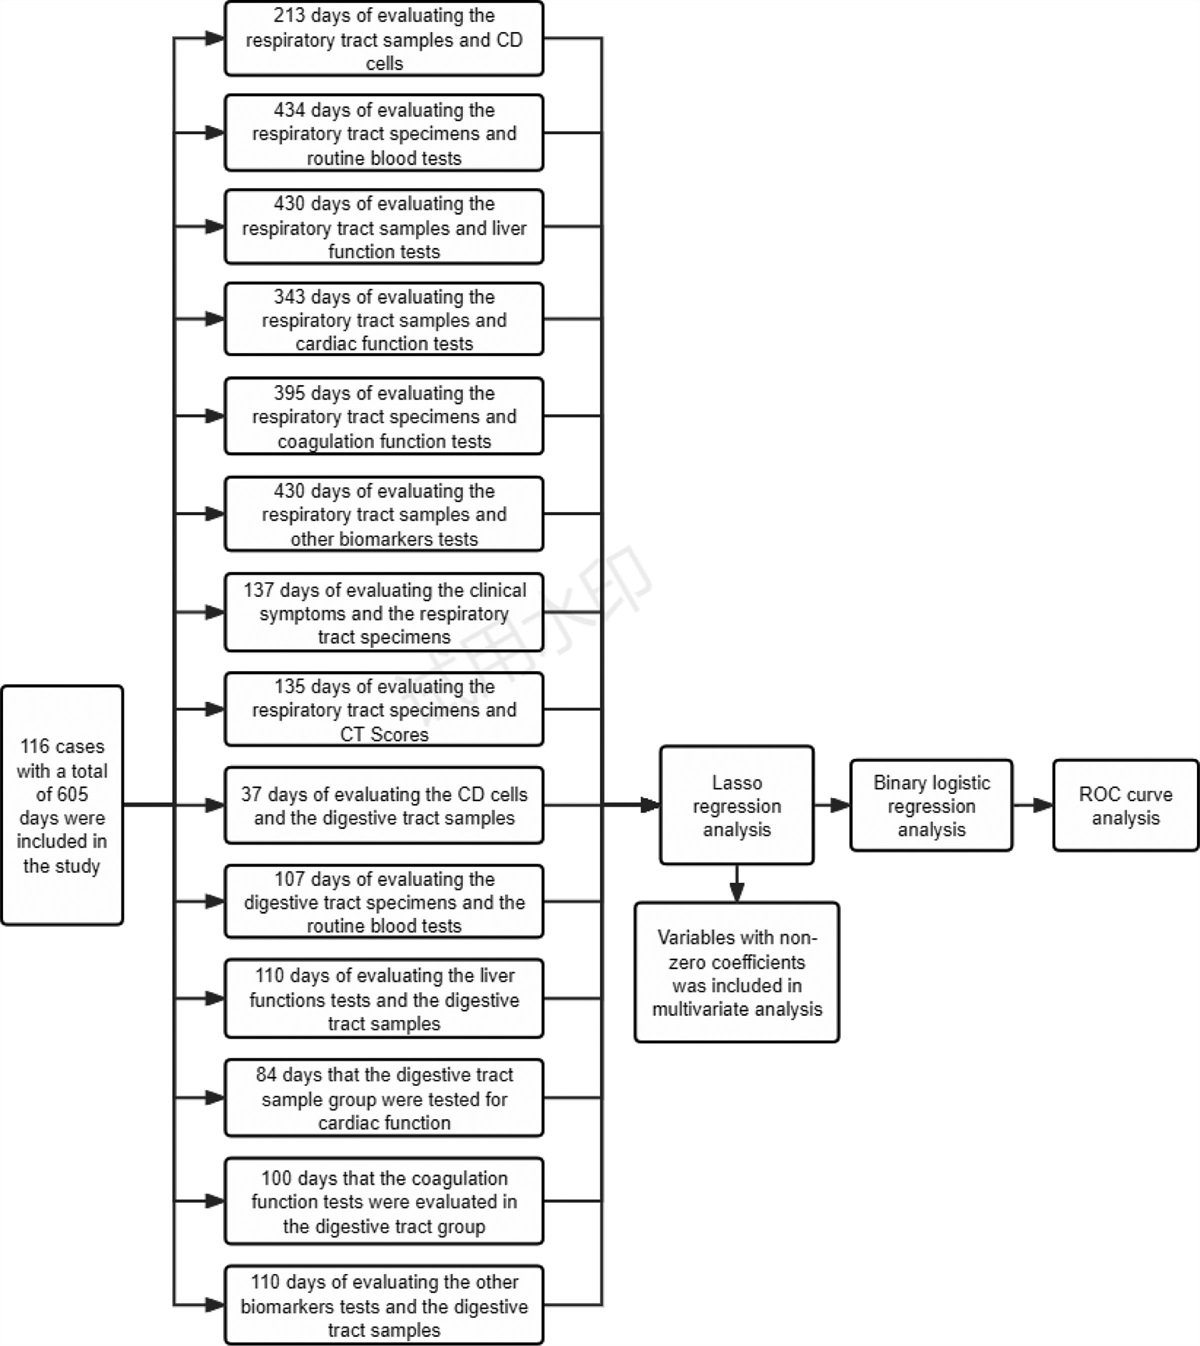
Table 1 - The clinical characteristics of the study cohort. Classification Number of cases (N = 116) Nucleic acid detection days (N = 605) Nucleic acid-positive days (N = 332) Nucleic acid-negative days(N = 273) P (nucleic acid-positive days vs nucleic acid-negative days) Age <18 21 99 55 44 .936 19–40 58 312 169 143 >40 37 194 108 86 Gender Male 63 327 176 151 .572 Female 53 278 156 122 Basic disease/past history Hypertension 17 42 20 22 .481 Coronary heart disease 6 21 10 11 .771 Chronic bronchitis 13 40 18 22 .337 Severity Asymptomatic patient 4 13 6 7 .831 Mild 18 64 30 34 Ordinary type 75 468 253 215 Severe 16 50 26 24 Critical 3 10 5 5Since all of the biomarkers, clinical symptoms, and imaging values could not be detected every day for the 605 nucleic acid detection days, the independent variables were further subdivided according to the second-level indicators. The dependent variables were subdivided into the respiratory tract nucleic acid results and digestive tract nucleic acid results. The first-level indicators included the biomarkers, clinical symptoms, and imaging examination; the second-level indicators included the CD cells, routine blood tests, liver function tests, cardiac function tests, coagulation function tests, the symptoms, and the CT score. In terms of the respiratory tract nucleic acid detection days, 213 data points reported the CD cell levels, 434 data points reported the routine blood test levels, 430 data points reported the liver function levels, 343 data points reported the cardiac function levels, 395 data points reported the coagulation function levels, 137 data points reported the symptoms, and 135 data points reported the CT scores. Compared with the detection of SARS-CoV-2 nucleic acid in the respiratory tract samples, the detection of SARS-CoV-2 nucleic acid in digestive tract samples was less, as shown in Figure 1.
 Figure 1.:
 Logistic regression analysis of the factors related to the nucleic acid detection rate in the respiratory tract and digestive tract samples.
5.1. Two groups of experimental parametersAccording to the literature review,[19–21] lymphocytes, platelets, D-dimer, lactate dehydrogenase, C-reactive protein, aspartate aminotransferase, alanine aminotransferase, creatinine, procalcitonin, interleukin-6, and CK-MB in biomarkers have been considered to be related to the nucleic acid detection rate or disease severity of COVID-19 patients. Therefore, we collected these laboratory parameters of the research subjects. Due to the limited conditions, the evaluation of interleukin-6 was not included in this study. In addition, we also analyzed some less studied indicators in the routine blood tests, coagulation function tests, liver function tests, cardiac function tests, and T-cell subsets.
5.2. LASSO regression analysisWe used LASSO regression (a shrinkage estimation method) to reduce data dimensionality, and we used tenfold cross-validation to select the penalty term lambda (λ) to identify potential predictive factors related to the rate of nucleic acid detection. Thirty variables with nonzero coefficients, including routine blood tests, coordination function tests, live function tests, cardiac function tests, and T-cell subsets, were subsequently identified. The LASSO coefficient values for 30 potential variables are shown in Tables 2 and 3. When the error of the model was minimized, 30 variables were selected for further logistic regression analysis.
Table 2 - LASSO regression analysis of the factors related to the detection rate of nucleic acids in COVID-19 of samples from the digestive tract. Classification index Coefficient λ Log (λ) CD cell n = 12 0.020 –3.902 Intercept 0.514 CD3 –0.001 CD4 <0.001 CD8 0.002 Liver function n = 37 0.121 –2.110 Intercept 0.212 AST –0.003 Total bilirubin –0.002 Creatinine 0.002 LDH <0.001 CK –0.002 CK-MB 0.011 CRP –0.001 Coagulation function n = 26 0.020 –3.902 Intercept –0.460 Prothrombin time 0.060 D-dimer <0.001AST = aspartate aminotransferase, CRP = C-reactive protein, LASSO = Least Absolute Shrinkage and Selection Operators, LDH = lactate dehydrogenase.
AST = aspartate aminotransferase, CRP = C-reactive protein, LASSO = Least Absolute Shrinkage and Selection Operators, LDH = lactate dehydrogenase, PCT = procalcitonin.
After LASSO regression analysis, 30 indicators with coefficients other than 0 were included in the multivariate analysis. Binary logistic regression analysis revealed that hemoglobin, platelet count, eosinophil count, and cough status were independent factors for predicting the detection rate of nucleic acid in respiratory samples (P < .05; Table 4). In the digestive tract samples, no independent factor was found to predict the nucleic acid detection rate (P > .05; Table 5).
Table 4 - Multivariate logistic regression analysis of the nucleic acid detection rate of respiratory tract samples. Classification index B SE WALD P OR 95% CI Lower limit Upper limit CD cell CD3 –0.001 0.001 0.532 .466 0.999 0.998 1.001 CD4 0.000 0.000 0.586 .444 1.000 1.000 1.001 CD8 0.000 0.002 0.003 .955 1.000 0.997 1.003 Routine blood test Leukocyte –0.009 0.294 0.001 .975 0.991 0.557 1.763 Hemoglobin 0.020 0.006 10.283 .001 1.020 1.008 1.033 Platelet –0.003 0.002 5.000 .025 0.997 0.994 1.000 Neutrophil count –0.243 0.324 0.565 .452 0.784 0.416 1.479 Lymphocyte 0.152 0.378 0.161 .688 1.164 0.555 2.441 Neutrophil to lymphocyte ratio 0.093 0.047 3.802 .051 1.097 1.000 1.204 Eosinophils –4.149 1.493 7.726 .005 0.016 0.001 0.294 PCT 1.594 1.221 1.703 .192 4.921 0.449 53.898 Liver function ALT –0.002 0.004 0.128 .721 0.998 0.990 1.007 Total bilirubin 0.009 0.013 0.535 .465 1.010 0.984 1.035 LDH 0.001 0.002 0.132 .716 1.001 0.996 1.005 CK 0.001 0.002 0.540 .462 1.001 0.998 1.005 CRP 0.010 0.006 2.509 .113 1.010 0.998 1.022 Coagulation function D-dimer 0.000 0.000 0.443 .506 1.000 1.000 1.000 Symptom Cough 0.902 0.424 4.532 .033 2.465 1.074 5.655ALT = alanine aminotransferase, AST = aspartate aminotransferase, CRP = C-reactive protein, LDH = lactate dehydrogenase, PCT = procalcitonin.
An ROC analysis was performed on the single risk factors and protective factors (hemoglobin, platelets, eosinophils, and cough in the respiratory tract samples) that were evaluated in the multivariate analysis. The ROC curve is shown in Figure 2. According to the AUC, 3 variables were statistically significant (P < .05). In the respiratory tract specimens, hemoglobin, 0.563; platelets, 0.614; eosinophils, 0.642 were significant, but cough was excluded due to its
留言 (0)