
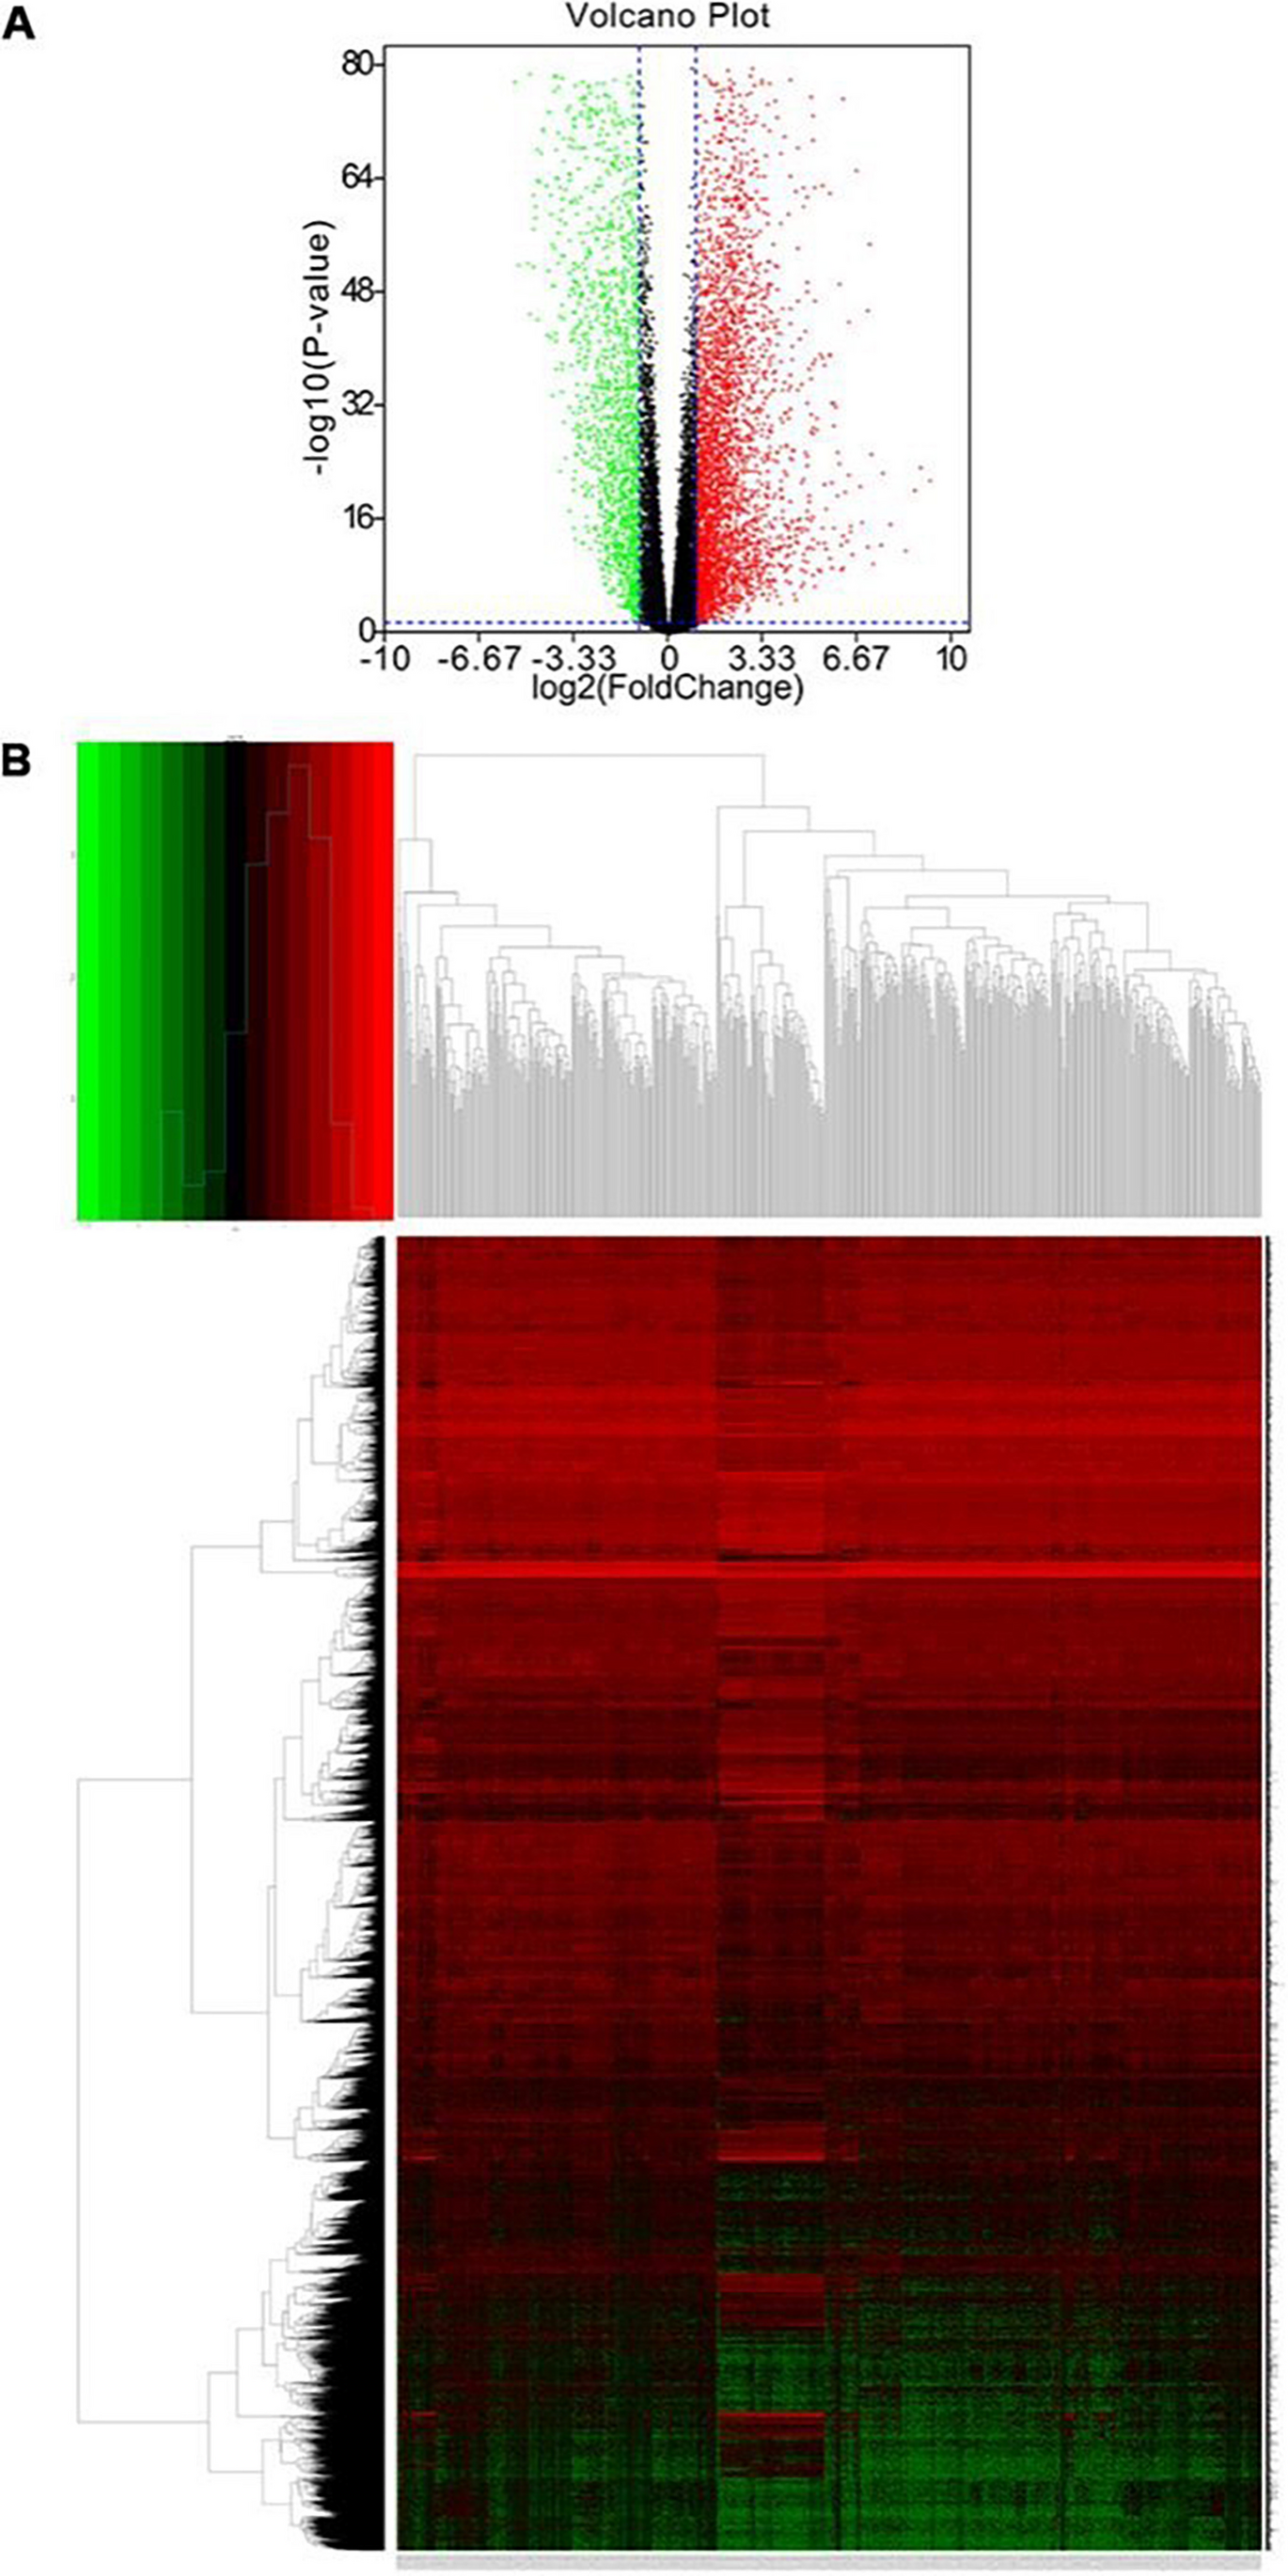
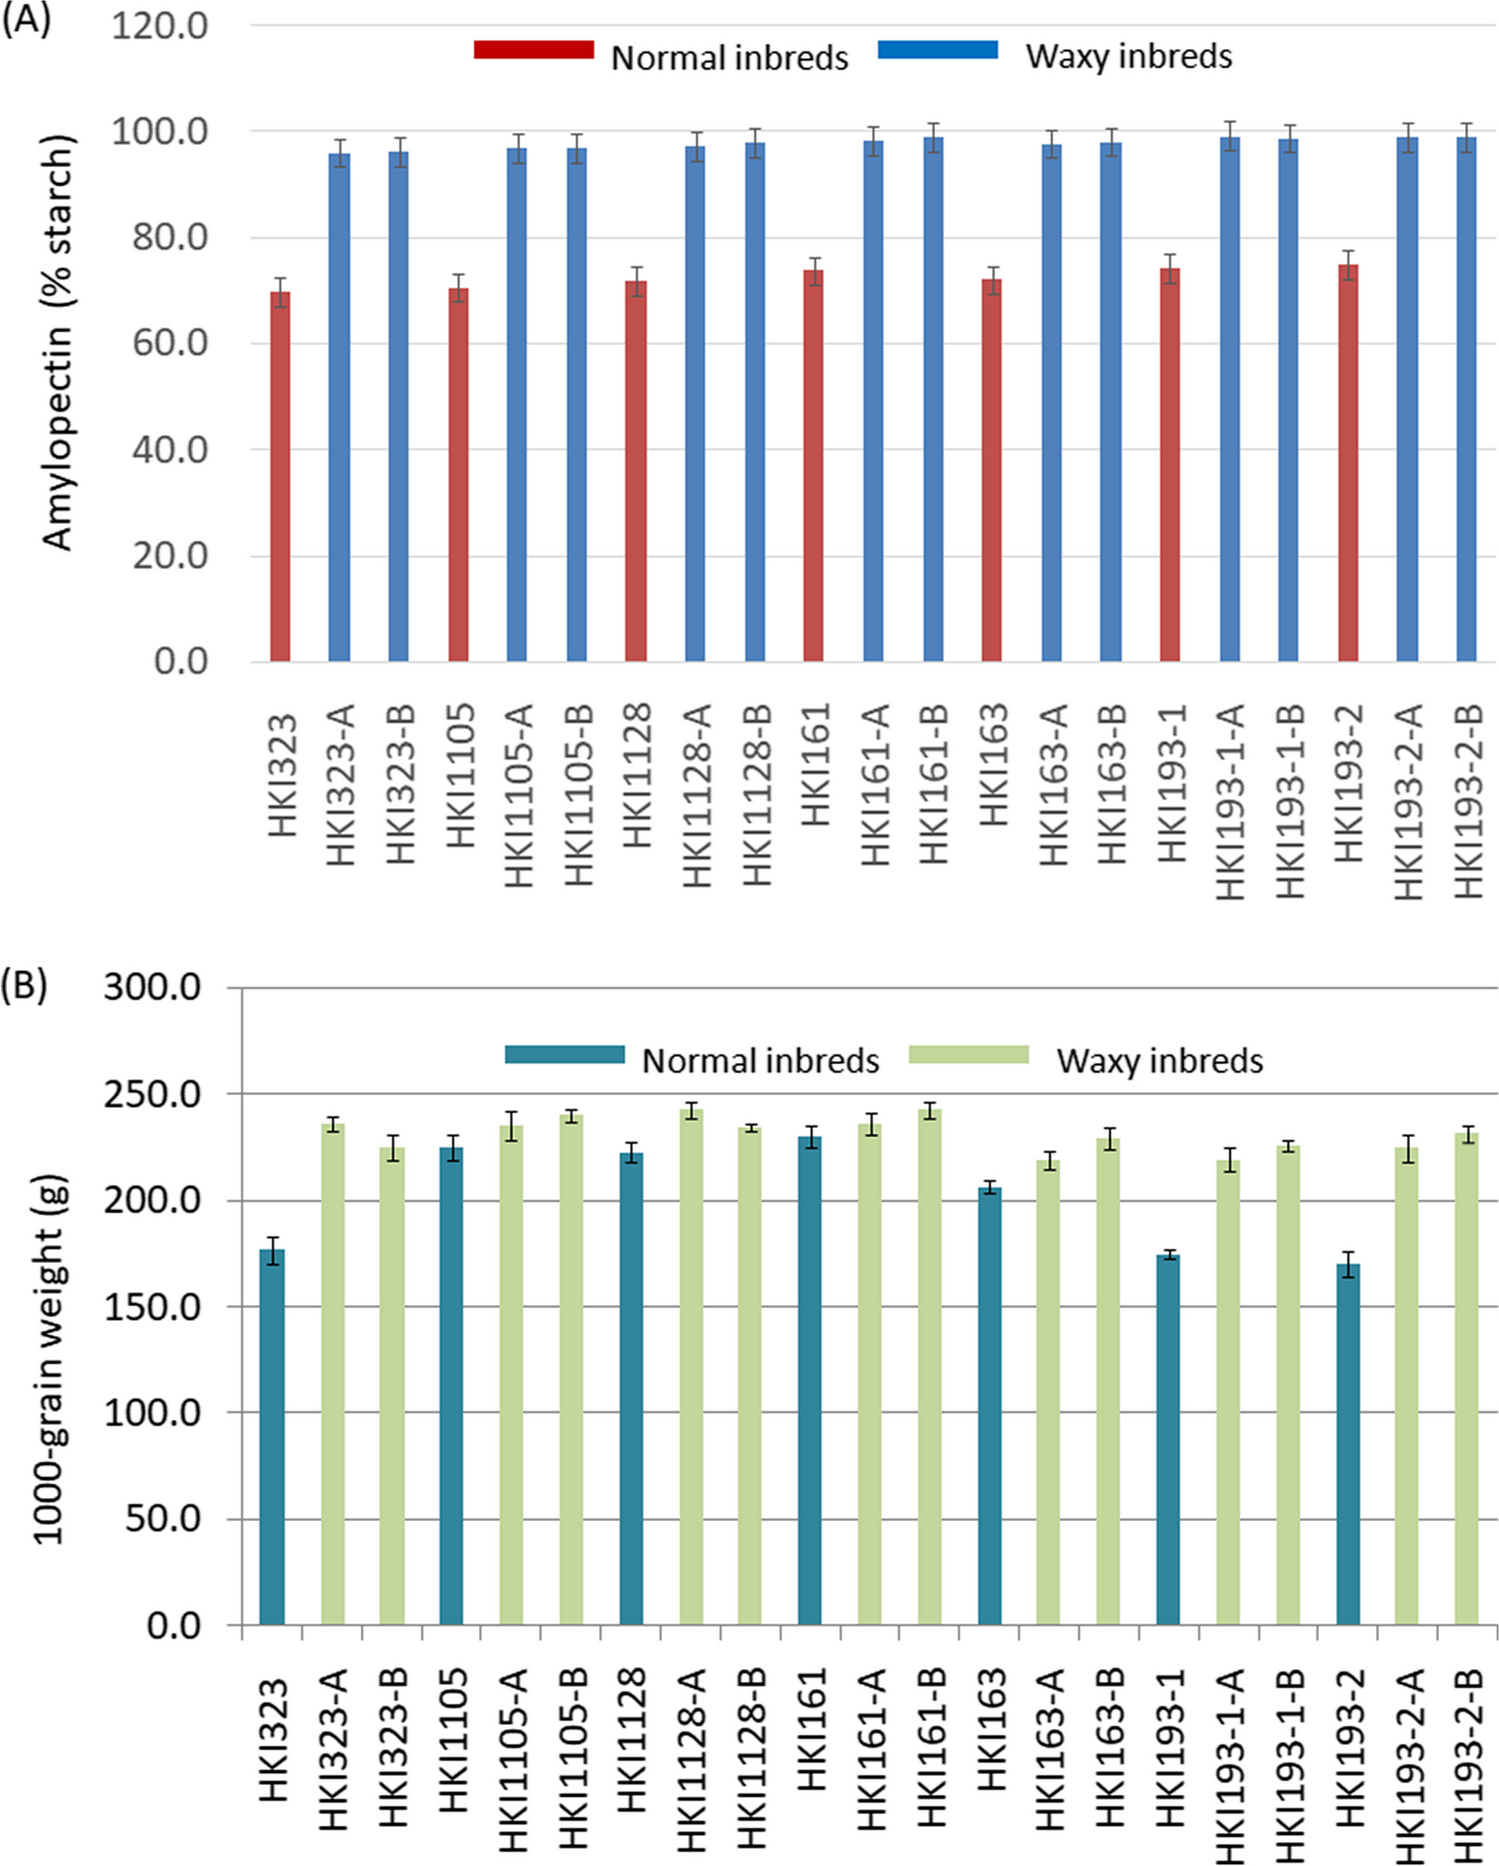
記住我
Appropriate sigma factor genes were cloned into a pET28a derivative containing His8-SUMO tag between NdeI and Bpu1102I restriction sites (see Materials and Methods for details and Fig. 1A). Gene expression was driven from a T7 RNA polymerase dependent promoter. DNA fragments for cloning were amplified from wild type E. coli chromosomal DNA with several exceptions (described below).
Since rpoN (σN encoding gene) contains a Bpu1102I site close to its 5’ terminus, an amplification primer was designed to introduce a silent mutation destroying that site. Similarly, rpoH (σH encoding gene) contains a Bpu1102I site at its 3’ terminus. In this case, a silent mutation was introduced by amplification of two separate fragments by PCR and then combining them into one fragment in a final PCR reaction. In case of rpoD (σD encoding gene), which contains both NdeI and Bpu1102I sites in its native sequence, a DNA fragment carrying silent mutations at these sites was obtained commercially (GeneArt service, Thermo Fisher Scientific; sequence provided in Supplementary Data) and used as template for subsequent PCR amplification and cloning. All DNA constructs obtained were verified by sequencing.
Sigma factor purification: general protocolThe plasmids obtained were introduced into BL21(λDE3) strain carrying T7 RNAP gene under an IPTG inducible promoter. To verify expression, appropriate strains were first grown in 20 ml of LB at 32 °C to OD600~0.4 upon which IPTG was added to 1 mM and growth was continued for 4 h. Cell samples were removed at every hour, and protein content was monitored by SDS-PAGE. In most cases, overexpressed protein accumulation reached saturation at 3–4 h after induction (Fig. 1B and data not shown). Thus, for large-scale sigma factor overproduction, 3.5-h induction was used in general.
In our first attempts to purify E. coli RNAP sigma factors, we employed a standard procedure for His8-SUMO tagged proteins used in our laboratory, based on ion metal affinity chromatography (IMAC) (e.g., [Sobala et al. 2019]); see Materials and Methods for details). Briefly, the cells are grown in 250 ml of LB to OD600~0.4 at 32 °C, induced with IPTG, and then collected by centrifugation and frozen. The cell pellets are then resuspended in a lysis buffer, sonicated, and supernatants are applied to a column preloaded with Ni2+-NTA resin. Upon several washes with a buffer containing low concentration of imidazole (20 mM), the desired proteins are eluted with a buffer containing high imidazole concentration (250 mM), and dialyzed overnight in a buffer that allows for Ulp1 SUMO protease activity, which is used at a subsequent step to remove the His8-SUMO tag from purified sigma factors. Since the protease itself is also His-tagged, passing the whole sample through another Ni2+-NTA resin column allows for removal of both, the cleaved His8-SUMO tag, and the protease. In addition, if the prep is contaminated with proteins that interact with the resin but that were not removed at previous steps (i.e., they were not removed by washes of the first column), that second column allows for such clean-up. The flow-through sample is then collected, the column is washed with a small volume of the same buffer to elute unbound proteins present in the column dead volume, the pooled sample is concentrated, and the buffer is exchanged for sigma factor storage buffer (1 x TGED).
This procedure worked very well for overexpression and purification of σD, σE, σS, and σN (Fig. 2). However, in case of σF, σH, and σFecI, some modifications had to be introduced since the preps obtained by the general procedure described above contained substantial amounts of co-purified other proteins (Fig.3 and Fig.S1–2).
Fig. 2
Purification of sigma factors by employing the general purification protocol. A σD, B σE, C σN, and D σS, as visualized by Coomassie blue-stained SDS-PAGE (10–20%). M, Perfect Tricolor protein ladder (Eurx); 1, uninduced cells; 2, lysate obtained after 3.5-h IPTG induction; 3, sample obtained after sonication; 4, supernatant after centrifugation step; 5, flow-through upon column loading with supernatant; 6, flow-through after applying first portion of wash-buffer; 7, flow-through after applying second portion of wash-buffer; 8, elution, first fraction; 9, elution, second fraction; 10, elution, third fraction; 11, sample after dialysis; 12, after Ulp1 addition; 13, flow-through after applying sample to the column; 14, 2 μl of the sample concentrated with the Amicon filtration device (10 MWCO); 15, 5 μl of the same sample as in 14. Molecular weights of the marker bands are indicated on the left of each gel
Fig. 3
Purification of σF by employing modified general purification protocol. Lanes marked as M and 1–15 are the same as described in Fig.2. Lane 13’, flow-through upon dilution of sample from lane 15 and another loading on the column; 14’, 2 μl of the sample run in 13’ but concentrated with the Amicon filtration device (10 MWCO); 15’, 5 μl of the same sample as in 14’. See Materials and Methods for details. Molecular weights of the marker bands are indicated on the left of each gel
Purification of σFHere, many protein contaminants were still present after the second column and His8-SUMO tag removal (Fig. 3, lanes 13–15). We suspected that some of these contaminants were enriched after column dead-volume wash and thus we applied a rather simple remedy—the final sample was diluted in a large volume (12 ml) of the 1 x TGED buffer, and the whole sample was re-applied onto fresh Ni2+-NTA resin. Only the flow-through fraction was this time collected and then concentrated. As shown in Fig. 3 (lanes 13’–15’), most of the high-molecular weight proteins were removed. Although this resulted in σF losses, the sample purity was enhanced.
σH and σFecI purificationThese two sigma factors were the most difficult to purify due to the prep’s high contamination with co-purified proteins when applying the general purification procedure (Fig. S1A and S2).
In case of σH, we suspected that the contaminants were in large part chaperone proteins (such as DnaK, DnaJ, GrpE, and/or GroEL/GroES) that bind σH under non-heat shock conditions to prevent its activity [Arsène et al. 2000; Guisbert et al. 2004]. Such interactions were reported in other papers dealing with σH purification [e.g., Liberek et al. 1992]. On the other hand, it was reported that chaperone (DnaK) contamination of a given protein prep could be overcome by adding ATP, Mg2+, and denatured proteins to the wash buffer [Rial and Ceccarelli 2002]. These allow for the chaperone unbinding from σH and binding to their preferred substrates, i.e., the added denatured proteins. In our case, this procedure helped in removing some, but not all of the co-purified proteins (Fig. S1B).
We thus decided to undertake a different approach, where in addition to the steps just described, we applied denaturing conditions to unbind proteins that specifically and tightly interact with σH. Thus, 6M guanidine hydrochloride buffer was used to wash the resin with bound His-tagged proteins. The His8-SUMO tagged σH was then eluted under the same conditions and was brought back to its native state by subsequent dialysis in buffers with decreasing concentrations of another denaturant, i.e. urea. The ensuing steps (His8-SUMO tag cleavage and following procedures) were the same as in the general protocol. This way, we finally succeeded in obtaining pure σH protein preps (Fig. 4A).
Fig. 4
Purification of σH and σFecI by employing denaturing conditions. A σH, B σFecI, as visualized by Coomassie blue-stained SDS-PAGE (10–20%). M and M’, Perfect Tricolor protein ladder (Eurx); 1, uninduced cells; 2, lysate obtained after 3.5-h IPTG induction; 3, sample obtained after sonication and subsequent centrifugation; 4, flow-through; 5, flow-through after applying first portion of wash buffer; 6, flow-through after applying second portion of wash buffer; 6’, flow-through after applying ATP/Mg2+/denatured proteins (for σH only, see Materials and Methods for details); 7, sample after dialysis; 8, after Ulp1 addition; 9, flow-through after applying sample to the column; 10, 5 μl of the sample concentrated with the Amicon filtration device (10 MWCO),; 11, 10 μl of the same sample as in 10. Molecular weights of the marker bands are indicated on the left of each gel
In case of σFecI, upon initial purification, we observed contamination with many proteins, among which four were predominant (~20 kDa, ~35 kDa, ~75 kDa, and ~180 kDa, Fig. S2). It is known that σFecI tightly interacts with FecR (35 kDa) which in turn also interacts with FecA (85 kDa) [Enz et al. 2000]. The apparent molecular weights of two of the co-purified proteins roughly correspond to FecR and FecA, although their identity remains unresolved.
In our first attempt at obtaining pure σFecI, we decided to increase salt concentration of the wash buffer to 1 M as this sometimes helps to remove unwanted interactions (see, e.g., [Sobala et al. 2019]). However, this did not yield any improvement (data not shown). Thus, we undertook the same approach as for σH, i.e., 6M guanidine hydrochloride was used to denature and unbind any potential proteins directly and tightly interacting with σFecI. In this case, the procedure turned out to be more successful, although some proteins still co-purified with this sigma factor (Fig. 4B).
Protein yields and sample purityProtein yields for each sigma factor, calculated per 1 g of cell wet weight, are given in Table 1. To assess sample purity, preps of the final purified proteins were resolved by SDS-PAGE, which was followed by Coomassie blue-staining and densitometry (Fig. 5 and Table 1). It should be noted that it is known that sigma factors migrate differently in SDS-PAGE than it would be expected from their molecular weight [Helmann 2019]. For example, σD whose molecular weight is 70 kDa migrates around 90 kDa. Similarly, σN migrates much slower than expected for a 54 kDa protein.
Table 1 Examples of protein yields obtained for each sigma factor that was purified in this study. OD600 values given correspond to optical density of cell culture at the point that IPTG induced cells were harvested. The IPTG induction was initiated at OD600~0.4, and was carried out for ~3.5 h. Purity was assessed by densitometry of Coomassie blue-stained gelsFig. 5
Purified sigma factors visualized by Coomassie blue-stained SDS-PAGE (10–20%). M, Perfect Tricolor protein ladder (Eurx); D, σD (M.w. ~70 kDa); N, σN (M.w. ~54 kDa); S, σS (M.w. ~38 kDa); H, σH (M.w. ~32 kDa); F, σF (M.w. ~28 kDa); E, σE (M.w. ~24 kDa); FecI, σFecI (M.w. ~19 kDa). About 1.5 μg of each protein were loaded per lane. Molecular weights of the marker bands are indicated on the left of the gel
When taking into account the amount of protein obtained per 250 ml of IPTG induced cell culture, the highest amount was obtained for σD. E. coli culture overexpressing that sigma factor also grew the best after IPTG addition. On the other hand, when looking at the overall yield that takes into account cell mass (expressed as mg protein/1 g cell wet weight), it is evident that the highest yield was obtained for σE. Induction of that factor’s overproduction had a significantly detrimental effect on cell growth; however, σE production had proceeded nonetheless (data not shown). For five sigma factors (σD, σE, σH, σN, σS), sample purity was ≥ 93%, with the highest purity obtained for σD and σH (98%).
The least efficient was σF purification even though its overproduction did not severely impair growth. In order to obtain higher amounts of σF, larger cell culture volumes and/or longer induction times, growing cells at different temperatures, using different IPTG concentrations or inducing at different OD values should be used in the future and efforts taken to increase sample purity, such as employing a gel filtration or ion exchange column, instead of simply reloading sample on the nickel column after SUMO-tag removal. The same is true for σFecI whose purity was the lowest. Nevertheless, we deemed the obtained protein preps to be much increased in purity in comparison to the general protocol first used and decided to proceed with assessment of the activity of all sigma factor samples.
Assessment of the purified sigma factor activityIn order to assess whether the purified sigma factors obtained are active, i.e., whether they could form a functional holoenzyme with core RNAP, we employed EMSA assays. Here, each sigma factor was pre-incubated with core RNAP to form the holoenzyme, and then appropriate Cy5-labeled DNA template was added. Promoter regions specifically recognized by each sigma factor were chosen based on literature reports and were as follows: greAp1-p4 promoter region for σD and σE [Potrykus et al. 2010; Dylewski et al. 2019]; pflgM for σF [Park et al. 2001]; pgroE for σH [Nonaka et al. 2006; Wade et al. 2006]; p4relA for σN [Brown et al. 2014]; pxapA for σS [Maciag et al. 2011]; and pfecA for σFecI [Enz et al. 2003].
The samples were then loaded onto a running native PAGE, and a shift in the DNA’s electrophoretic migration indicated that a given DNA fragment was bound by proteins in the sample. As control, samples with core RNAP only or sigma factor only were also included. A shift in band migration occurring with the holoenzyme, but not with these factors alone, indicates that the interaction is specific to the whole complex, and thus the sigma factor under investigation is active in recognizing its corresponding promoter region when bound in the holoenzyme.
As can be seen in Fig. 6, all sigma factors purified here were able to form a functional holoenzyme with core RNAP. Band shifts were observed for all σ-core RNAP complexes, even for σF, whose yield was the least efficient and purity was only 82%. In addition, to our knowledge, the pflgM promoter region used here for σF holoenzyme was never mapped experimentally nor in vitro transcription data was reported to date for this promoter; its -10 and -35 regions were only inferred from DNA sequence [Park et al. 2001]. Here, we cannot confirm that these regions were attributed correctly; nevertheless, we do confirm that this region contains a σF-dependent promoter that is recognized by RNAP holoenzyme in vitro and that the σF obtained is active in promoter recognition when combined with RNAP core enzyme.
Fig. 6
EMSA studies demonstrate that all purified sigma factors are capable of forming functional holoenzyme with core RNAP. Cy5-labeled promoter template was incubated with the E. coli core RNAP and/or with 10 or 20 fold molar excess of appropriate sigma factor over core RNAP, as indicated in the figure. Blue arrow and red asterisks denote positions of unbound DNA and major DNA-RNAP holoenzyme complexes, respectively
Another drawback could have been foreseen for σFecI whose yield was second to last and the prep was substantially contaminated with co-purified proteins (only 68% purity). As stated above, we speculate that one of those co-purified proteins might be FecR (M.w. 35 kDa). Interestingly, the σFecI interaction with FecR N-terminal domain was reported to be essential for σFecI functionality in transcription initiation [Ochs et al. 1995; Mahren et al. 2002]. It could be that fortuitously, the prep obtained might thus indeed contain the necessary σFecI partner, although not at stoichiometric concentrations, as judged by the Coomassie blue-stained SDS-PAGE gel (Fig. 4B and Fig. 5). However, that requires verification in future studies.
留言 (0)