
記住我
We included 576 participants, with equal numbers of Colombian (n = 288) and Mexican (n = 288) descent. Colombian participants were recruited through private neuropsychological and psychiatric centers, as well as events in local universities. They were assigned to a diagnostic or control group by means of screening for ADHD and a neuropsychiatric interview. Those from Mexico were part of the subsample MxGDAR-Encodat [17] from the Mexican National Survey of Tobacco, Alcohol, and Drug Use [18], which found an ADHD prevalence of 1.4% based on a questionnaire used to assign participants to the ADHD group. The controls for both samples were selected if they did not present ADHD or any of the other mental illnesses screened (Major Depressive Disorder, Generalized Anxiety Disorder, Suicidality, Psychotic Disorders, Panic Disorder, and substance use disorders). For all participants, informed consent was obtained before the start of each study. The research received approval from the institutional ethics committees involved (Universidad de La Sabana, approval number 67-05/04/2018; Instituto Nacional de Medicina Genómica, approval number 01/2017/I; Instituto Nacional de Psiquiatría Ramón de la Fuente Muñiz, approval number CEI/C/083/2015). It was carried out in accordance with the latest version of the Declaration of Helsinki, the code of conduct of the American Psychological Association (1992) [19], and the relevant laws of Mexico and Colombia.
Measurement toolsADHDA clinical diagnosis of ADHD was confirmed in the Colombian sample through a semi-structured neuropsychiatric interview, which explored the symptoms of different psychiatric illnesses based on the Diagnostic and Statistical Manual of Mental Disorders, fifth edition (DSM-V). In the Mexican sample, a questionnaire that inquired about the previous diagnosis of ADHD and other disorders helped to select the participants.
GenotypingGenomic DNA was isolated from buccal epithelial samples through distinct protocols: a modified salting-out method [17], implemented with a commercial kit (Qiagen, Redwood City, CA, USA), was employed for the Mexican sample, while a customized version of a manual salting-out method was applied for Colombian cohort [20, 21]. Using the manufacturer’s protocol, genotyping was performed in the Instituto Nacional de Medicina Genómica de México with the commercial Infinium PsychArray Beadchip v1.3 (Illumina, San Diego, CA, USA). Fluorescent intensities were measured with the iScan (Illumina, San Diego, CA, USA), transformed to genotypes with the GenomeStudio software (Illumina, San Diego, CA, USA), and converted to Plink format files [22, 23].
Quality control of genotypes was performed in the Plink software, with the following criteria considered: variant calling greater than 95%, a minor allele frequency (MAF) greater than 5%, a Hardy–Weinberg equilibrium with p values < 0.05, and remotion of variants with A/T or G/C alleles to avoid the flip strand effect [24]. Filial relationships were calculated with the King software [25], and samples that showed association up to 2 degrees were eliminated. These filters left 546 participants for subsequent analysis (Supplementary Table 1). Single-nucleotide polymorphisms (SNPs) were then LD-pruned (PLINK1.9; --indep 50 5 2) for inclusion in a Principal Component Analysis (PCA) using the PCAiR package in R (version 4.3.1) and a maximum likelihood estimation of individual global admixture proportions of five ancestries using the ADMIXTURE software [26].
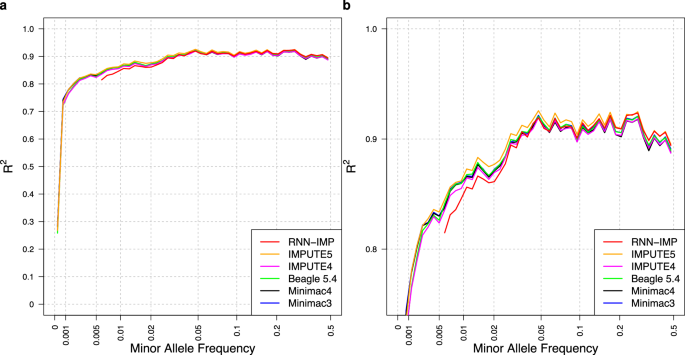
ImputationWe imputed the data following the TOPMed Imputation Server protocols [27]. The resulting files were filtered using an R2 INFO score threshold of 0.8 for imputed SNPs, MAF greater than 5%, and Hardy–Weinberg equilibrium with p values < 0.0005. We used the imputed data for downstream analysis.
Statistical analysisPrincipal component analysis (PCA)To identify the main directions of variation in the genetic data of the Colombian and Mexican samples with respect to reference populations, we performed a PCA with the PC-AiR package in R. For this, the reference populations of the 1000 Genomes Project – Phase 3 [28] were used and merged with our genotypes following the procedure previously cited [24, 29]. The first two principal components were chosen, and a graph was made in RStudio® to facilitate visualization of the results (Fig. 1a).
Fig. 1: Genetic distribution in the Colombian and Mexican samples.
a Principal Component Analysis of the samples with the reference populations. AFR African Ancestry, AMR American Ancestry, COL Colombia, EAS East Asian Ancestry, EUR European Ancestry, MEX Mexico, and SAS South Asian Ancestry. b Distribution of ancestry proportions in the Colombian cohort. c Distribution of ancestry proportions in the Mexican cohort. “Red” = European Ancestry, “Blue” = American Ancestry, “Yellow” = African Ancestry, “Green” = South Asian Ancestry, “Purple” = East Asian Ancestry
Global ancestryOnce the data from the microarray reader were extracted and converted, and the quality controls were applied, an analysis was performed with the ADMIXTURE software [26] to determine the global ancestry structure in the Colombian and Mexican samples. We performed cross-validation, which confirmed that the probable appropriate number of populations to calculate in an unsupervised analysis was five (Supplementary Fig. 1). Stacked bar charts summarizing the contribution of each of the five reference populations (European, East Asian, American, South Asian, and African) to the ancestry of the study samples are presented (Fig. 1b, c).
Population differentiation at known GWAS ADHD lociWright’s Fst was performed to assess the genetic variation among populations, specifically in the GWAS ADHD loci [15]. This analysis was conducted considering the 821 SNPs previously identified as risk factors for ADHD which previously indicated a p < 5*10e−8 in a large meta-analysis [15]. The test provides a comprehensive understanding of genetic differentiation, which can uncover distinct patterns acting on SNPs identified as being linked with ADHD.
Differential effects in risk at known GWAS ADHD loci between Colombia and MexicoThe Mantel–Haenszel test was conducted to examine whether there were differences in the association of specific polymorphisms with ADHD between the Colombian and Mexican samples. This test serves as a valuable mechanism to discern if there are distinct effects of the examined 821 SNPs on ADHD susceptibility in different cohorts (p-value threshold for significance: <6.0901e−05). Furthermore, we used the Breslow–Day test to assess the homogeneity of this association across subgroups. This contributed to understanding whether the identified SNPs exhibited consistent or disparate impacts across the two populations.
Genetic associations at known GWAS ADHD loci in Colombia and MexicoLogistic regression was employed to investigate potential associations between the previous genome-wide ADHD-linked variants (821 SNPs) [15] and ADHD diagnosis. The regression models were designed to account for potential confounding effects by incorporating covariates such as age, sex, and the first two principal components derived from the PCA (p-value threshold for significance: <6.0901e−05). This approach allowed for the exploration of relationships between genetic variants and ADHD susceptibility while controlling for relevant demographic factors.
Genetic associations at known GWAS ADHD loci with admixture proportionsWith the goal of investigating possible associations between genetic variants and global admixture proportions, aiming to elucidate the intricate interplay between ancestry and genetic susceptibility in the context of ADHD, we performed multiple linear regression analyses. In these, we used each of the global admixture proportions as the dependent variables, while the identified set of 821 SNPs served as independent predictors (p-value threshold for significance: <1.2180e−05).
Genome-wide association study (GWAS)After quality control and imputation, independent association analyses were conducted in each population using the Plink software [22]. The analysis includes age, sex, and the first two principal components as covariates. We meta-analyzed the data using METAL [30]. The general findings are presented and discussed in the results (suggestive significance = −log10(1e−5), genome-wide significance = -log10(5e–8)). For the GWAS, the suggestive significance at 5*10e−5, the sample size (Cases = 202, Controls = 344), the relative risk of the genotype at 1.5, and the disease allele frequency at 0.5, allowed us to have an expected power at 0.314. We estimate power using the Gas Power Calculator from the University of Michigan [31]. The power estimation graph is in Supplementary Fig. 2.
Local-ancestry aware GWASConducting local-ancestry aware GWAS between Colombia and Mexico is relevant to assessing the intricate genetic diversity within these geographic regions. This method allows for detecting the genetic ancestry background of the individuals in specific genomic segments. RFMix [14] was used to infer local ancestry in our populations based on the reference populations of the 1000 Genomes Project – Phase 3 [28]. Further, we implemented a local-ancestry aware GWAS using Tractor [8] to perform a genetic association of each genetic variant adjusting for the ancestral genetic background in the specific genomic segments. Using a regression model that considers local ancestry, Tractor provides accurate ancestry-specific effect-size estimates and P values for each ancestral background. Age, sex, and the two principal components were also included as covariates; a comparison with the GWAS is presented in Fig. 4. The results were plotted with the fastman R package.
留言 (0)