
記住我


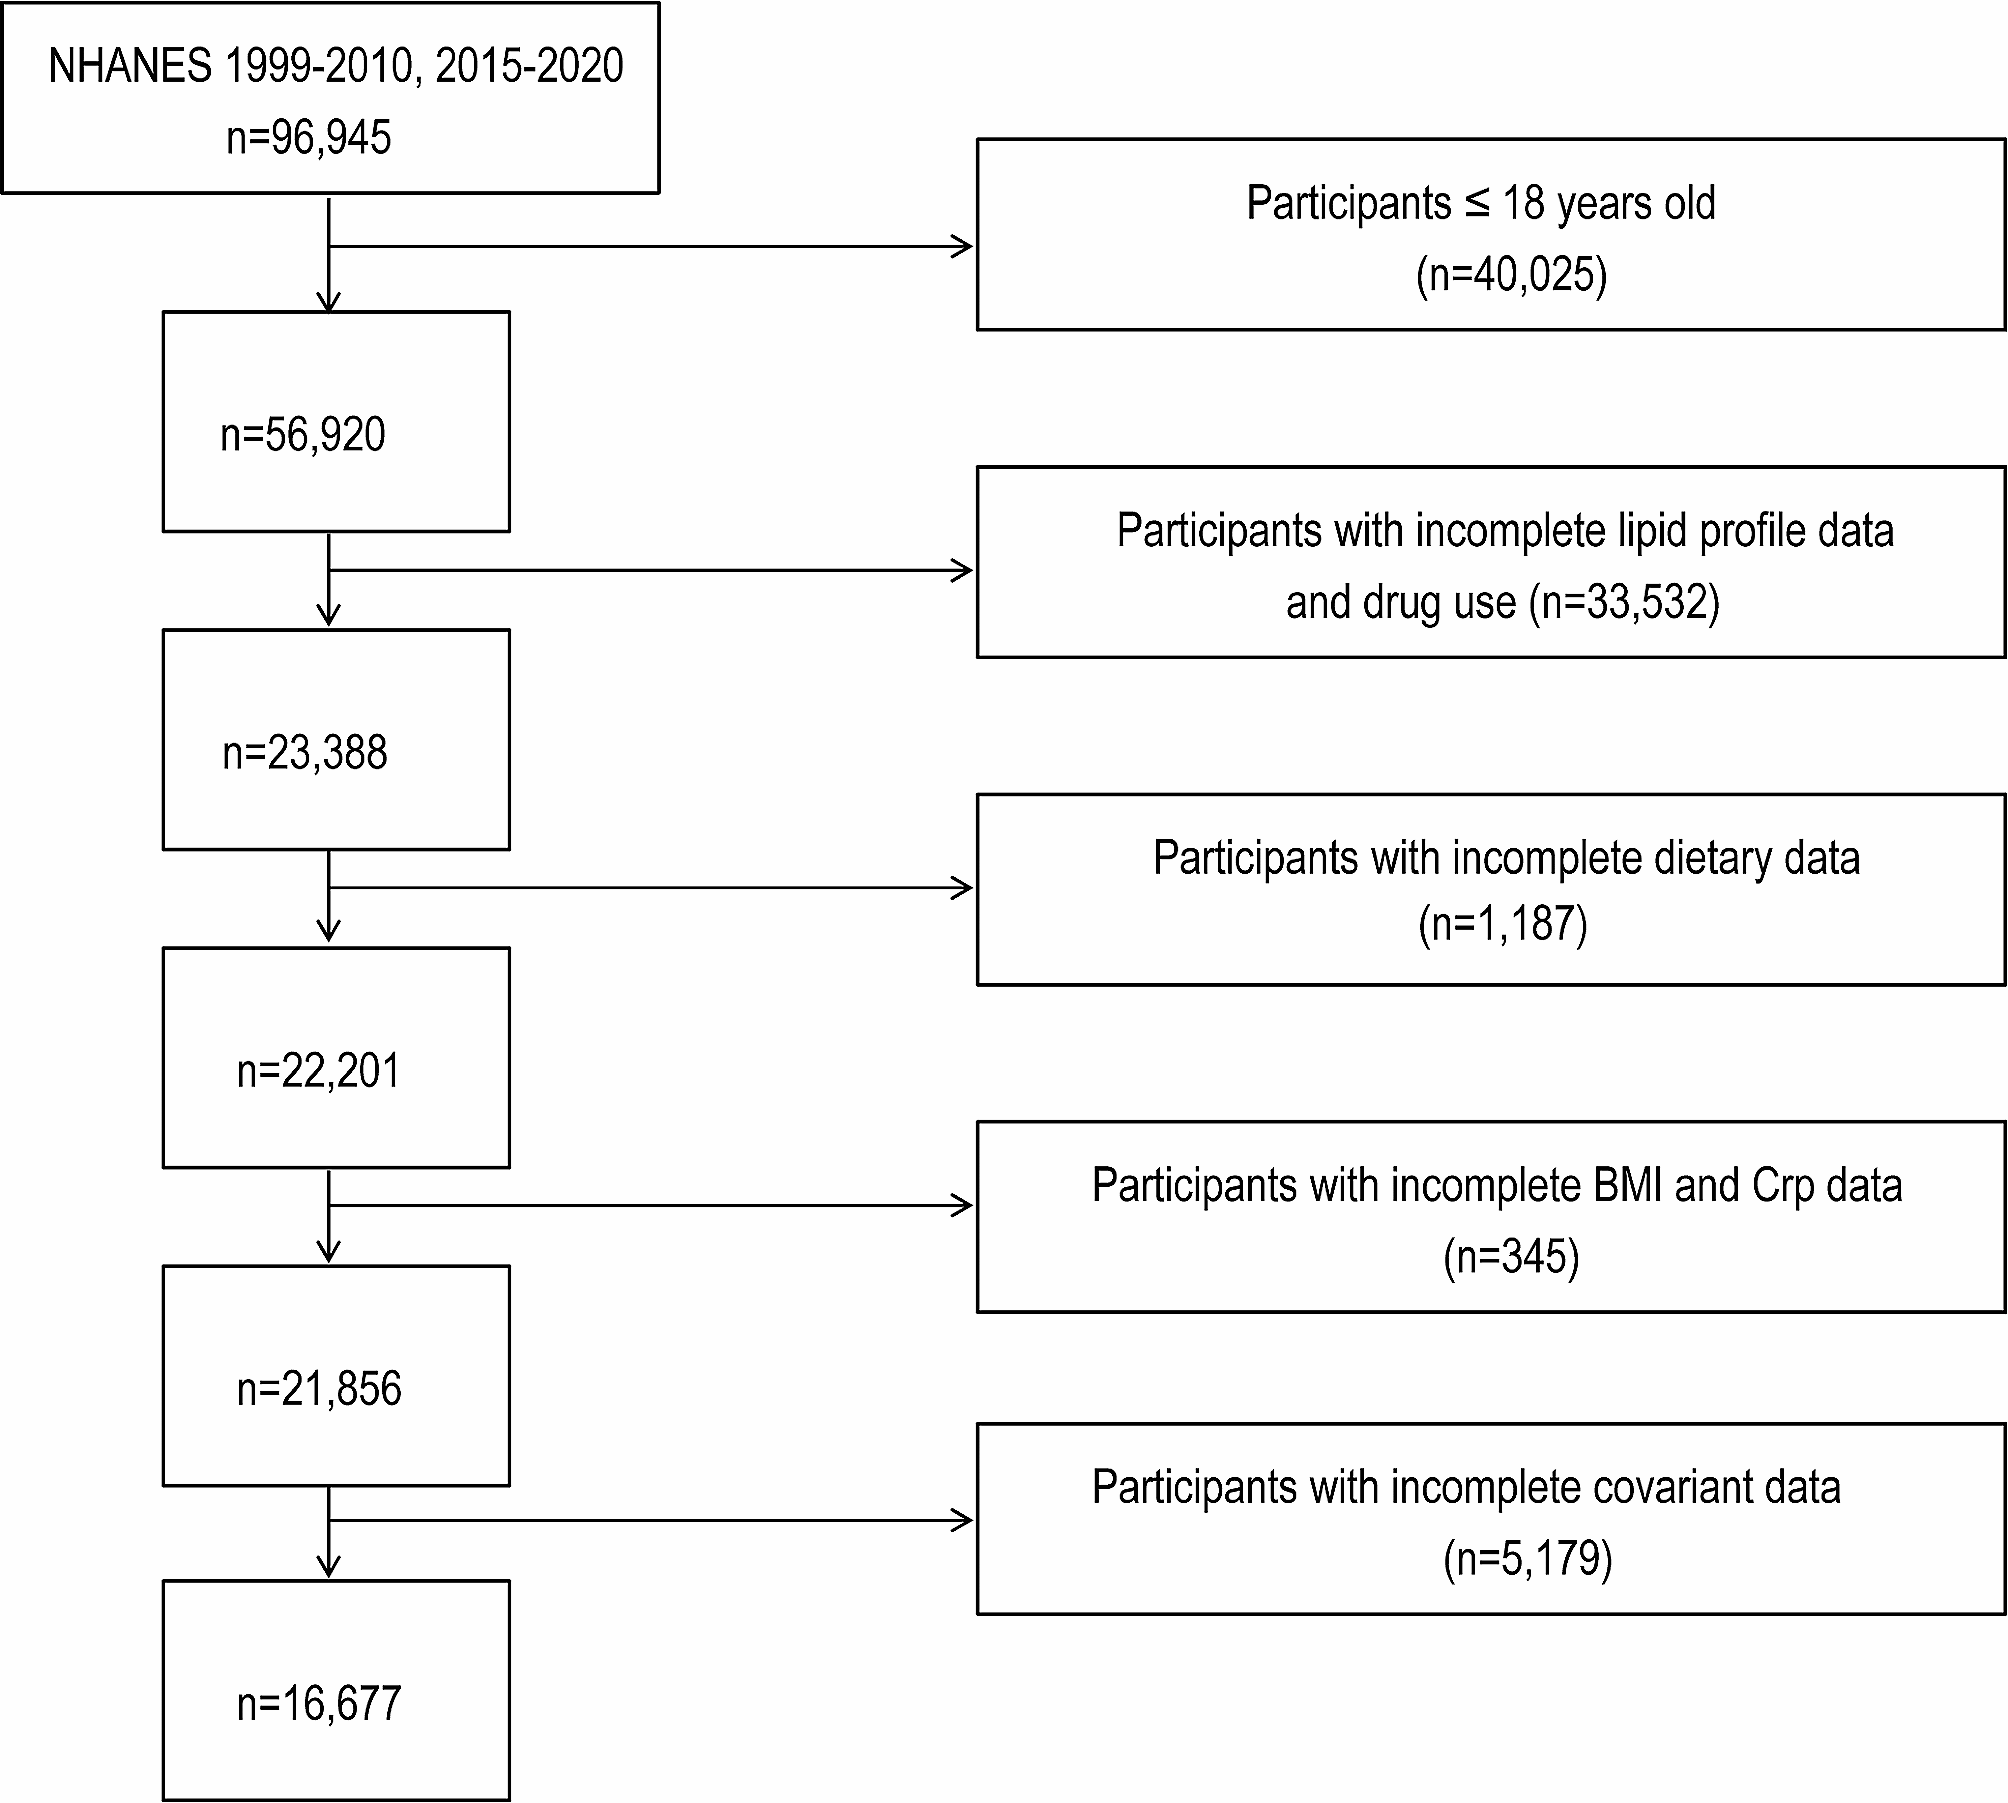
Data in the present work were acquired in the NHANES (1999–2010 and 2015–2020) (n = 96,945). The analysis was restricted to subjects aged 18 years and older (n = 56,920). In addition to dietary data (n = 23,388), blood lipid levels (HDL-C, LDL-C, TC, TG) and drug use data (n = 22,201), BMI and Crp data were also included to estimate the potential mediating effect (n = 21,856). Furthermore, other information, which included smoking habits, alcohol consumption, history of hypertension, diabetes, CVD, and stroke, was collected as covariates. Participants missing any one of these variables were eliminated out of analysis. Finally, 16,677 participants were included this study. Figure 1 presents the entire participant screening procedure.
Fig. 1
The flow diagram of the participant screening procedure
Assessment of live microbes concentrationIn NHANES, dietary intake information was recoded via 24-hour dietary recall interviews. A comprehensive classification system, provided by Sandersm, can estimate quantities of live microbes for food and we analysed 9,388 food codes in the NHANES database [6]. Based on the concentration of live microbes, foods with > 107 CFU/g are classified as high concentra tion, such as unpasteurized fermented foods and probiotic supplements. Those with 104–107 CFU/g are medium concentration, including fresh fruits and vegetables that have not been peeled. In addition, those with < 104 CFU/g are low concentration, referring to pasteurized foods. Participants who only consumed foods with low levels of live microbes were defined as the low dietary live microbe intake group (Low), participants who consumed foods with medium levels of live microbes but not high levels were defined as the medium dietary live microbe intake group (Medium), and participants who consumed foods with high levels of live microbes were defined as the high dietary live microbe intake group (High).
Hyperlipidaemia assessmentHyperlipidaemia was classified following the National Cholesterol Education Program Adult Treatment Panel III (NCEP-ATP3). The classification criteria include TC ≥ 200 mg/dL, TG ≥ 150 mg/dL, HDL-C < 40 and < 50 mg/dL in males and females, or LDL-C ≥ 130 mg/dL. Additionally, individuals who reported taking cholesterol-lowering drugs were also considered to have hyperlipidaemia [16].
Mediators and covariatesCrp was measured with a blood sample, and it was one of the laboratory tests conducted at the Mobile Examination Center (MEC). Crp is a protein produced in the body when inflammation occurs, and it is measured to assess the level of inflammation. In this study, BMI (< 25.0, [25.0, 30.0], ≥ 30.0) was determined through the division of body weight (in kilograms) by square of height (in meters).
Potential covariates included age (years), sex (male/female), ethnicity (Mexican-American/non-Hispanic white/non-Hispanic black/others), education level (lower than high school/high school/college or higher), family poverty income ratio (PIR) (< 1.3, [1.3–3.5], and > 3.5), smoking status (current/ever/never), and drinking status (current/ever/never). Furthermore, medical history, including hypertension, CVD, DM or prediabetes (pre_DM), and stroke, was included in the analysis. Since cholesterol-lowering drugs make an affect on blood lipids, drug use (none, cholesterol-lowering drugs, and other drugs) was also considered as a covariate.
Statistical analysisThe NHANES provided the four-year sample weights (wtmec4 year) for 1999–2002 and the four-year sample weights (wtmec2 year) for 2003–2020. The weights were calculated by the following formula: 2/9∗wtmec4 year for 1999–2002 + 7/9 ∗wtmec2 year for 2003–2010, 2015–2020. Continuous data were indicated by means and standard errors, whereas categorical data were presented by frequency and percentages. Participants were classified as three groups based on the dietary live microbes intake levels, namely, low, medium, and high groups.
Three multivariate logistic regression models were adopted to explore the relationship between dietary live microbes intake and hyperlipidaemia. No covariates were included in Model 1. In Model 2, age, gender, ethnicity, educational level, PIR, alcohol drinking, and smoking were adjusted. While in Model 3, variables in Model 2, as well as disease history (diabetes, hypertension, CVDs and stroke) and drug use were adjusted. In addition, relationship between dietary live microbes intake groups and blood lipid levels (HDL-C, LDL-C, TG, and TC) was also analyzed through multivariate linear regression. The above analyses were performed using R (version 4.3.1). To explore whether and to what extent the association between blood lipid levels and dietary live microbes intake is mediated by BMI or Crp, the mediation models (bootstrap test with 2000 iterations) were also conducted. In the mediation models, low, medium, and high live microbes intake groups were coded as 0, 1, and 2, respectively, to represent different categorical levels for analysis. Mediation analyses were performed using Stata (version 16.0.2). P < 0.05 indicated significant difference.
留言 (0)