
記住我


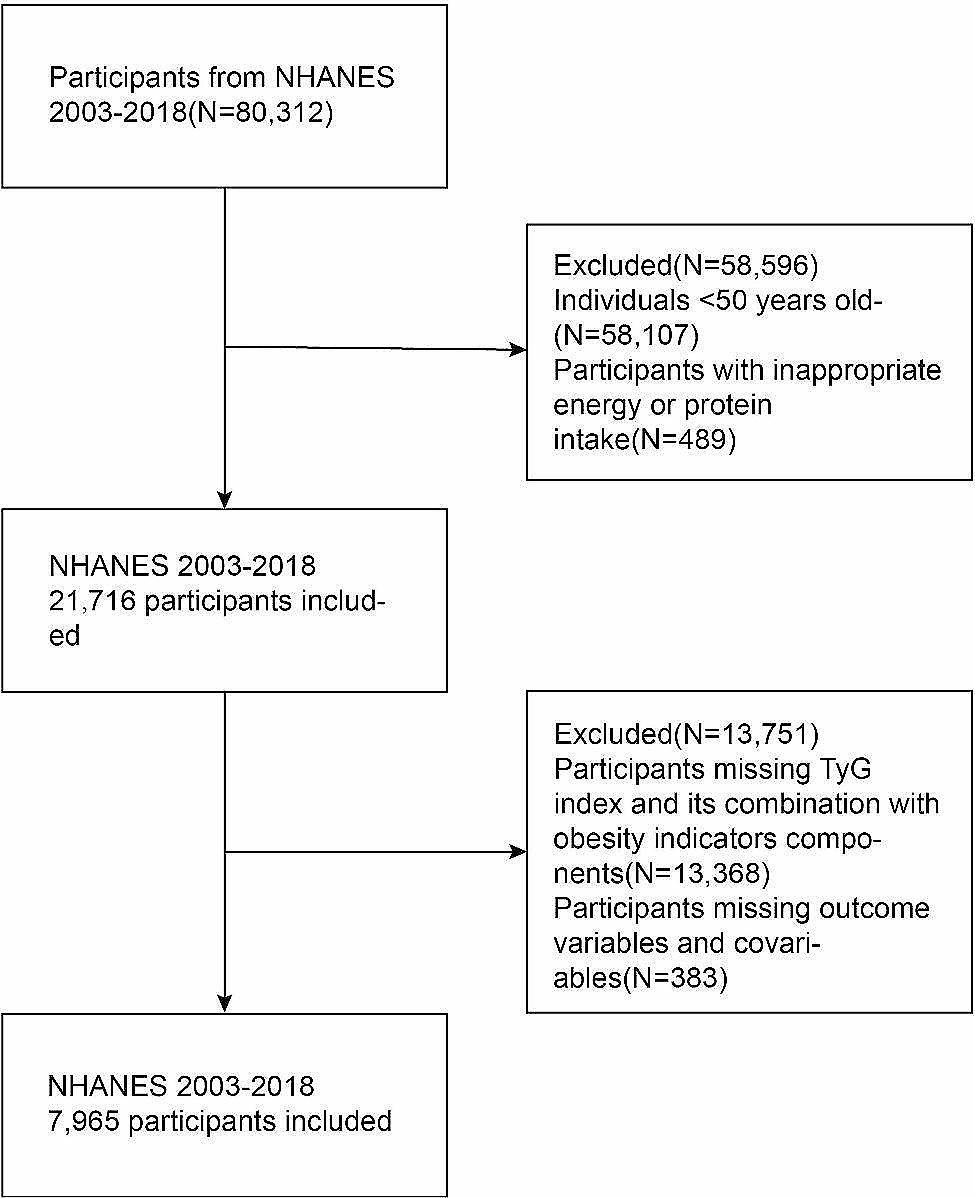
In total, 7270 participants (mean age: 60.81 ± 9.49 years; 77.1% men) were included in the current investigation (Table 1). A total of 1476 were categorized into the non-CAD group, while 5794 belonged to the CAD group. No notable distinctions were noted between both cohorts concerning age, BMI, SBP, DBP, history of hypertension, drinking history, history of family CVD, FBG, eGFR, and CRP. However, within the CAD group, the proportion of males, history of hyperlipidemia, smoking history, history of T2DM, and the levels of TC, TG, LDL-C, AIP, ALT, AST, HbA1c, and Cr were significantly higher in contrast to individuals within the non-CAD group. Conversely, the HDL-C, C1q, and LVEF levels demonstrated a significant decrease in the CAD group. Among the diabetic population, there were 2134 individuals with CAD and 425 individuals without CAD (Supplementary Table 1). It can be seen that the AIP levels within the CAD group exhibited significantly higher values compared to the non-CAD group, while the C1q levels were significantly lower.
Table 1 Baseline clinical and biochemical characteristics of the study populationClinical demographic features of the four quartiles divided by the C1q levelsBased on the quartile distribution of C1q (1st quartile: 145.0, median: 162.4, 3rd quartile: 179.5), the study categorized patients into four groups: Q1, Q2, Q3, and Q4. Q1 had 1824 patients, Q2 had 1822 patients, Q3 had 1811 patients, and Q4 had 1813 patients (Table 2). No substantial variances were detected across the groups concerning the incidence of family CVD and hypertension, as well as levels of HDL-C, FBG, HbA1C, eGFR, and CRP. As the C1q levels increased, there was a gradual decrease in the proportion of males, smokers, drinkers, T2DM, and age. For the levels of the AIP, LDL-C, TG, TC, and Cr, and As for the C1q quartiles, the same monotone increasing trend was observed in the diabetic population (Supplementary Table 2).
Table 2 Baseline clinical and laboratory characteristics of the study patients according to the C1q quartilesAssociations of the C1q and the AIP with CAD and other variablesThe correlation analysis revealed a noteworthy negative correlation between C1q and CAD, while the AIP demonstrated a notable positive correlation with CAD. Moreover, C1q values displayed a significant negative correlation with AIP. Regarding other variables, C1q showed negative correlations with age, sex (male), BMI, SBP, DBP, hypertension history, smoking history, drinking history, T2DM, LDL-C, ALT, AST, and Cr, and positive correlations with eGFR. AIP exhibited negative correlations with the eGFR and positive correlations with age, sex (male), BMI, SBP, DBP, hypertension history, history of hyperlipidemia, smoking history, drinking history, T2DM, LDL-C, ALT, FBG, HbA1c, eGFR, and Cr (Table 3 and Supplementary Table 3).
Table 3 Correlation between C1q and AIP with other variablesPredictive values of the C1q and the AIP in CADThe predictive performance of C1q and the AIP was evaluated using a receiver operating characteristic curve analysis. As for predictive ability of C1q for CAD, the specificity was 42.68% and the sensitivity was 74.01% (Fig. 2A). In comparison to AIP (AUC = 0.545, 95% CI: 0.534–0.557, P < 0.001), the C1q levels (AUC = 0.609, 95% CI: 0.598–0.620, P < 0.001) demonstrated a superior predictive ability for the diagnosis (Fig. 2B). In addition, the combination of C1q and the AIP values yielded an enhanced performance (AUC = 0.624, 95% CI: 0.613–0.635, P < 0.001) compared with using either alone (Fig. 2C). The multivariate model that incorporated the AIP and C1q demonstrated improved discrimination (AUC = 0.646, 95% CI: 0.635–0.657, P < 0.001) (Fig. 2D). The predictive result for the diabetic group was shown in the Supplementary Fig. 1A-1D with the same trend as the entire population.
Fig. 2
Receiver operator characteristic curve analysis
(A) Predictive ability of C1q for CAD, (B) Comparison of predictive ability between C1q and AIP for CAD, (C) Comparison of predictive ability between C1q + AIP and C1q for CAD, (D) Comparison of predictive ability between C1q + AIP + Model and C1q for CAD. The model includes traditional risk factors which included age, sex, BMI, T2DM and history of smoking. AIP, atherogenic index of plasma
Relationships between C1q with the variables and CADA notable positive correlation was observed in the univariate logistic regression analysis between sex (male), history of hyperlipidemia, T2DM history, smoking history, Cr, HbA1c, AIP, and CAD. In the logistic regression analysis with multi-variates, sex (male), smoking history, HbA1c, and the AIP showed significant positive correlations with CAD. With reference to Q4, as the C1q levels decreased from Q1 to Q3, the relationship with CAD showed progressively larger OR values in both univariate and multivariate regression analyses (Table 4). In the RCS curve, the combined presence of C1q and the AIP without (Fig. 3A) or with traditional risk factors (Fig. 3B) exhibited a consistent decreasing trend with CAD. The regression results with the same trend for the diabetic group were shown in Supplementary Tables 4 and Supplementary Fig. 2.
Fig. 3
Association between C1q + AIP with or without the traditional factors and the prevalence of CAD
(A) C1q combined with AIP for the prevalence of CAD without the traditional factors, (B) C1q combined with AIP for the prevalence of CAD with the traditional factors. The traditional risk factors included age, sex, BMI, T2DM and history of smoking. The ordinate represents the odds ratio value of coronary artery disease, while the abscissa represents the value of C1q
Table 4 Relationship between CAD and the C1q expressed as a categorical variable
留言 (0)