Sample collection and cell culture
With the approval of the Ethics Committee of our institution (Naval Medical University) and patient consent, the ligament samples were collected from patients diagnosed with OPLL(who underwent anterior cervical corpectomy and fusion)or non-OPLL (cervical spine trauma patients who underwent anterior cervical corpectomy and fusion) during surgeries. Sixteen patients (8 with OPLL and 8 with non-OPLL) were included between August 2019 and July 2020. Our professional spine surgeons confirmed the diagnosis of OPLL or cervical trauma by preoperatively presenting the patient’s symptoms, signs, and imaging data. Moreover, detailed information on the participants is listed in additional file 1: Table S1. Ligament cell culture from patients with primary OPLL or non-OPLL has been previously described (Tang et al. 2022). Briefly, approximately 1 mm3 pieces of sample tissue were plated on Petri dishes with high-glucose DMEM (H-DMEM, HyClone, USA) with 10% FBS (Gibco, USA) and 1% penicillin/streptomycin (Gibco, USA); the tissue pieces were then incubated at 37 ℃ under 5% CO2. After approximately 10 days, a mass of cells with spindle or flattened shapes emerged around the tissue pieces and grew adherently. When the bottom of the dish was 70-80% covered with cells, the cells were harvested for serial passage and analysis. LFs from passages 1–3 were chosen for subsequent experiments.
The ECs used in this experiment were obtained from the Cell Bank of the CAS (Chinese Academy of Sciences, Shanghai, China). The ECs were cultured in endothelial cell Medium (ECM, Cyagen Biosciences, Guangzhou, China) containing endothelial cell growth supplement and 5% FBS in an incubator at 37 ℃ under 5% CO2. ECs from passages 1–3 were chosen for subsequent experiments.
Flow cytometry
To identify the mesenchymal characteristics of LFs, we used flow cytometry for surface characterization. Isolated primary LFs with a confluence of 80% were chosen for subsequent experiments. Simply, after the cells were digested with 0.25% trypsin, the cells were collected by centrifugation, adjusted to a density of 1 × 10⁶/ml, and finally added to the suspension in 100 µL of PBS buffer with 2% FBS for washing three times. Subsequently, FITC-conjugated antibodies were added, including CD34 (34-581-01, eBioscience, USA), CD45 (MHCD4504, eBioscience, USA), CD90 (17-0909-42, eBioscience, USA), and CD105 (MA1-19594, eBioscience, USA), followed by incubation in the dark for 30 min. After that, the incubated cells were centrifuged and washed with PBS. Finally, the cells were detected with a flow cytometer (Cyan ADP, Beckman Coulter, USA), and the positive rate of surface antigen was analysed and calculated by FlowJo software.
Osteogenic, adipogenic, and chondrogenic differentiation
For osteogenic differentiation, ligament fibroblasts derived from patients with OPLL (500 µl, 2 × 10⁴ cells/ml) were seeded into 24-well plates (Corning, USA) and incubated at 37 ℃ under 5% CO2. When the LF confluence reached 80–90%, the medium was replaced with osteogenic induction medium (HUXMA-90,021, Cyagen, China). The medium of the cells was refreshed every two days. After osteogenic induction, the cells were stained by using an ALP staining kit (P0321S, Beyotime, China) on Day 7 and 2% Alizarin Red S (SCR028, Sigma-Aldrich, USA) on Day 21.
For adipogenic differentiation, LFs (1 ml, 5 × 10⁴ cells/ml) were seeded in 12-well plates (Corning, USA) and incubated at 37 ℃ under 5% CO2. When the LF confluence reached 100%, the medium was replaced with adipogenic differentiation medium (HUXXC-90,031, Cyagen, China). The adipogenic differentiation medium was divided into liquid A and liquid B. Liquid A is mainly used to induce the formation of lipid droplets, while liquid B is mainly used to maintain the morphology of lipid droplets. The cells were cultured with liquid A for three days and then replaced with liquid B for one day. After 21 days, the cells were stained with Oil Red O (OILR-10,001, Cyagen, China) and photographed with a microscope.
For chondrogenic differentiation, LFs reaching 80% confluence were first digested with trypsin and then centrifuged at 220 g for 5 min, discarding the supernatant. Subsequently, the cells were resuspended in an OriCell® chondrogenic differentiation medium (HUXMX-90,041, Cyagen, China), and the cell density was adjusted to 2 × 10⁶ cells/ml. Next, 1 ml of cell suspension was aspirated and seeded into a 15 ml centrifuge tube, followed by another centrifugation step. After centrifugation, the centrifuge tube cap was loosened, and the tube was gently placed vertically in a 37 ℃, 5% CO2 incubator. After 24 h of induction, cell aggregates could be observed at the bottom of the centrifuge tube. Every two days, the old medium was carefully aspirated, and 1 ml of fresh medium was added. After 21 days of induction culture, chondrospheres were formed. To further observe the morphology of the chondrospheres, they were fixed with 4% paraformaldehyde, sectioned, and stained with 2% Alcian Blue (TMS-010, Sigma-Aldrich, USA), followed by microscopic examination and recording of the results.
Cell proliferation assay
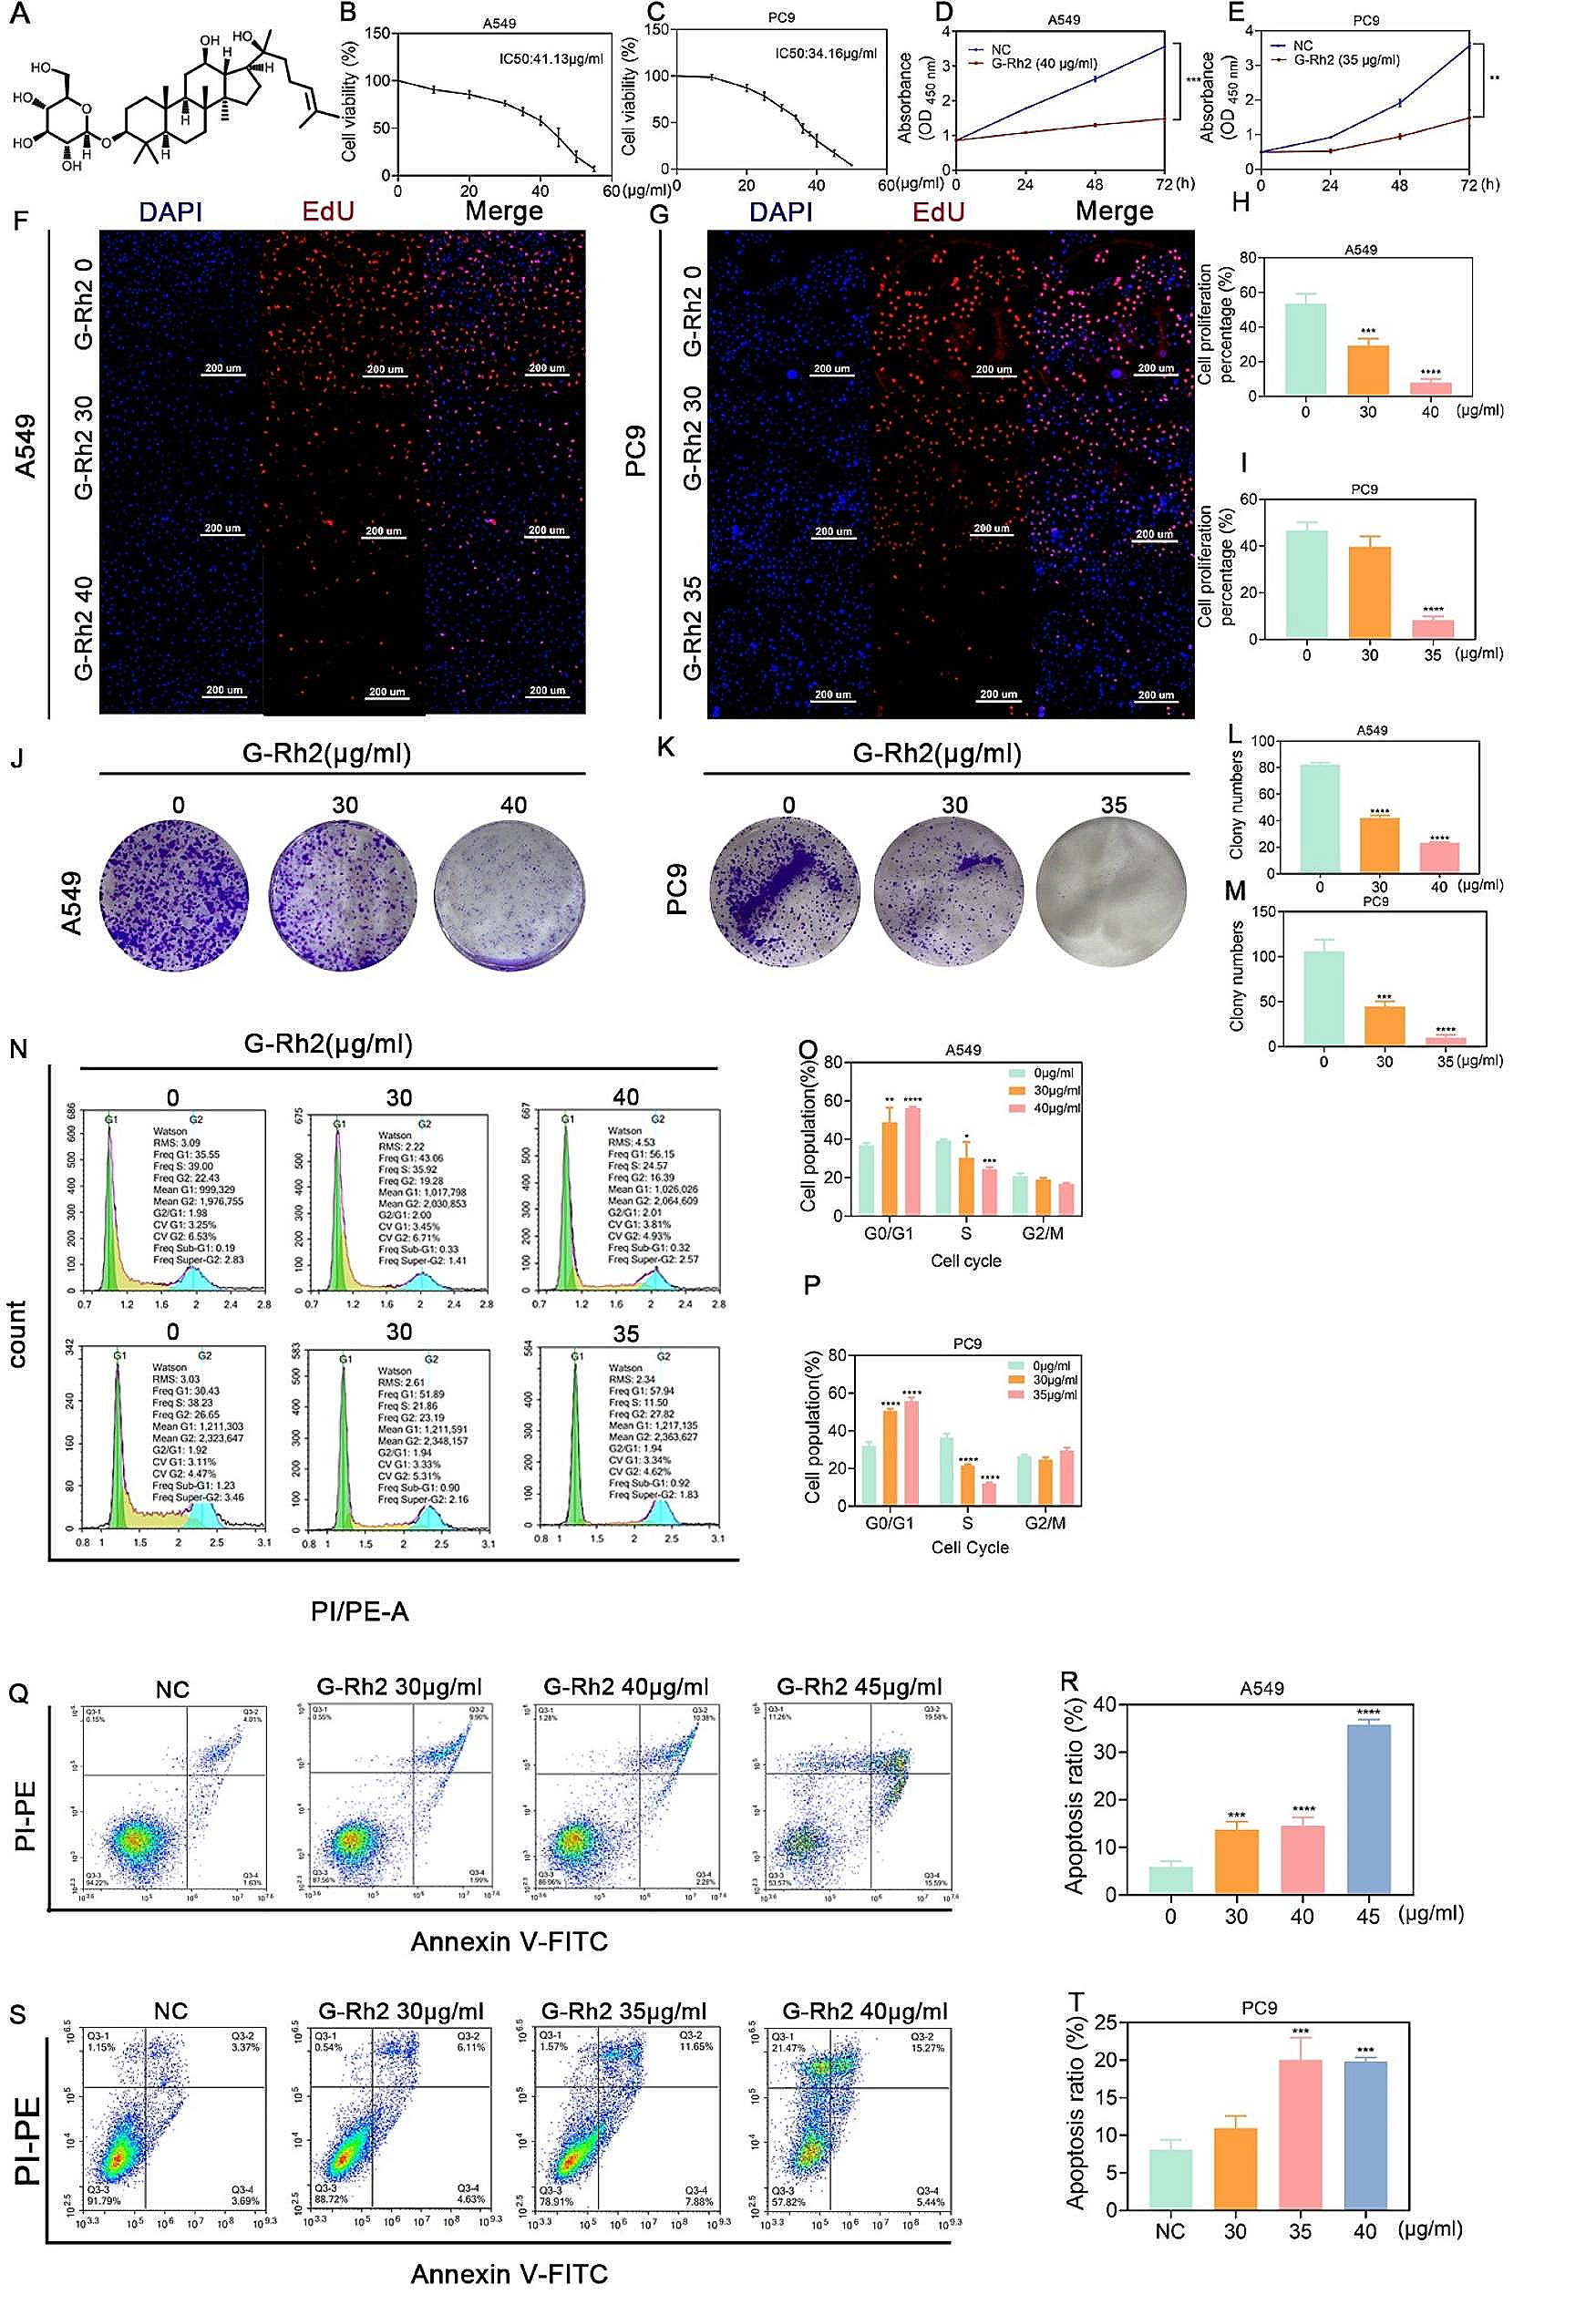
First, the medium was prepared with different of c(RGDyk) peptides (NJPeptide, Nanjing, China) for the following experiment. Next, LFs and ECs were cultured in medium with different concentrations of c(RGDyk) for one day. Cell proliferation was tested with a Cell Counting Kit-8 assay (CCK-8, C0038, Beyotime, Shanghai, China). Briefly, after cells were incubated in a 10% CCK-8 solution for 1 h at 37 ℃, OD450 values were detected by a spectrophotometric microplate reader.
Immunofluorescence (IF) assay
LFs or ECs (500 µl, 2 × 10⁴ cells/ml) were seeded in 24-well plates and incubated with different concentrations of c(RGDyk) at 37 ℃ under 5% CO2. For cell IF analysis, cells were fixed with 4% formaldehyde and then washed three times with PBS, followed by permeabilization with 0.5% Triton X-100 for 5 min. After blocking with 5% bovine serum albumin (BSA) for 1 h, the cells were incubated overnight at approximately 16 h at 4 ℃ with anti-integrin αVβ3 (1:200, BS-1310R, Bioss, USA). After incubation, the cytoskeleton actin of cells was stained by FITC-phalloidin (1:200, YP0059S, Bioscience, Shanghai) for 20 min. Subsequently, secondary antibodies were used, and the cell nuclei were stained by DAPI (P0131, Beyotime, Shanghai, China) for 5 min. For tissue IF analysis, first, the decalcified OPLL or scaffold samples were fixed in 4% paraformaldehyde, dehydrated in a graded ethanol series, vitrified using dimethylbenzene, and then embedded in paraffin. Subsequently, the paraffin sections were deparaffinized by xylene and hydrated in an alcohol gradient. The tissue IF analysis procedures were similar to those of cell IF. In brief, sections were incubated overnight at 4 ℃ with anti-CD31 (1:1000, 3528 S, CST, USA). After incubation, sections were incubated with secondary antibody (1:100, AS037, ABclonal, China) for 2 h and DAPI for 5 min at room temperature. Finally, fluorescence microscopy was used to photograph the cells.
Cell migration assay
Transwell and scratch assays were used to evaluate the effects of c(RGDyk) on the migration property of ECs. Cell proliferation experiments have demonstrated that when the concentration of the c(RGDyk) exceeds 10 µM, cell activity is inhibited, exhibiting a certain level of toxicity. Therefore, we selected peptide concentrations of 1, 5, and 10 µM for investigating cell migration assay. We prepared a few 24-well transwell plates with 8-µm pores for the transwell assay. First, we seeded the ECs (800 µL, 2 × 10⁴ cells/ml) in the upper chambers and preincubated them with different concentrations of c(RGDyk) for 1 h. Second, we incubated them with the medium in the lower chambers for 24 h with c(RGDyk) remaining in the upper chambers. Finally, after the end of incubation, the migrated ECs were fixed with 10% paraformaldehyde for 20 min, washed with PBS solution, stained with 0.5% crystal violet (Beyotime, China), and photographed with a microscope.
For the scratch assay, ECs were seeded in 6-well plates (Corning, USA). In brief, the cells were scratched with a sterile 200 µL pipette tip perpendicular to the bottom of the plate after reaching 90% confluence. At 0 h and 24 h after scratching, the cells were photographed and analysed using a light microscope and ImageJ software. The width range of the EC movement was measured by ImageJ software. The calculation method of EC migration area (A) was as follows: A=(A1−A2)/A1 × 100%, where A1 is the initial area and A2 is the residual area of the wound.
Tube formation assay
The tube formation assay was performed to evaluate the effect of c(RGDyk) on the angiogenic ability of ECs. Briefly, 60 µL per well of Matrigel (Corning, USA) with different concentrations of c(RGDyk) was spread gently into a 96-well plate (Corning, USA) and then incubated in a 37 ℃ incubator for 50 min. Afterwards, ECs at a density of 2 × 10⁴ cells per well were seeded in each well. After incubation for 6 h, the cells were photographed and analysed using a light microscope and ImageJ software. The formed nodes and meshes were measured.
RNA extraction, RNA-sequencing (RNA-seq), and qPCR
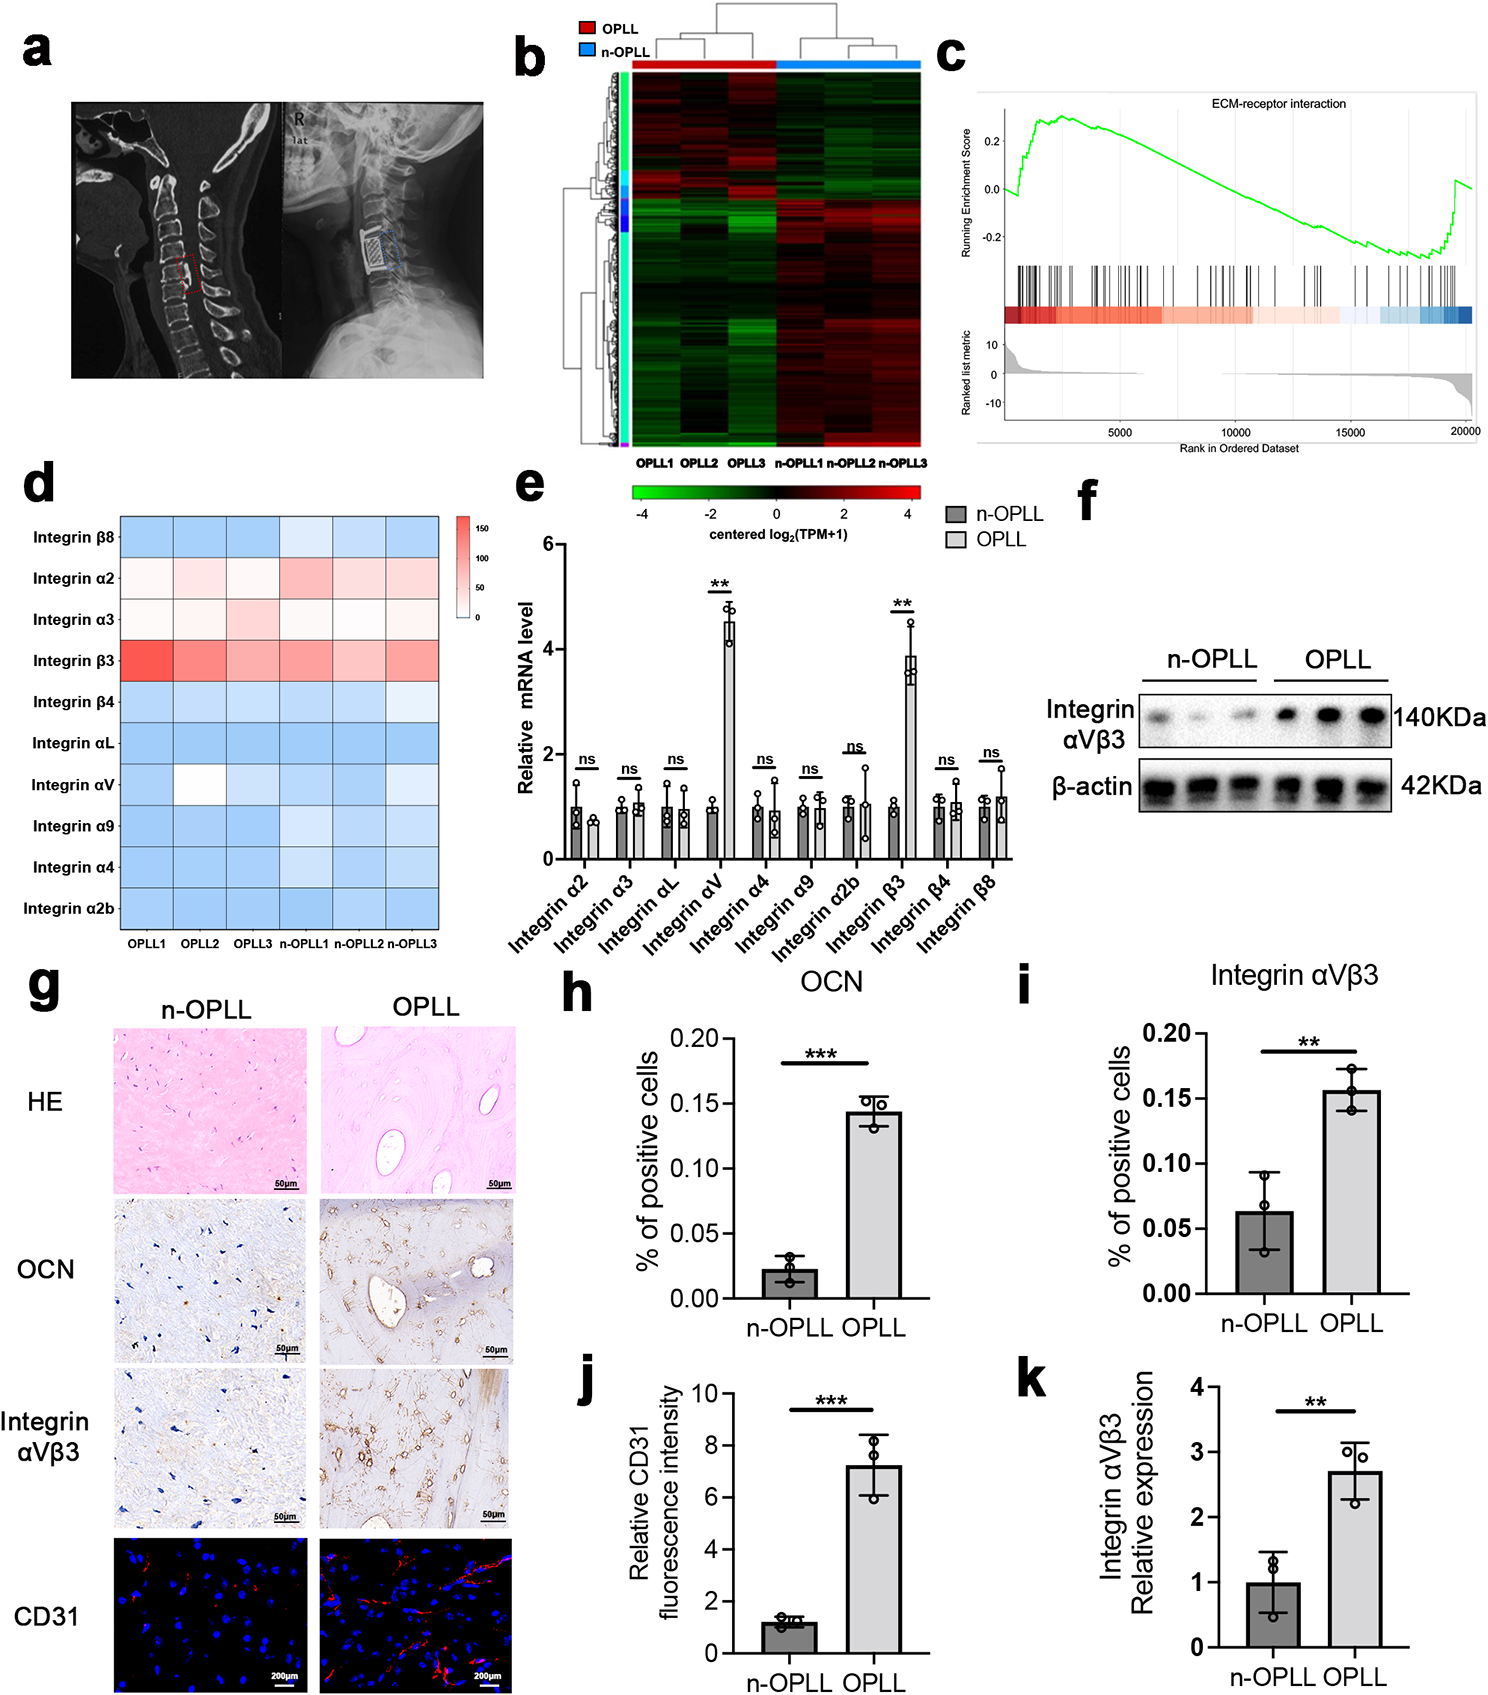
Firstly, cultured LFs from patients with primary OPLL or non-OPLL were lysed with TRIzol (Invitrogen, USA) to isolate total RNA. Subsequently, a cDNA library was constructed for RNA-seq to analyze the expression of differentially expressed genes. Finally, total RNA was reverse transcribed into cDNA using a ReverTra Ace® qPCR RT Kit (Toyobo, Japan) following the manufacturer’s instructions. q-PCR was performed with the SYBR Green Mix, and the relative expression of genes, including integrin αV, α2, α3, α4, α2b, α9, αL, β3, β4, β8, ALP, RUNX2, OCN, OPN, and Collagen I, was quantified with normalization to β-actin mRNA. The sequences of the primers are shown in additional file 1: Table S2.
Synthesis and cell transfection of siRNA
The siRNAs targeting Integrin αV and Integrin β3 were designed and synthesized by Genomeditech Cor (Shanghai, China). LF transfection during osteoblastogenesis in vitro was performed on the first day after osteogenic differentiation induction. The siRNA and GMTrans Liposomal Transfection Reagent (Genomeditech, Shanghai, China) were mixed according to the manufacturer’s guidelines and added to LF culture, followed by 24 h of incubation. The culture medium was changed every day until the LFs were harvested for detection. The siRNA sequences are shown in additional file 1: Table S3.
Western blots
First, cells were lysed in ice-cold lysis buffer (KeyGEN BioTECH, China) containing protease and phosphatase inhibitors. After the lysate was centrifuged at 12,000 × g for 10 min at 4 ℃, cell proteins were extracted from the supernatant. Next, a 4x loading buffer was added to the proteins of different groups, and the samples were boiled for 10 min before electrophoresis. While the protein samples were separated by SDS‒PAGE, the proteins were transferred to PVDF membranes. Second, protein samples were incubated with primary antibodies overnight at approximately 16 h at 4 ℃. The following primary antibodies were used: Anti-GAPDH (1:1000, GB15002, Servicebio, China), Anti-β-actin (1:1000, GB15003, Servicebio, China), Anti-ALP (1:1000, ab229126, Abcam, Cambridge, UK), Anti-RUNX2 (1:1000, ab264077, Abcam, Cambridge, UK), Anti-OCN (1:1000, ab93876, Abcam, Cambridge, UK), Anti-OPN (1:1000, ab214050, Abcam, Cambridge, UK), Anti-Collagen I (1:1000, ab138492, Abcam, Cambridge, UK), Anti-integrin αVβ3 (1:500, bs-1310R, Bioss, USA), Anti-FAK (1:1000, A11131, ABclonal, China), Anti-ERK1/2 (1:1000, 4696 S, CST, USA), Anti-p-VEGFR2 (1:1000, 2478 S, CST, USA), Anti-p-FAK (1:500, AP0302, ABclonal, China), and Anti-p-ERK1/2 (1:1000, 8544 S, CST, USA). Third, the membranes were incubated with species-matched secondary antibodies (1:1000, AS081, ABclonal, China) for 1 h at room temperature. Finally, the target proteins were visualized by the enhanced chemiluminescence (ECL, Millipore, USA) detection system. Original immunoblot pictures of western blot are shown in additional file 1: Figures S5, S6, and S7.
Histology and immunohistochemical (IHC) assays
First, paraffin sections used for histology and immunohistochemical assays were the same as described above for the tissue IF assay. Next, the sections were stained with standard HE staining protocols. For the IHC assay, sections were subsequently incubated overnight at 4 ℃ with primary antibodies. The following primary antibodies were used: anti-OCN (1:150, ab93876, Abcam, USA), and anti-integrin αVβ3 (1:200, bs-1310R, Bioss, USA). Finally, sections were scanned by moving rapidly under the microscope of the image scanner (3DHISTECH, Hungary).
In vivo heterotopic bone formation assay
In an in vitro assay, we proved that 10 µM is the best concentration of c(RGDyk) to inhibit osteogenesis and angiogenesis. Thus, we used a 10 µM c(RGDyk) for in vivo ectopic bone formation assays. First, under osteogenic induction conditions, LFs were pretreated with a concentration of 10 µM c(RGDyk) cyclic peptide for 5 days. Then, the LFs were cocultured with Bio-Oss Collagen scaffolds (Geistlich, GEWO GmbH, Germany) in osteogenic medium with or without c(RGDyk) (10 µM) for 48 h. Next, the mixture of scaffold and LFs was subcutaneously implanted on the back of nude mice (4-week-old BALB/c male nude, Shanghai Legen Biotechnology Co., Ltd., China) as described previously (Tang, Sun 2022). After 8 weeks, the scaffolds implanted in the animals were retrieved and fixed in 10% formalin solution for 48 h, followed by decalcification in 10% EDTA (BB-23,613, BestBio, China) solution for 4 weeks. The decalcified bone specimens were embedded in paraffin, and tissue blocks of paraffin were then sectioned at a thickness of 5 μm for subsequent experiments. In this study, nude mice were randomly assigned to three distinct groups: the NC group, the LFs group, and the LFs-RGDyk group. The NC group served as the blank control group, in which mice received implantation of scaffolds without any additional treatment. The LFs group was designated as the experimental control group, where mice were implanted with cell-loaded scaffolds. The LFs-RGDyk group served as the experimental group, in which mice were implanted with a mixture of scaffolds pre-treated with RGDyk. Preoperative, intraoperative, and postoperative images of animal models are shown in Additional file 1: Figure S1.
Micro-CT
To determine whether c(RGDyk) inhibits new bone formation in vivo, we conducted micro-CT scans on the bioscaffolds harvested after treatment at 8 weeks after the surgery. Finally, the 3D reconstruction image was performed using ReconDaemon software (Pingseng Healthcare Ctvox, Shanghai), and data analysis was performed using the Avatar3 software (Pingseng Healthcare Ctvox, Shanghai).
Statistical analysis
All experimental data are presented as the mean value ± SD. Student’s t test or one-way analysis of variance (ANOVA) was used to assess independent variables appropriately. A *P < 0.05 was considered to be statistically significant.


留言 (0)