
記住我


This study conforms to the principles outlined in the Declaration of Helsinki. The use of human iPSC was approved by Ethics Committee of the Pirkanmaa Hospital District, Tampere, Finland (Approval Number R08070). Written informed consents were received from donors. Human ASC were isolated from subcutaneous tissue samples that were received from three different donors (donor information on Table S1). Adipose tissue samples were obtained at the Tampere University Hospital Department of Plastic Surgery with the donor's written informed consent and processed under ethical approval of the Ethics Committee of the Pirkanmaa Hospital District, Tampere, Finland. (Approval Numbers R15161).
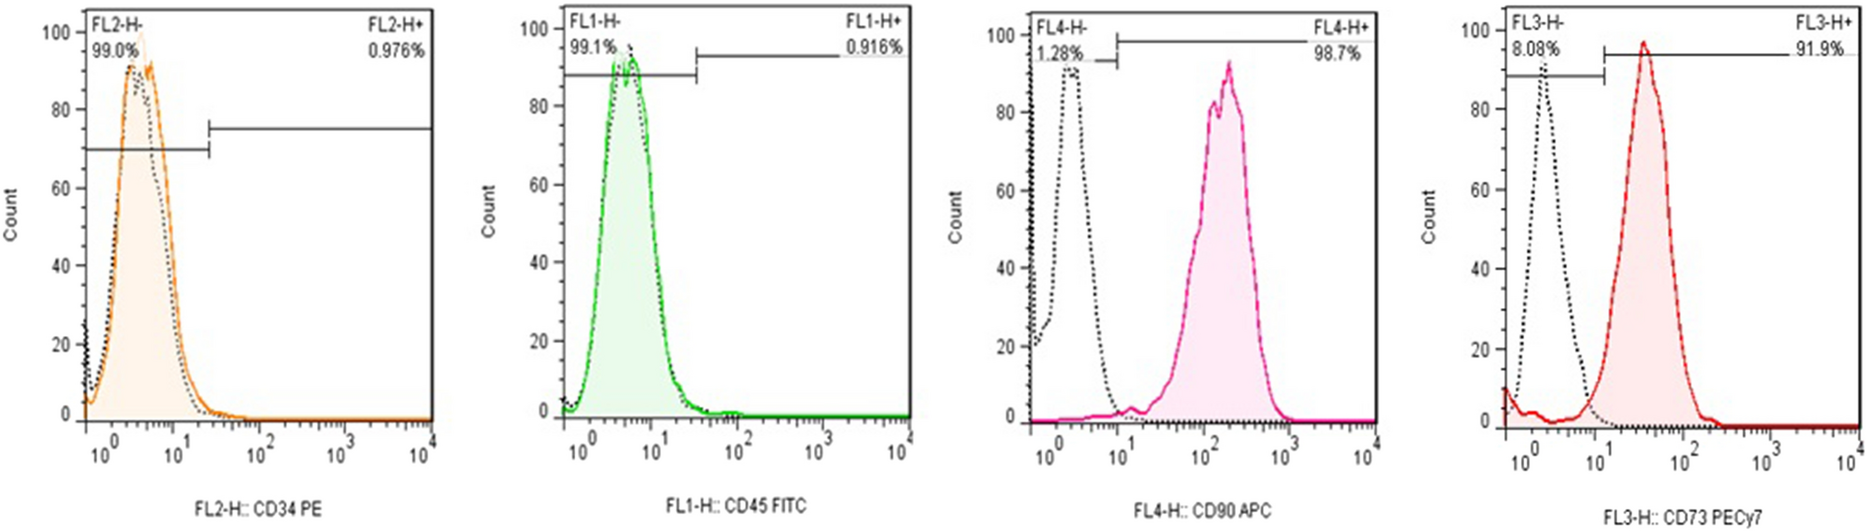
Cell isolation, differentiation, and cultureIsolation and culture of human adipose tissue derived stem/stromal cellsThe cells were isolated as described previously (Kyllönen et al. 2013). Briefly, adipose tissue samples were cut into smaller pieces and digested with collagenase type I (1.5 mg/ml, Thermo Scientific) for 60–90 min at + 37 ℃. After centrifugation, red blood cells were lysed with water and the cells were centrifuged and filtered. The ASC were cultured in α-MEM (Thermo Scientific) supplemented with 5% human serum (HS, Serana) and 100 U/mL penicillin, and 100 μg/mL streptomycin (Lonza), expanded for 3–5 days and used in passages 1 or 4. For ASC characterization, plastic adherence and surface marker expression of the used cell lines was studied to identify the mesenchymal origin of ASC using flow cytometry (Table S2). The identification criteria is defined by the International Society for Cellular Therapy (Dominici et al. 2006; Bourin et al. 2013).
Culture of human umbilical vein endothelial cellsPooled human umbilical vein endothelial cells (HUVEC) expressing green fluorescent protein (GFP) were commercially obtained from Cellworks. GFP-HUVEC were cultured as previously described (Mykuliak et al. 2022), expanded for 3–5 days and used in passages 3–5.
Generation of induced pluripotent stem cell line and cell culture of pluripotent stem cellsEstablishment of patient-specific iPSC line UTA.04602.WT from healthy individual has been described earlier (Takahashi et al. 2007) and the results of the cell line characterization has been presented earlier (Lahti et al. 2012). UTA.04602.WT cells were cultured on mitomycin C inactivated mouse embryonic fibroblasts (MEF) in KSR medium consisting of DMEM/F-12 (Invitrogen) supplemented with 20% KnockOut serum replacement (Invitrogen), 1% non-essential amino acids (NEAA, Lonza Group Ltd, Basel, Switzerland), 2 mM Glutamax (Invitrogen), 50 U/ml penicillin/streptomycin (Lonza Group Ltd, Basel, Switzerland), 0.1 mM β-mercaptoethanol (Invitrogen) and 7.8 ng/ml basic fibroblast growth factor (R&D Systems). The medium was refreshed daily and using 1 mg/ml collagenase IV (Invitrogen) cell colonies were passaged onto a new MEF layer once a week.
Differentiation of induced pluripotent stem cell derived cardiomyocytesHuman iPSC were differentiated into cardiomyocytes with small molecule differentiation method based on Karakikes et al. (2014) protocol as described previously (Prajapati et al. 2021). Briefly, the hiPSCs were treated with versene, resuspended to mTeSR1 medium supplemented with 5 µM blebbistatin (Sigma-Aldrich, B0560) and plated on ultra-low attachment 6-well plates (Corning, 3471) (Day 0). On the next day, medium was changed to RPMI/B27-insulin supplemented with 5 µg/ml ascorbic acid, 10 ng/ml BMP4 and 25 ng/ml Activin A (Peprotech, 120-14E) (Day 1). On day 3, the medium was changed to differentiation medium RPMI/B27-insulin supplemented with 5 µg/ml ascorbic acid for 30 h. On the final step, medium was changed to RPMI/B27-insulin supplemented with 2.5 µM IWP-4. After 96 h, IWP-4 was removed from the media and medium was replaced with RPMI/B27 + insulin on day 11. After that, medium was refreshed three times a week. At day 17, the cardiomyocyte purity was improved by using magnetic activated cell sorting (MACS). First, MultiTissue Dissociation Kit 3 was used to dissociate beating aggregates to single cell level and after that, MACS was performed to dissociated cells according to kit instructions (both kits from Miltenyi Biotech, Germany). Directly after cell sorting, cardiomyocytes are used for establishment of co-cultures and multicultures.
Development of hydrogel for 3D cell culturePreparation of hydrazide-modified gelatin (Gelatin-CDH) and oxidized gellan gum (GGox) hydrogelsGelatin was modified using carbodihydrazide (gela-CDH) as described previously (Koivisto et al. 2019). Briefly, 1000 mg of gelatin was dissolved in 500 ml water and kept at ambient temperature under N2 atmosphere. Then, 1.0 g (0.22 M) of CDH was added to this solution and the solution pH was adjusted to 4.7 with 0.5 M HCl. Parallel, 300 mg (0.04 M) of EDC (N,N-(3-dimethylaminopropyl)-N´-ethyl-carbodiimide hydrochloride) and 212 mg (0.03 M) of HOBt were dissolved in 3 mL DMSO/water (1.5:1 v/v) and added to the reaction mixture drop by drop, while keeping the solution pH at 6.8. The pH was monitored for 4 h and the reaction was kept under N2 atmosphere overnight. Then, the reaction product was precipitated in cold ethanol with NaCl (0.5 mg/mL). The precipitate was centrifuged, redissolved in water, and exhaustively dialyzed (12–14 kDa MWCO) and finally freeze-dried over 4 days for storage.
GG was modified by NaIO4 oxidation according to previously reported method (Karvinen et al. 2017) to produce GG-CHO with a modification degree of 25%. Briefly, 500 mg GG (Gelzan™ CM, Sigma Aldrich) was dissolved in 100 ml water at 90C and protected from light und N2 atmosphere. Then, 60 mg of NaIO4 were dissolved in water and added dropwise to the GG solution. The reaction was kept for 4h and then quenched using 300 µL ethylene glycol. The product was dialyzed (12–14 kDa MWCO) against water and freeze-dried over 4 days for storage.
Preparation of hybrid hydrogelTo prepare the final hybrid hydrogel, Gelatin-CDH solution was dissolved in DMEM/F12 at 60 mg/ml and GGox at a concentration of 40 mg/ml. Both polymer solutions were filtered using a Whatman FP 30/0.2 CA-S sterile filter (Thermo Fisher Scientific) at + 37 ℃. The solutions were warmed + 37 ℃, and then equal volumes (1:1) of the solutions were mixed for a few seconds by pipetting to prepare the hydrogel directly for cell culture and as a hydrogel control.
Mechanical characterization of the hydrogelFor rheological analysis of the hydrogel (Fig. S1), the polymers were dissolved as described above and tested using Discovery HR-2 rheometer with 20 mm plate-plate geometry and TRIOS software (TA Instruments). Appropriate values for amplitude (0.75% oscillation strain) and frequency (0.75 Hz) were known from previous measurements of similar materials and tests were carried out in triplicate. For the time sweep, 350µL GGox were placed on the bottom geometry at 37C, and the upper geometry was lowered to a gap of 1500 µm. While the upper geometry was spinning at 70 rad/s for 7 s, 350µL of Gela-CDH was added to gap so that the components would mix. The time sweep started immediately after the spinning step and was recorded for 1 h. Then, the hydrogel was left to rest for 5 min under the geometry, and an amplitude sweep from 0.01 to 100% oscillation strain (0.75 Hz) was performed on the same sample.
Establishment of cell culture modelsCardiomyocyte 2D and 3D monoculturesAfter MACS sorting, iPS-CM (UTA.04602.WT) were plated on top of thin, 0,1% gelatin (Sigma) coating as 2D monoculture or on top of gellan gum-gelatin hydrogel as 3D culture at 0.099 × 10⁶ cells/cm2 (Fig. 1) and cultured in 5% EB medium with KnockOut DMEM containing 5% FBS (Gibco and Biosera Nuaille), 1% NEAA, 1% Glutamax and 0.5% penicillin–streptomycin. 2D and 3D cardiomyocyte monocultures were imaged live during the culture period using EVOS microscope (EVOS FL Cell imaging system, Thermo Fisher Scientific) with brightfield view before end-point analyses.
Fig. 1
Composition of different cardiac models, co-culture variations and the endpoint analyses used in the study. Cardiomyocyte controls were plated as 2D monoculture on top of thin 0.1% gelatin coating or as 3D monoculture on top of gellan gum-gelatin hydrogel. Vascular co-cultures (ASC + EC), cardiovascular multiculture (ASC + CM + EC) and myocardial co-culture (ASC + CM) were formed in 3D in gellan gum-gelatin hydrogel
3D vascular co-culturesVascular network was formed through self-assembly of GFP-HUVEC and ASC in gellan gum-gelatin hydrogel in 48-well plates (Sigma-Aldrich) for qPCR analysis, 1-well on glass for calcium imaging, and in high content imaging 8-well plates (Ibidi) or in high content imaging 48-well plates (MatTek) for immunocytochemical staining or video analysis (Fig. 1). Briefly, ASC and GFP-HUVEC were detached and counted for cell ratio 1:5, respectively. ASC (p1 or p4) were carefully suspended into + 37 ℃ gelatin at 1 × 10⁶ cells/ml. Promptly, GFP-HUVEC (p3-5) were combined with gelatin-ASC suspension at 5 × 10⁶ cells/ml and finally + 37 ℃ gellan-gum was added to the suspension to start hydrogel crosslinking. The 3D co-cultures were left to gelate at + 37 °C for about 30 min before addition of angiogenic EGM-2 medium. EGM-2 medium was changed three times in a week to induce vascular network formation. After 7 days, EB 5% or EB 5% + EGM2 (1:1) medium was changed to vascular co-cultures before seeding of iPSC-CM or used as a 3D vascular control with EGM-2 medium. Vascular 3D co-cultures were imaged live during the culture period using EVOS microscope with brightfield view and GFP filter before end-point analyses.
3D myocardial co-culturesMyocardial 3D monocultures were established in 48-well plates (Sigma-Aldrich) for qPCR analysis, 1-well on glass for calcium imaging, and in high content imaging 8-well plates (Ibidi) or in high content imaging 48-well plates (MatTek) for immunocytochemical staining or video analysis (Fig. 1). Briefly, ASC (p1 or p4) were detached, counted, and carefully suspended into + 37 ℃ gelatin at 1 × 10⁶ cells/ml. Promptly, + 37 ℃ gellan-gum was added to the suspension to start hydrogel crosslinking. The 3D monoculture was left to gelate at + 37 °C for about 30 min before addition of EGM-2 medium. EGM-2 medium was changed three times in a week. After 7 days, EB 5% or EB 5% + EGM2 (1:1) medium was changed to ASC monocultures and iPSC-CM were seeded on top of the hydrogel at 0.099 × 10⁶ cells/cm2. Myocardial 3D co-cultures were imaged live during the culture period using EVOS microscope with brightfield view before end-point analyses.
3D cardiovascular multiculturesAfter inducing vascular network formation for 7 days, EB 5% or EB 5% + EGM2 (1:1) medium was changed to vascular 3D co-cultures and iPSC-CM were seeded on top of the hydrogel at 0.099 × 10⁶ cells/cm2 (Fig. 1). Cardiovascular 3D multicultures were live imaged live during the culture period using EVOS microscope with brightfield view and GFP filter before end-point analyses.
Immunocytochemistry and imagingThe immunostaining protocol was adapted from Honkamäki et al. (2021). Briefly, after 16 days of culture, cells were washed with dPBS and fixed with 4% paraformaldehyde (Sigma-Aldrich) in dPBS for 60 min at RT. After three washes with dPBS, non-specific binding was blocked with solution containing 10% normal donkey serum (NDS, Millipore), 1% bovine serum albumin (BSA; Sigma-Aldrich) and 0.1% Triton X-100 (Sigma-Aldrich) in dPBS for 90 min at RT. Before primary antibody staining, samples were washed with solution containing 1% NDS, 0.1% TritonX-100 and 1% BSA in dPBS. We used primary antibodies against alpha smooth muscle actin (αSMA, Abcam, ab7817; 1:200) to identify the presence of smooth muscle cells and cardiac troponin t (Abcam, ab64623, 1:1500) to identify cardiomyocytes. Endothelial cells were visible due to of GFP (green fluorescent protein) expression in HUVEC. Primary antibodies were diluted in dPBS with 1% NDS, 1% BSA, 0.1% Triton X-100 solution and incubated for 3 days at 4 ℃. The samples were then washed for three times with 1% BSA in dPBS over a period of 2 days in total. Alexa Fluor 488 (A21202, 1:1500), 568 (A11057 and A11031 1:500 or 1:800) and 647 (A31571, 1:200) secondary antibodies (all from Thermo Fisher) in dPBS with 1% BSA were applied overnight at 4 ℃. The samples were washed with dPBS three times, stained with 0.2 µg/ml DAPI for 3 h at RT and finally washed three times with dPBS before imaging.
Imaging was mainly performed with Nikon Eclipse FN1 Upright Spinning Disk Confocal Microscope using Nikon Plan Fluor 10 × /0.3, WD 16.0 mm (Air)objective and using NIS Elements AR 5.11.00 imaging software (all from Nikon Corporation). Upright microscopy is used due to the thickness of the 3D samples. In addition, EVOS microscope was used to image GFP labeled vascular network and Leica Stellaris 8 confocal microscope with 10X dry objective (Leica Camera AG) to image cardiomyocyte microstructures. Images were further processed with ImageJ v.1.53f51 (Schindelin et al. 2012).
Quantitative real-time PCRBefore RNA collection, 3D cell culture samples were treated with non-specific protease pronase (Millipore) to break down the 3D structure. After pronase treatment, total RNA was extracted using Monarch® Total RNA Miniprep Kit (New England Biolabs GmbH) and further converted to complementary DNA using High-Capacity cDNA Reverse Transcription Kit (Thermo Fisher) according to manufacturer´s protocols. The concentration and purity of the isolated RNA was measured with spectrophotometer (Nanodrop 2000; Thermo Fisher). Quantitative real time reverse transcription polymerase chain reaction (qRT-PCR) was performed with TaqMan Fast Advanced Master Mix (Thermo Fisher) and TaqMan Gene Expression Assays (Thermo Fisher, Table S3) according to manufacturers’ instructions. All measurements were performed with technical triplicates using QuantStudio 12 K Flex Real-Time PCR System (Applied Biosystems). EEF1A1 (Elongation factor 1-alpha 1) and GAPDH (glyceraldehyde-3-phosphate dehydrogenase) were used as endogenous control genes for normalizing qRT-PCR data. Relative quantification of gene expression was performed using the 2−ΔΔCt method (Livak and Schmittgen 2001).
Functional analysesCalcium imagingFunctional cardiac parameters from cardiovascular multicultures and myocardial co-cultures in EB5%:EGM-2 mixture medium were assessed using calcium imaging. Mixture medium was used due to supportive effect to both angiogenic and cardiac specific functions. Cells were loaded with 4 µM Fluo-4 AM (Thermo Fisher Scientific, Waltham, Massachusetts, USA) for 30 min in a perfusate medium. Perfusate medium consisted of 137 mM NaCl, 5 mM KCl, 1.2 mM MgCl2, 0.44 mM KH2PO4, 4.2 mM NaHCO3, 2 mM CaCl2, 1 mM Na pyruvate, 5 mM d-glucose, and 20 mM HEPES dissolved in distilled water (pH adjusted to 7.4 with NaOH). Sample chamber (Fig. 1) was placed onto a holder within Axio Observer.A1 microscope (Carl Zeiss, Germany) with heating plate preheated to 37 ℃ by a TC02-temperature controller (Multichannel Systems, Germany). Medium was changed to preheated medium before recording.
Ca2+ handling of spontaneously beating CM was recorded before and 3–5 min after administration of 1µM adrenaline (E4642, lot. MKCB911, Sigma-Aldrich) using UApo/340 × 20 air objective (Olympus Corporation, Tokyo, Japan) and ANDOR iXon 885 CCD camera (Andor Technology, Belfast, Northern Ireland) synchronized with a Polychrome V light source by a real-time DPS control unit. Fluo-4 AM was excited at 340 nm and 380 nm light and the emission was recorded with ZEN 2.0 (Carl Zeiss, Germany) for 30 s at 505 nm. Calcium imaging analysis was carried out by selecting regions of interest (ROIs) as single-beating iPSC-CM and the subtraction of background noise, recorded from a cell-free area in the same ROI, was done before further analysis.
Video microscopyFunctional cardiac parameters from multicultures and myocardial co-cultures were assessed using video microscopy. Monochrome videos were recorded for 30–60 s (720 × 480 resolution, 30 fps) using video microscopy (Nikon Eclipse TS100, Nikon Corporation, Tokyo, Japan) with a video camera Optika Digi-12 (Optika Microscopes, Ponteranica, Italy). Videos were analyzed using digital image-based correlation (DIC) based analysis method in custom-made software (Ahola et al. 2014) in MatlabR2019a (MathWorks, Inc., USA). Out of the signals obtained from a spontaneously beating iPSC-CM, average parameters of beating were defined as: (1) duration of contraction, (2) time when contracted, and (3) duration of relaxation.
Statistical analysisThe data collected from iPSC-CM in cardiovascular multicultures and myocardial co-cultures and iPSC-CM from 3D controls iPSC-CM and their control iPSC-CM at the primary endpoint were pooled, respectively. Between data, standard error of mean (SEM) will be shown in the gene expression, cellular structure, and functional experiments. The significance between two groups (myocardial construct and cardiovascular construct) was evaluated with the unpaired Student’s t test. In functional experiments n refers to the number of cells. A p value less than 0.05 was considered statistically significant. The statistical significance of the functional and qPCR data was assessed by IBM SPPS Statistics 27-software by using Kruskal–Wallis test and with Bonferroni correction.
Data availabilityThe data sets generated and analyzed for the current study are available from the corresponding author on reasonable request.
留言 (0)