
記住我


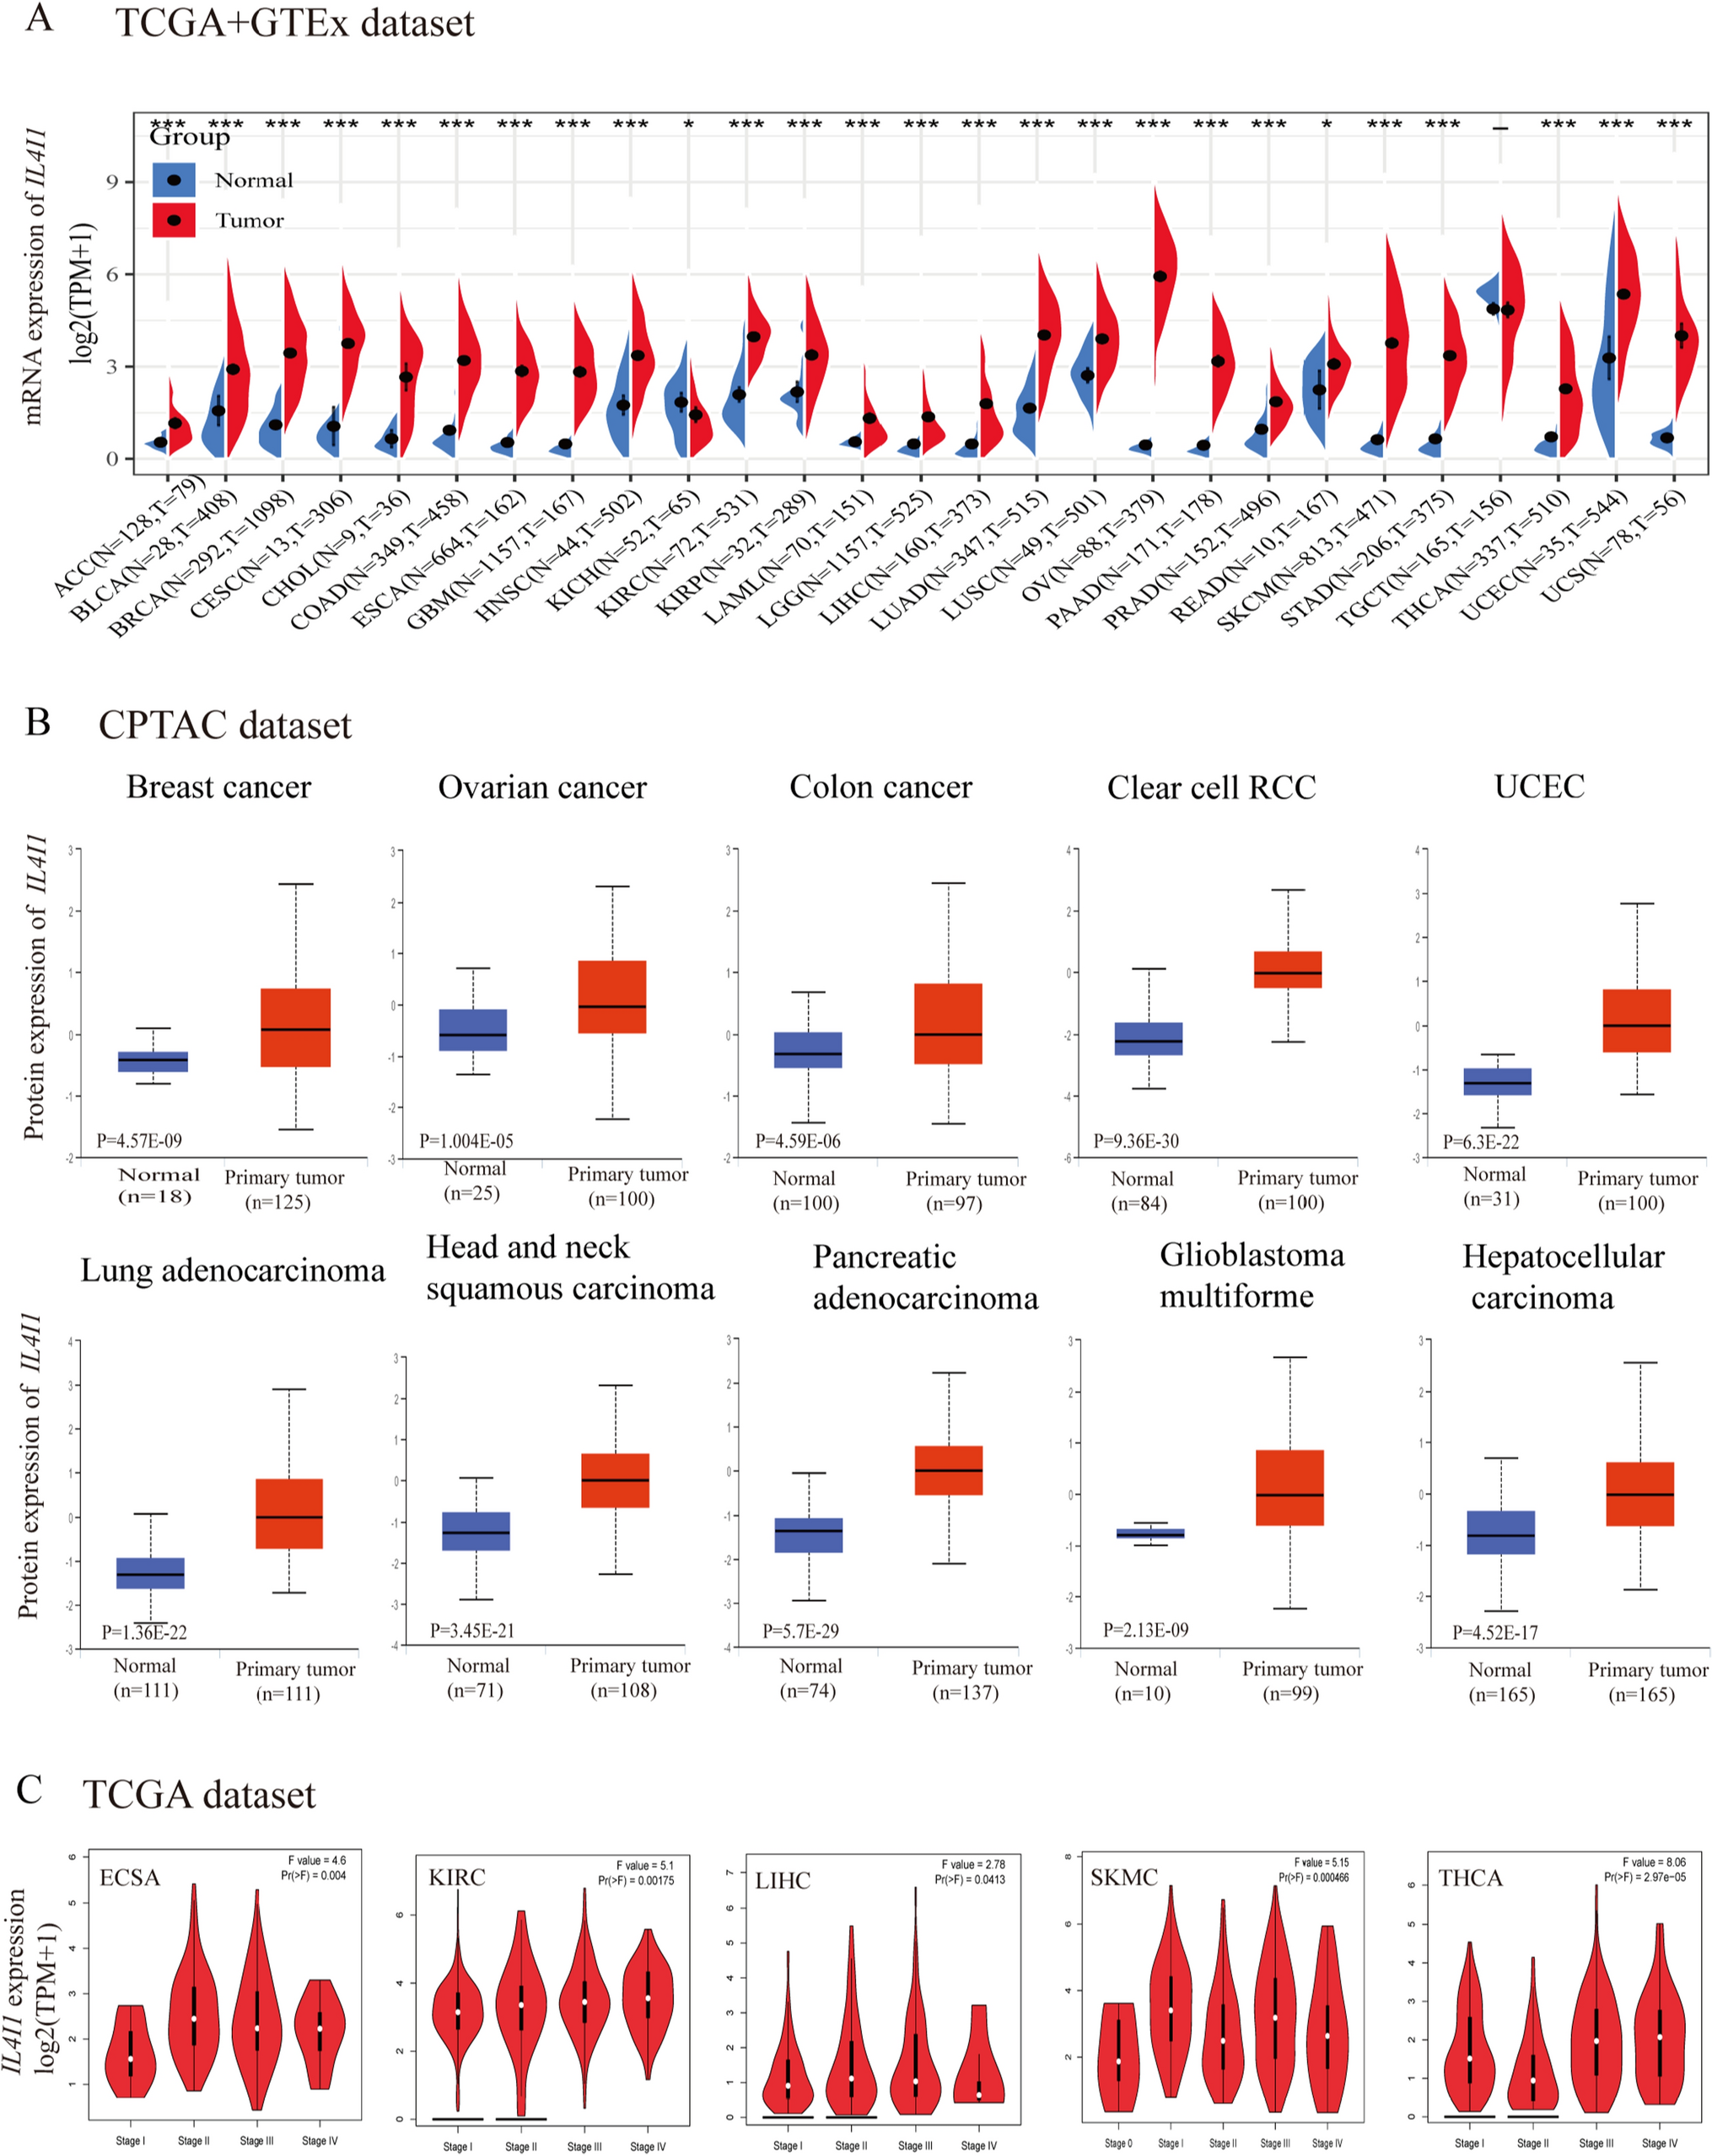
We analyzed the differential expression of IL4I1 in 33 cancers using the TCGA + GTEx database. A significant difference in IL4I1 expression was observed between cancer and normal tissues. The data showed that the expression of IL4I1 was high in 25 types of tumors, namely adrenocortical carcinoma (ACC), bladder urothelial carcinoma, breast invasive carcinoma (BRCA), cervical squamous cell carcinoma and endocervical adenocarcinoma (CESC), cholangiocarcinoma, colon adenocarcinoma (COAD), esophageal carcinoma (ESCA), GBM, HNSC, kidney renal clear cell carcinoma (KIRC), kidney renal papillary cell carcinoma (KIRP), acute myeloid leukemia (LAML), brain lower grade glioma (LGG), liver hepatocellular carcinoma (LIHC), LUAD, lung squamous cell carcinoma (LUSC), ovarian serous cystadenocarcinoma (OV), rectum adenocarcinoma (READ), PRAD, skin cutaneous melanoma (SKCM), stomach adenocarcinoma (STAD), thyroid carcinoma (THCA), UCEC, and uterine carcinosarcoma (UCS) compared with normal tissues; however, the levels of IL4I1 were lower in kidney chromophobe (KICH) (all p < 0.05) (Fig. 1A).
Fig. 1
IL4I1 expression. A Expression of IL4I1 in tumor and normal tissues in the TCGA + GTEx dataset. B IL4I1 total protein in tumor tissues compared with normal tissues. C IL4I1 expression in different stages of various cancers (ESCA, KIRC, KICH, LIHC, SKCM, and THCA)
Next, the CPTAC dataset analysis showed that the expression of IL4I1 total protein in BRCA, COAD, OV, KIRC, HNSC, PAAD, GBM, LIHC, UCEC, and LUAD was significantly higher than that recorded in normal tissues (Fig. 1B). Subsequently, the results of the pathological staging map using the GEPIA2 database also showed a significant correlation between the expression of IL4I1 and the pathological stages of ESCA (p = 0.004), KIRC (p = 0.00175), LIHC (p = 0.0413), SKMC (p = 0.000466), and THCA (p = 2.97e-5) (Fig. 1C). In summary, we found that the mRNA and protein expression levels of IL4I1 were significantly high in the vast majority of tumors, and had a significant correlation with the pathological stage.
3.2 Gene alterationWe further investigated changes in the IL4I1 gene in pan-cancer samples from TCGA using the cBioPortal. The highest frequency of gene changes was found in UCS, diffuse large B-cell lymphoma, and UCEC (5.26%, 4.17%, and 3.97%, respectively) (Fig. 2A, B). A total of 93 mutation sites (70 missense, nine truncation, eight fusion, five splice, and one inframe) were detected between amino acids 0–567 (Fig. 2C). In addition, we studied whether changes in the IL4I1 gene affect the survival and prognosis of patients with tumors. Based on the cBioPortal database analysis, we found statistically significant differences in the OS rate (p = 0.0487); however, there were no statistically significant differences in disease-free survival (p = 0.663), DSS (p = 0.0895), and progression-free survival (p = 0.633) (Fig. 2D). Hence, we concluded that the frequency of change in the IL4I1 gene was low. Consequently, the effect of genetic changes on the prognosis of patients was negligible.
Fig. 2
Alterations in the IL4I1 gene. A Frequency of IL4I1 mutation in multiple pan-cancer studies from the TCGA using the cBioPortal database. B General mutation count for IL4I1 in various cancer types from TCGA using the cBioPortal database. C Mutation diagram for IL4I1 in different cancer types across protein domains. D OS, DSS, DFS, and PFS of patients with cancers carrying genetic alterations
3.3 Prognostic role of IL4I1We further evaluated the significance of IL4I1 as a prognostic indicator for patients with tumors. Univariate Cox regression and Kaplan–Meier survival analyses were conducted using TCGA pan-cancer clinical data from the UCSC database. The result table of univariate Cox regression analysis. IL4I1 is a risk factor for OS in patients with LGG (hazard ratio [HR] = 1.20, p = 6.9e-12), THYM (HR = 1.07, p = 8.4e-9), UVM (HR = 1.22, p = 5.5e-5), GBM (HR = 1.09, p = 5.2e-4), KIRP (HR = 1.02, p = 3.0e-3), KIRC (HR = 1.02, p = 5.0e-3), TGCT (HR = 1.03, p = 7.0e-3), ACC (HR = 1.21, p = 8.7e-3), LIHC (HR = 1.02, p = 0.02) and LUSC (HR = 1.01, p = 0.03); nevertheless, it appears to be a protective factor in SKCM (HR = 0.98, p = 7.1e-6) (Fig. 3A). In addition, to avoid deviations caused by non-cancer events, we performed DSS univariate Cox regression analysis. As shown in Fig. 3B, IL4I1 is a risk factor for DSS in patients with THYM (HR = 1.12, p = 1.5e-16), LGG (HR = 1.20, p = 2.7e-11),GBM (HR = 1.11, p = 9.7e-5), UVM (HR = 1.22, p = 1.6e-4), KIRC (HR = 1.02, p = 2.0e-3), TGCT (HR = 1.03, p = 3.6e-3), ACC (HR = 1.21, p = 0.01), KICH (HR = 1.28, p = 0.01), and KIRP (HR = 1.02, p = 0.02). Notably, it is a protective factor in SKCM (HR = 0.98, p = 1.5e-5).
Fig. 3
Survival analysis comparing the high and low expression of IL4I1 in different types of cancer in TCGA cohort. A, B Relationship between IL4I1 expression and prognosis (OS and DSS) of patients with different cancers in TCGA cohort. C Survival curves of OS with significance for seven types of cancer (i.e., GBM, KIRP, LAML, LGG, LIHC, SKCM, and UVM) in TCGA
Kaplan–Meier survival analysis showed that high IL4I1 expression predicted worse OS in patients with GBM, KIRP, LAML, LGG, LIHC, and UVM; in contrast, it was associated with better OS in patients with SKCM (Fig. 3C). These results suggest that the high expression of IL4I1 plays a major role in tumorigenesis in most tumor types.
3.4 GSEA of IL4I1We performed GSEA and KEGG pathway enrichment analysis to evaluate the role of IL4I1 in 33 tumors from TCGA. The results showed that IL4I1 is closely related to immune-related pathways, such as “T cell receptor signaling”, “intestinal immune network for IgA production”, “chemokine signaling”, “cytokine-cytokine receptor interaction” participating in the immunomodulatory effect between lymphoid and non-lymphocytic pathways. This was particularly observed in CESC, GBM, LAML, PPAD, pheochromocytoma and paraganglioma, PRAD, and other tumors (Fig. 4A–F). These results suggest that IL4I1 is closely related to the regulation of TIME and ligand receptor interaction between lymphoid and malignant tumor cells.
Fig. 4
GSEA of IL4I1 in the pan-cancer setting. A–F The top 5 results of the GSEA in indicated tumor types (NES ≥ 1.5; adjusted p-value < 0.05)
3.5 Analysis of immune cell infiltrationAfter revealing that IL4I1 is closely related to the immunomodulatory pathway by GSEA analysis, we focused on the invasion of immune cells in the tumor microenvironment. Using the TIMER2 database, we found that the expression of IL4I1 was positively correlated with the degree of invasion of TAM and cancer-associated fibroblasts (CAF) in pan-cancerous tissues (Fig. 5A). Our results also showed that the expression of IL4I1 in CESC, COAD, ESCA, HNSC, KIRP, LGG, LIHC, GBM, LUAD, pheochromocytoma and paraganglioma, READ, sarcoma, STAD, and testicular germ cell tumors was negatively correlated with tumor purity and positively correlated with the degree of TAM invasion (Fig. 5B).
Fig. 5
Immune cell infiltration analysis. A Correlation between IL4I1 expression and the levels of TAM and CAF infiltration in pan-cancer samples from TCGA using the TIMER2 database. B Correlation between IL4I1 expression and tumor purity, and TAM infiltration levels in pan-cancer samples from TCGA using the TIMER2 database
Next, we examined the relationship between IL4I1 and immune checkpoints, MHC, immunostimulatory genes, immunosuppressive genes, chemokines, and chemokine receptors. The vast majority of chemokines and chemokine receptors, such as C–C motif chemokine ligand 5 (CCL5), C-X-C motif chemokine ligand 9 (CXCL9), CXCL10, C-X-C motif chemokine receptor 6 (CXCR6), C–C motif chemokine receptor 1 (CCR1), and CCR5, were positively correlated with IL4I1 in most tumors. Similarly, MHC, immunostimulatory genes, and immunosuppressive genes, such as major histocompatibility complex, class I, E (HLA-E), HLA-B, hepatitis A virus cellular receptor 2 (HAVCR2), colony stimulating factor 1 receptor (CSF1R), programmed cell death 1 ligand 2 (PDCD1LG2), CD86, CD27, CD28, and TNF receptor superfamily member 9 (TNFRSF9), were positively correlated with IL4I1 in most tumors (Fig. 6A). Furthermore, most immune checkpoint genes, such as cytotoxic T-lymphocyte-associated protein 4 (CTLA4), PDCD1, CD274, CD80, and perforin 1 (PRF1), were positively correlated with IL4I1 in most tumors (Fig. 6B). Using the correlation between IL4I1 and 28 tumor-associated immune cells calculated by a single-sample GSEA algorithm, it was found that IL4I1 was positively correlated with most immune cells, particularly TAM (Fig. 6C).
Fig. 6
Correlation between IL4I1 and immunosuppressive genes. A Heatmap representing the correlation between IL4I1 expression and immune checkpoints, MHC, immunostimulatory genes, immunosuppressive genes, chemokines, and chemokine receptors. B Heatmap representing the correlation between IL4I1 expression and chemokine genes. C Heatmap representing the correlation between IL4I1 expression and 28 tumor-associated immune cells. The Pearson’s correlation coefficient was calculated using the R software. *p < 0.05, **p < 0.01, ***p < 0.001, and ****p < 0.0001
3.6 Expression profile of IL4I1 in a single-cell level and its potential functional status in pan-cancerThe expression profile of IL4I1 at the single-cell level and its potential functional status in pan-cancer were explored through an analysis of CancerSEA. As shown in Fig. 7A, IL4I1 expression was significantly positively correlated with inflammation, angiogenesis, and DNA repair in BRCA, IL4I1 expression was negatively correlated with cell cycle, DNA damage, DNA repair, EMT, invasion, and metastasis in GBM and UM, and IL4I1 expression was positively correlated with EMT, hypoxia, Quiescence, and stemness in OV. Figure 7B shows the relationship between IL4I1 expression and DNA repair, inflammation in BRCA. Figure 7C shows the relationship between IL4I1 expression and DNA repair, invasion in GBM, and Fig. 7D shows the relationship between IL4I1 expression and DNA repair, apoptosis, DNA damage and invasion, EMT in UM. In addition, T-SNE plots showed the distribution of IL4I1 expression in individual cells of BRCA, GBM and UM (Fig. 7E–G). Taken together, these results suggest that IL4I1 may play an important role in tumor progression.
Fig. 7
IL4I1 expression and cancer functional states at a single-cell level. A IL4I1 expression was correlated with cancer functional states in pan-cancer. B–D The association between IL4I1 expression and cancer function in BRCA, GBM, and UM. (E–G) The t-SNE plot indicated IL4I1expression profile in single cells of BRCA, GBM, and UM. (*, p < 0.05, **, p < 0.01, ***, p < 0.001)
3.7 Single-cell transcriptome analysis of the IL4I1 expression in the glioma tumor microenvironmentFour single-cell samples of gliomas were subjected to scRNA-seq analysis (Table 1). After quality control (QC) using Seurat, information from 7919 high-quality single cells was utilized for subsequent analysis. Cell clustering analysis based on the t-Distributed Stochastic Neighbor Embedding (tSNE) algorithm showed that the above cells could be classified into 15 classes (Fig. 8A), and subsequent cell annotation yielded six classes of cells, namely, astrocytes, macrophages, monocytes, endothelial cells, tissue stem cells, and T cells (Fig. 8B). Furthermore, we compared IL4I1 expression in different cell types (Fig. 8C), and we found low expression in the majority of cells and high expression only in macrophages. Similarly, we found significant differences in IL4I1 expression in different cells, with the highest expression in macrophages (Fig. 8D). These results suggest that IL4I1 is significantly different in different cells of the glioma tumor microenvironment and that targeting IL4I1 may be a breakthrough in regulating the tumor microenvironment.
Table 1 Sample informationFig. 8
Single-cell transcriptomic atlas of glioma. A t-SNE plot colored by various cell clusters. B The cell types identified by marker genes. C A tSEN plot of IL4I1expression in different cell types. D Comparison of IL4I1expression in different glioma tumor microenvironment cells
3.8 IL4I1-binding protein network and methylation analysisThe functional enrichment of IL4I1 in cancer was investigated by mapping its protein interaction network using the STRING database. The results revealed 10 genes which constituted the protein interaction network, namely acireductone dioxygenase 1 (ADI1), branched chain keto acid dehydrogenase E1 subunit alpha (BCKDHA), betaine-homocysteine S-methyltransferase 2 (BHMT2), dopa decarboxylase (DDC), 4-hydroxyphenylpyruvate dioxygenase (HPD), indoleamine 2,3-dioxygenase 1 (IDO1), IDO2, methionine adenosyltransferase 2A (MAT2A), nitrilase family member 2 (NIT2), tryptophan 2,3-dioxygenase (TDO2), and Interleukin-4 inducible gene 1 (IL4I1) (Fig. 9A).
Fig. 9
IL4I1-binding protein network and methylation analysis. A IL4I1-correlated network. B Significant differential mRNA expression of IL4I1 and its binding proteins in normal and tumor tissues in TCGA database. C Differential methylation of IL4I1 and its binding proteins between tumor (T) and normal (N) samples in each type of cancer. Red and blue dots represent increased and decreased methylation in tumors, respectively. Higher color intensity indicates larger difference in the level of methylation. D Correlation between methylation and mRNA gene expression. Red and blue points represent a positive and negative correlation, respectively. Higher color intensity denotes stronger correlation. E The relationship between high and low methylation levels of IL4I1 and its binding proteins and patient survival. Red and blue dots represent worse and better survival of patients in the hypermethylation group, respectively. The dot size represents the statistical significance; larger dots indicate higher statistical significance
Subsequently, the expression of 11 genes in the pan-cancer setting was analyzed using the GSCALite platform. Results indicated high expression of IL4I1, TDO2, NIT2, and IDO1, while IDO2, ADI1, DDC, HPD, BHMT2 exhibited low expression in most cancers (Fig. 9B). Next, we investigated differences in the methylation of IL4I1 and binding proteins between tumor and normal tissues in 14 cancer types. The results showed that IL4I1 methylation was downregulated in most types of cancer, including KIRC, UCEC, BRCA, LUSC, THCA, KIRP, and LUAD (Fig. 9C). Thereafter, we evaluated the correlation between IL4I1 methylation and expression in 32 cancer types. The results showed that the expression levels of IL4I1 and most of its binding proteins were negatively correlated with methylation; the levels of only a few binding proteins were positively correlated with methylation (Fig. 9D). Finally, we evaluated the relationship between the levels of IL4I1 methylation and OS in 22 cancer types. The results showed that hypomethylation of IL4I1 was associated with poor prognosis in LGG, UVM, and LAML, while hypermethylation of IL4I1 was associated with poor prognosis in SKCM and HNSC (Fig. 9E).
3.9 Drug and pathway activity analysis showed the role of IL4I1 in the pan-cancer cohortThe relationship between the expression of IL4I1-related genes and their protein interactions, and the activation or inhibition of common signaling pathways, was investigated using the GSCALite platform. The results of the pathway activity analysis showed that IL4I1 was related to epithelial–mesenchymal transition (EMT), apoptosis, cell cycle and estrogen receptor activation, and the inhibition of hormone androgen receptor, phosphatidylinositol 3 kinase/protein kinase B (PI3K/AKT), and receptor tyrosine kinase (RTK) pathways (Fig. 10A, B).
Fig. 10
The role of IL4I1 in established cancer-related pathways (GSCALite), and drug analysis of common genes based on GDSC data. A Pie chart of pathway activity. B Heatmap of pathway activity. C Volcano plot of the correlation between IL4I1 and the IC50 values of drugs. Blue and red dots indicate negative and positive correlation groups, respectively. D IC50 values of BMS-754807 and docetaxel in high- and low-IL4I1 groups. E Correlation between IL4I1 expression and the IC50 values of BMS-754807 and docetaxel
We downloaded the IC50 values of anticancer drugs and gene expression profiles of related cell lines from the GDSC database. To explore the effect of IL4I1 expression on the sensitivity to anticancer drugs, we compared the correlation between the expression of IL4I1 and the IC50 of those agents. We screened 18 anticancer drugs; of those, four were negatively correlated with IL4I1, including CAL-101 (PI3K inhibitor), temozolomide, and other anticancer drugs. The remaining 14 drugs were positively correlated with IL4I1, including BMS-754807 (insulin-like growth factor 1 receptor/insulin receptor [IGF-1R/IR] inhibitor), docetaxel, afatinib (tyrosine kinase inhibitor), and trametinib (MEK inhibitor) (Fig. 10C). To investigate the effect of IL4I1 expression on the sensitivity to anticancer drugs, tumor cells were divided into high- and low-IL4I1 groups, and their IC50 values were compared. The IC50 of BMS-754807 and docetaxel were increased in the high-IL4I1 group versus the low-IL4I1 group (Fig. 10D). In addition, the IC50 values of BMS-754807 and docetaxel were positively correlated with the expression of IL4I1 (Fig. 10E). These results suggest that patients with high expression of IL4I1 may be resistant to BMS-754807 and docetaxel.
3.10 Validation of IL4I1 expression in glioma tissuesOur study found that the expression level of IL4I1 in gliomas was significantly higher than that in normal brain tissue (Figure S1A). Next, we performed a survival analysis, and similar to the previous results, the higher the expression level of IL4I1 the shorter the survival time of the patients (Figure S1B, Supplementary Table S1). This suggests that IL4I1 is a potential target for glioma treatment.
留言 (0)