
記住我


The 5-MTP concentrations were divided into three groups according to X-tile (Yale University, New Haven, CT, United States) [20]: low (149.8–204.9 ng/mL), medium (204.9–266.5 ng/mL) and high (266.5–367.5 ng/mL) to achieve the homogeneity and the heterogeneity of intra-group as well as inter-group survival rates, respectively.
Clinical Baseline DataTable 1 shows the baseline characteristics of 407 patients grouped by 5-MTP concentration. With increased 5-MTP levels, NT-proBNP showed a downward trend, LVEF showed an upward trend, and the proportion of Killip I increased, while the proportion of Killip II ~ III and IV grades decreased. Significant differences were observed in NT-proBNP, LVEF, and Killip classifications among the three groups (p < 0.05).
Table 1 Patients’ baseline and follow-up data grouped according to 5-MTP levelsMultiple comparisons showed statistical differences in NT-proBNP between the high and low 5-MTP groups, respectively. Although difference of LVEF between low and middle as well as low and high groups was statistically significant, no significant difference was noticed in LVEF between the middle and high groups, respectively (Fig. 2A, B).
Fig. 2
(A, B) Multiple comparisons of NT-proBNP and LVEF among three groups with high, middle, and low 5-MTP concentrations. (C, D) Correlation between 5-MTP and NT-proBNP and 5-MTP as well as LVEF, respectively. LVEF, left ventricular ejection fraction; 5-MTP, 5-methoxytryptophan; NT-proBNP, N-Terminal pro-brain natriuretic peptide
HF during hospitalization or baseline HF (n = 267) was characterized by the symptoms or signs of suspected HF during hospitalization and NT-proBNP ≥ 300 pg/mL, excluding other causes. According to LVEF, it was divided into HFrEF (LVEF ≤ 40%), HFmrEF (LVEF:41–49), and HFpEF (LVEF ≥ 50%) [19]. The diagnosis of HFpEF also fulfilled the echocardiographic determination criteria with E/e' ≥ 15 or resting cardiac catheterization indicating pulmonary capillary wedge pressure (PCWP) ≥ 15 mmHg.
Correlation between 5-MTP, other Biomarkers, and LVEFSpearman’s rank correlation analysis showed no significant correlation between 5-MTP and CK, CK-MB, hsTNT, hsCRP, WBC, and other biomarkers, respectively. However, 5-MTP was significantly correlated with NT-proBNP (r = –0.133, p < 0.05) and LVEF (r = 0.193, p < 0.001, Fig. 2 C, D).
Group Comparison based on MACETable 2 shows that the MACE ( +) group was older with a higher proportion of diabetes, MI, three-vessel disease, and left main lesion. Additionally, the MACE ( +) group’s NT-proBNP (pg/mL) [2070.5 (1106.75, 4649.25) vs. 491.8 (165.3, 1201.0), p < 0.05], Cr (µmol/l) [82 (65,108) vs. 73 (65,86), p < 0.05], and HsCRP (mg/L) [16.29 (5.14,74.95) vs. 5.52 (2.53, 13.24), p < 0.05] was significantly higher than the MACE (-) group. The MACE ( +) patients’ LVEF was reduced [45 (40,51) vs. 50 (46.5,56), p < 0.001]. Moreover, the 5-MTP level was significantly reduced in MACE ( +) patients than in MACE (-) patients [226.15 (191.53,278.80) ng/mL vs. 262.00 (208.80,310.80) ng/mL, p < 0.05, Fig. 3A].
Table 2 Patients’ baseline characteristics stratified by MACEsFig. 3
(A) Comparison of 5-MTP levels in each group based on MACEs. (B) Forest plot shows univariate and multivariable COX regression analyses and the HRs with 95% CIs for MACE adjusted for sex, age, hypertension, diabetes, MI history, NT-proBNP, Cr, hsCRP, LVEF, triple vessel disease and left main artery disease. (C, D) Kaplan–Meier survival curves of MACEs and HF in 407 patients with AMI. (E, F) ROC curve of baseline 5-MTP concentration to predict 1-year MACE and HF of patients with AMI after discharge
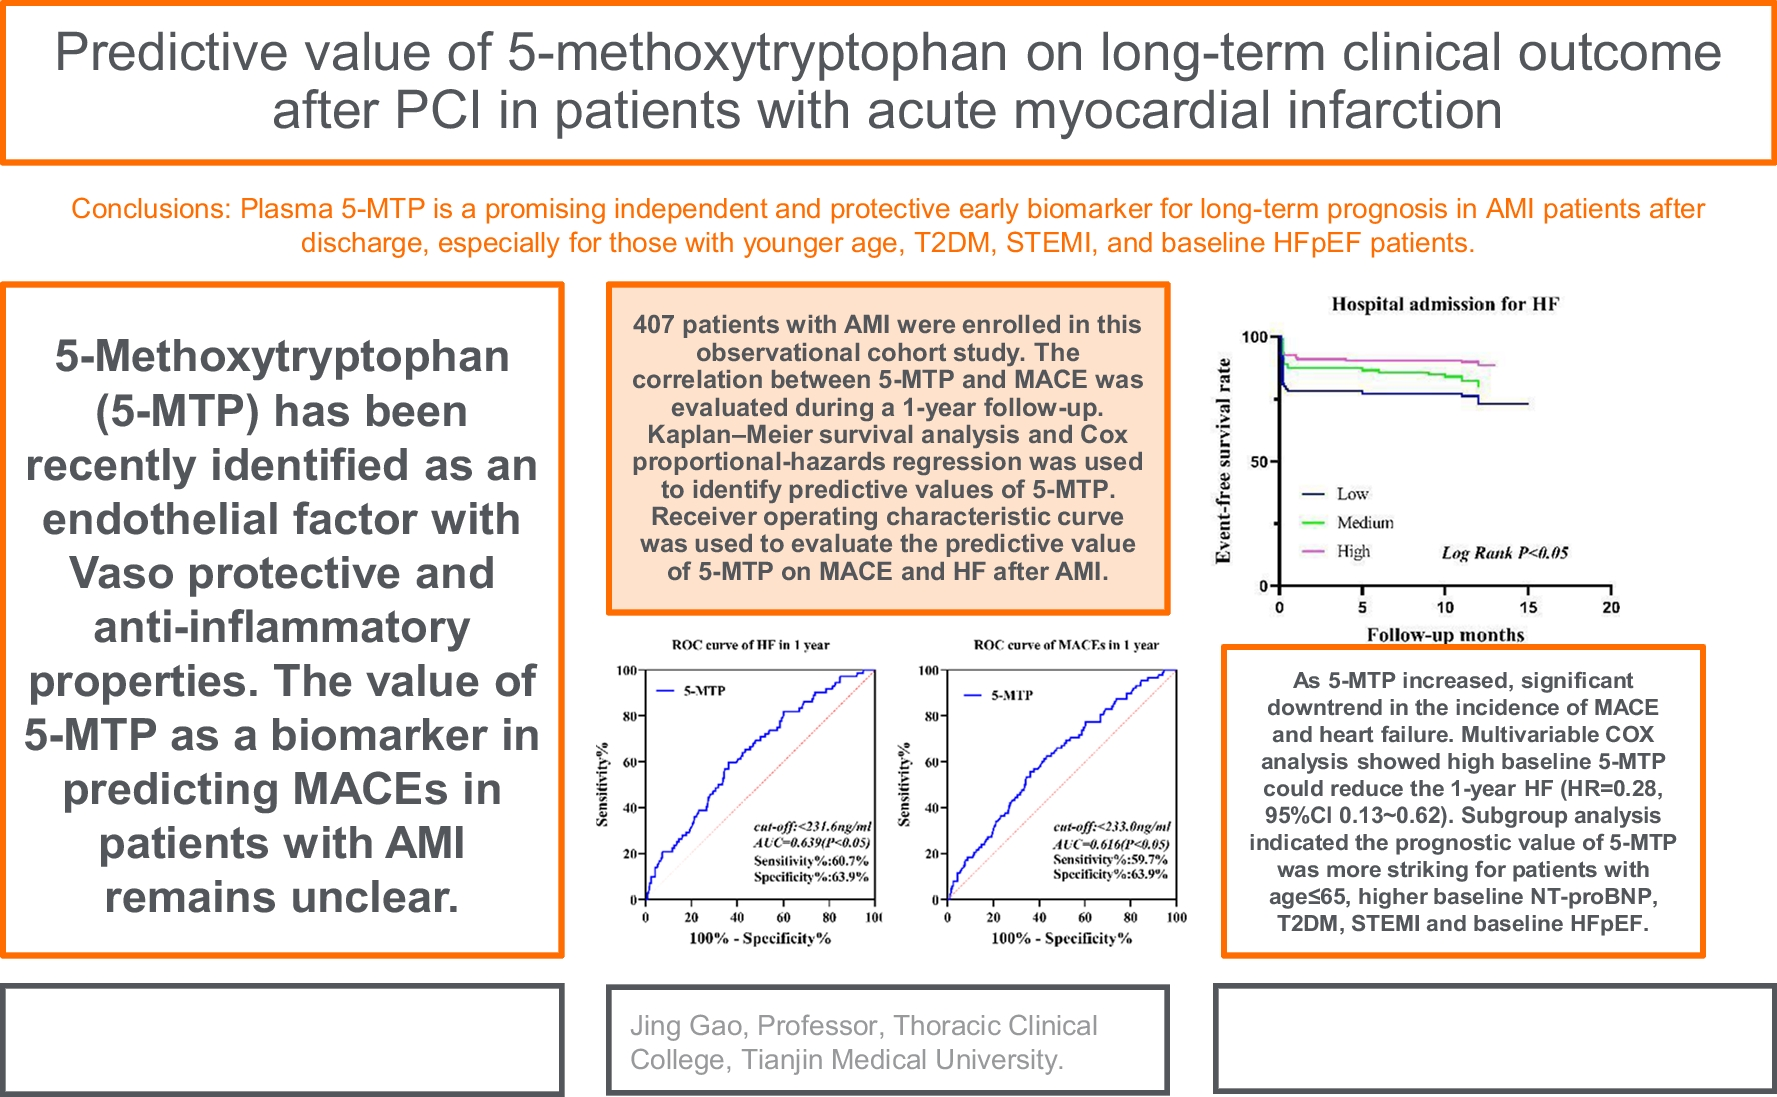
Follow-Up ResultsWith a median follow-up length of 12 months, all patients were followed up to 1 year after discharge. A total of 88 patients (21.6%) experienced at least one MACE. The incidence of MACE in low, middle, and high 5-MTP groups were 32 (30.2%), 29 (24.2%), and 27 (14.9%), respectively (χ2 = 9.85, p < 0.05). Multiple comparisons showed there was a significant difference between the low and high groups, respectively. The incidence rate of HF hospitalization in low, middle, and high 5-MTP groups were 28 (26.4%), 24 (20.0%), and 20 (11.0%), respectively (p < 0.05). Multiple comparisons showed that there was a significant difference between the low and high 5-MTP groups, respectively. Additionally, all-cause death occurred in 4 (4.8%), 3 (2.5%), and 3 (1.7%) cases in low, middle, and high groups respectively which was non-significant (p > 0.05). Similar results were obtained for other events such as recurrent non-fatal MI, TLR, and stroke (p > 0.05, Table 1).
Kaplan–Meier survival curve showed that 5-MTP level was associated with 1-year MACE and HF hospitalization after AMI. Furthermore, the hospital admission for HF event-free survival rate and the 1-year MACE event-free survival rate steadily increased as the 5-MTP levels rose; the difference was statistically significant (all Log Rank p < 0.05, Fig. 3C, D).
ROC curve analysis revealed that plasma 5-MTP had a good area under the curve (AUC) to predict MACE (AUC:0.616, 95% Cl 0.551–0.680) and hospital admission for HF (AUC: 0.639, 95% Cl 0.571–0.707) 1-year post-MI. (Fig. 3E, F).
Predictive Value of Plasma 5-MTP on MACE in One Year after AMI by COX Regression AnalysisThe 5-MTP concentration was included in the construction of the univariate COX regression equation. The results showed that in comparison to the low 5-MTP level, the effect of high 5-MTP on 1-year MACE was statistically significant (HR = 0.444, 95% Cl 0.266–0.742, p < 0.05, Fig. 3B).
Table 3 shows a multivariable COX regression equation that included traditional risk factors like sex, age, hypertension, diabetes, MI history, NT-proBNP, Cr, hsCRP, LVEF, triple vessel disease, left main artery disease, and 5-MTP. Furthermore, NT-proBNP was adjusted to a binary variable according to 300 pg/mL [19]. The results showed that when compared with low 5-MTP levels, the effect of high 5-MTP level on 1-year MACE was statistically significant (HR = 0.326, 95%Cl 0.166–0.641, p = 0.001).
Table 3 Multivariable COX regression analysis of the factors influencing MACE 1 year after AMIHigh 5-MTP concentration could reduce the 1-year incidence of HF (HR = 0.279, 95%Cl 0.126–0.619, p = 0.002) in comparison with low 5-MTP concentrations.(supplementary Table 1).
Subgroup multivariable COX regression analysis (Fig. 4 A ~ F) showed that the predictive value of 5-MTP for 1-year MACE was more significant in patients ≤ 65 years (HR = 0.299, 95%Cl 0.124–0.718, p = 0.007), males (HR = 0.298, 95%Cl 0.125–0.711, p = 0.006) and those with high NT-proBNP (HR = 0.299, 95%Cl 0.139–0.645, p = 0.002), T2DM (HR = 0.172, 95%Cl 0.059–0.502, p = 0.001), STEMI (HR = 0.235, 95%Cl 0.100–0.551, p = 0.001), and baseline HFpEF (HR = 0.115, 95%Cl 0.017–0.771, p = 0.026) characteristics.
Fig. 4
Classification of subgroups: (A) 407 patients by age ≤ 65 years vs. age > 65 years; (B) Male vs. Female; (C) High NT-proBNP vs. Low NT-proBNP (NT-proBNP ≥ 300 pg/mL was defined as High, otherwise as Low); (D) T2DM vs. non-T2DM; (E) STEMI vs. NSTEMI, and (F) 267 patients with HF during hospitalization by HFrEF vs. HFmrEF vs. HFpEF
留言 (0)