
記住我


The alarming rise in myopia prevalence, which is predicted to afflict half of the world's population by 2050,1 and its associations with ocular disease2–4 have led to a vast interest in the development of myopia management interventions for reducing the rate of myopia progression. Current myopia management interventions fall into three main categories: pharmacological atropine eye drops,5,6 contact lens wear (orthokeratology7,8 and soft contact lenses9–11), and spectacle lenses.12–16 Atropine users may experience dose-dependent side effects and inconveniences such as near vision blur and photophobia.17 Contact lens wearers require ongoing contact lens care and maintenance and have an increased risk of ocular inflammation and infection.18,19 These issues with atropine and contact lenses make spectacle lenses an attractive option for parents and children with myopia.
Recent spectacle lens designs that have shown efficacy in myopia management have a clear central distance zone surrounded by lenslets,14,20 light scattering elements,15 or annular cylindrical microstructures,16 arranged rotationally symmetric in a peripheral treatment zone. This arrangement creates a quasi-static optical cue to the eye, that is, a signal that remains substantially constant across various locations in the peripheral visual field (Lahav-Yacouel, et al. IOVS 2023;64:ARVO E-Abstract 4951). Adaptation to a static optical cue may be a factor in declined efficacy over time,21 and spectacle lenses used for myopia management also demonstrate declined efficacy when worn for at least 2 years13–15 (Chalberg, et al. IOVS 2023;64:ARVO E-Abstract 5092). Therefore, minimizing any adaptation effects, either by changing treatments22 or by providing a dynamic optical cue,21 may improve efficacy over time.
This paper introduces a new spectacle lens approach that provides optical cues to the eye via the utilization of optical film designs incorporating Spatio-Temporal Optical Phase (S.T.O.P.) technology. The premise of this technology is twofold. First, the introduction of spatially varied optical cues to the localized portion of the retina influences ocular growth and refractive development, as shown in animal studies.23 Second, the provision of an optical cue that is temporally varying, i.e., dynamic, may improve efficacy over time.21 Spatio-Temporal Optical Phase technology has also been applied to contact lenses via a combination of an asymmetric power map and contact lenses that freely rotate on eyes.21 By contrast, the film designs in the current study feature a clear central viewing zone and a plurality of different optical elements composed of aggregate positive power with azimuthally varying power distributions that are arranged rotationally asymmetric in a peripheral treatment zone. The introduction of this type of power distribution aims to disrupt the symmetry that is otherwise imposed by existing lenslet-based (spherical/aspherical) solutions, providing a unique method of delivering spatially varied cues to the localized retina.
To produce the temporally varying (or dynamic) optical signal, two pairs of different film designs are applied to the front surface of two standard single-vision spectacles and worn according to a prescribed wearing schedule. This schedule requires the wearer to alternate the spectacles with the different film pairs at a prescribed interval to achieve the desired temporal change in treatment. Specifically, due to the nonrotationally symmetric features of each film design, i.e., the power distribution and the arrangement of the optical elements, any change in the design or the design orientation creates a spatially and temporally varying optical cue to the eye. It is therefore hypothesized that, in addition to slowing the rate of myopia progression, the use of these films may also reduce cue adaptation and thus sustain the efficacy over a longer period.
Films containing optical elements can adversely affect visual performance, and different film pairs (pairs with different designs or design orientations) can result in a variation of visual performance. Due to the requirement of having to change the film pairs to achieve the desired spatio-temporal variation, the visual performance between the different film pairs needs to be both comparable and interchangeable. Additionally, the optical film itself may also influence visual performance. Thus, the aims of this study were threefold: first, to assess the visual performance of these film pairs against a control consisting of a film pair with no optical elements; second, to assess the visual performance between different film pairs to determine comparability and interchangeability between designs; and third, to compare the visual performance of the control against single-vision spectacle lenses without a film.
METHODS ParticipantsChildren are the targeted population for myopia management, but participants in the current study were healthy nonpresbyopic young adults between the ages of 18 and 40 years (inclusive). Young adults were used in this study because they represent a convenient population with similar visual demands to children,24 and it is easier to recruit young adults in studies assessing the visual performance of myopia management devices.25 Young adults also tend to be more sensitive than children when assessing myopia management spectacle lenses.26 Sensitivity was an essential consideration as comparability and interchangeability between test film pairs are required to successfully alternate between spectacles containing different film pairs and thus achieve the desired dynamic signal. Participants were also required to have a spherical-equivalent myopic correction of ≤−0.75 D, have no greater than 2.00 D of astigmatism, achieve a best-corrected high-contrast visual acuity of at least 0.10 logMAR (6/7.6) in each eye at 6 m, not be pregnant, have no history of refractive surgery, and have no systemic or ocular conditions that may affect vision.
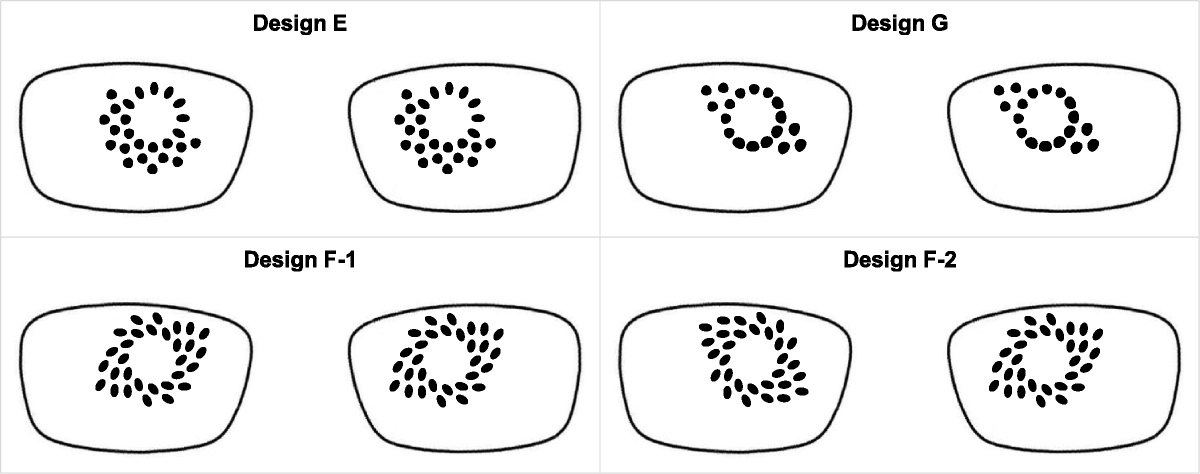
Optical film designsThe control film pair (control) contained no optical elements. Each test film contained optical elements in the peripheral treatment zone and featured a clear central zone diameter between 9.5 and 10.5 mm. Each type of element is defined by its azimuthally varying power distribution resulting in elements with different shapes. Those elements exhibiting a larger magnitude of change in the azimuthal power variation have a more elliptical shape and cause a relatively larger degree of local retinal inhomogeneity, which may improve efficacy but at the expense of visual performance. The arrangement of elements in each design was always nonrotationally symmetric and limited to three different patterns, which can be loosely described as semicircular, linear, and spiral. The choice of element types and patterns within each design was hypothesized to provide a balance between visual performance and potential efficacy. Pilot testing among trained observers was used to determine test film pairs that appeared to achieve comparable and interchangeable visual performance. Four tests were chosen for assessment in the current study, as shown in Fig. 1, comprising designs E, G, F1, and F2. Designs E and G feature different optical elements and exhibit a semicircular and linear pattern, respectively, whereas the F designs have only one type of element in a spiral pattern. Designs E, F-1, and G have the same orientation of elements for the right and left eyes producing an asymmetric distribution of elements between the nasal and temporal regions of each eye. F-2 is mirror-symmetric between eyes, resulting in a greater distribution of elements in the nasal region of both eyes. The authors hypothesize that elements located nasally may offer improved myopia management efficacy because they are in the same region used when reading. Conversely, elements located in the temporal region may not be as effective for myopia management. Therefore, mirror-symmetric designs featuring elements located in the temporal region of both eyes were not assessed in the current study. All optical film pairs were applied to the front surface of single-vision spectacle lenses made in hard-coated CR-39 material using an optically clear adhesive, and the final spectacles were dispensed to participants.
 FIGURE 1:
 Spatiotemporal optical phase (S.T.O.P.) test film pairs.
Study designThis was a prospective, single-masked (participant), randomized, crossover, bilateral wear study where one control film pair and four test film pairs were applied to single-vision spectacle lenses (Fig. 1) and worn by each participant for a minimum of 3 days to a maximum of 5 days, for a minimum of 6 hours per day. The study was reviewed and approved by the Bellberry Human Research Ethics Committee, Adelaide, Australia, prospectively registered on the Australian New Zealand Clinical Trials Registry (ANZCTR: ACTRN12621001264875) and followed the tenets of the Declaration of Helsinki. The study was conducted at the nthalmic Pty Ltd clinic in Sydney. Potential participants were recruited from the local Sydney area and attended a screening visit, which comprised a routine optometric examination, to determine eligibility for this study. Eligible participants were invited to attend a baseline visit where they selected a suitable spectacle frame. Once spectacles were made to specifications, the film pairs were applied, and participants returned for two dispensing and collection visits (Fig. 2). All participants gave written informed consent prior to any study procedures being performed.
 FIGURE 2:
 Flowchart to indicate disposition of participants from screening to end of study.
Study visits BaselineDemographic data including age, sex, and ethnicity were collected. Autorefraction/autokeratometry was measured using an open-field Grand Seiko WAM-5500 (Shigiya Machinery Works Ltd, Hiroshima, Japan), subjective distance refraction was performed, and the ocular surface was assessed with a slit-lamp biomicroscope (KSL-H5; Keeler, Windsor, United Kingdom).
An appropriate spectacle lens prescription was derived for each participant. Participants chose a suitable spectacle frame, and the monocular pupil distance and pupil heights relative to the frame were measured. Both the monocular pupil distance and pupil heights were taken from the pupil center. Five identical pairs of single-vision spectacles (the same frame [model, size, color], monocular pupil distance and pupil heights, and spectacle lens prescription made in hard-coated CR-39 material) were ordered for each participant. One pair of optical films was applied to the lens front surfaces of each finished pair of spectacles so that each participant received five pairs of spectacles comprising one control and four tests. The order of study spectacle wear was randomized using an online calculator to generate a block randomization plan with balanced permutations.
Spectacle dispensing visitsAt the first dispensing visit, visual acuity–based measurements were initially taken while wearing a pair of study spectacles before a pair of optical films was applied to the front surface of the lenses (no film control). Following these measurements, participants were given the first set of study spectacles, which consisted of the first three pairs of spectacles plus optical films. At the second dispensing visit, participants were given the second set, which consisted of the last two pairs of study spectacles plus optical films. All spectacles were adjusted and checked to make sure the participant was looking through the clear central viewing zone in primary gaze. Visual acuity–based measurements and heterophoria (phoria) were measured while wearing each pair of adjusted study spectacles. The order in which study spectacles were worn for these measurements was as per randomization. Participants were verbally instructed to wear study spectacles as they would wear their habitual spectacles.
To minimize the risk of wearing study spectacles out of sequence, each pair of spectacles was supplied to participants in a separate bag clearly marked with the number denoting the order in which spectacles were to be worn. Each spectacle also had a label attached with the same number. Participants were instructed to only wear the allocated spectacles at any time and to return spectacles to the same bag when wearing was complete. A questionnaire was sent via email to participants to complete at the end of the third day of wear.
Spectacle collection visitsAt these visits, spectacles were collected from the participants, and compliance with spectacle wear was ascertained.
Study proceduresAll data were collected using direct data entry on an Internet-based database (Castor EDC: https://au.castoredc.com/).
QuestionnairesSubjective ratings were assessed with a nonvalidated numeric rating scale (1 to 10 in 1-point steps). Participants entered data directly into the Castor database via a link sent to them through email after spectacles were worn for 3 days. Subjective ratings (where 1 = bad, 10 = good) comprised clarity of vision (when looking far-away, intermediate, and near distances), vision while walking, vision at night (if worn), and overall vision satisfaction (where 1 = not satisfied, 10 = satisfied).
Participants were also asked about their wearing time, comprising the average number of hours spectacles were worn per day. Willingness to purchase was assessed by answering the question: “Would you purchase these lenses if they cost the same as your normal correction and they helped to slow down your rate of myopia progression?” with a yes/no response.
Visual acuity–based and heterophoria measurementsVisual acuity–based measurements comprised visual acuities and contrast sensitivity. Acuity-based measurements at 6 m (monocular high and low-contrast visual acuity, binocular high-contrast visual acuity, and monocular contrast sensitivity) were measured with a letter chart utilizing custom software. Charts were displayed on a Brilliance 328P 4K monitor (Phillips, Sydney, Australia), with resolution = 3840 × 2160 pixels, viewing area = 698 × 393 mm, and measured luminance = 443 cd/m2.
Both high- and low-contrast visual acuities at 6 m were measured using an Early Treatment Diabetic Retinopathy Study–format chart utilizing five letters per line, an interline progression of 0.1 log units,27 and a range of −0.6 to 1.6 logMAR. High and low contrasts were set to 100% and 10%, respectively, as defined by Weber contrast. Binocular high-contrast visual acuity at 40 cm was measured with a Lighthouse Near Visual Acuity Test (Precision Vision, Woodstock, IL). Acuities were scored by letter, and the termination rule used was a total of three errors.27
Monocular contrast sensitivity at 6 m was measured using a chart with similar appearance to the Pelli-Robson chart in that three letters were displayed per line, with each line decreasing in contrast by 0.15 log units. The range was 0 to 1.8 log contrast sensitivity and scored in a similar way to visual acuity. The letters subtended an angle of 8 minutes in Sloan font (an equivalent of 0.2 logMAR). This configuration allowed contrast sensitivity to be measured at a higher spatial frequency (approximately 18 cycles/degree) compared with the Pelli-Robson chart (approximately 5 cycles/degree at 3 m28).
The modified Thorington technique29 was used to measure phoria at 3 m and 40 cm. Briefly, a Maddox rod was placed over the right eye so that a vertical red line was seen while viewing the BC/1209F (3 m) and BC/1209 N (40 cm) Muscle Imbalance Cards (Bernell Corporation, Mishawaka, IN) with penlight attachment. A cover/uncover technique was used to minimize adaptation. Exophoria was recorded as negative and esophoria as positive. Measurements were taken three times, and the median value was used as the final measurement.
Statistical analysisThe main comparisons in this study were control (control film pair) versus the four tests (test film pairs), and thus, the sample size calculation for the type I error was set to 0.0125 (0.05/4) to account for the multiple comparisons. At 80% power, a minimum sample of 40 participants was required to demonstrate a statistically significant difference ± standard deviation (SD) of 1.0 ± 1.8 units between the control and each test film pair in subjective ratings. This sample size also afforded >90% power for determining a difference in visual acuity of 0.10 ± 0.15 logMAR between the control and each test film pair. A 10% dropout rate was assumed, and thus, the study aimed to enroll 44 participants. All data analyses were performed using SPSS version 29 (IBM, Armonk, NY), and significance was set at 5%.
Data measured on an interval scale were summarized as means ± SD, whereas willingness to purchase was summarized as percentages. Raw data measured on an interval scale were assessed using QQ plots and frequency histograms. An appropriate data transformation was applied to raw data prior to statistical analysis if observed values deviated from expected normal values.
Differences between the control and each test were assessed using a linear mixed model with subject random intercepts for data measured on interval scale. This model accounts for within-participant correlation from two-eyed data (monocular visual acuity–based measurements), repeated measures, and missing data. Each model contained film design pairs (control, E, F-1, G, F-2) as a fixed factor. Distance was also included as a fixed factor for binocular visual acuity measurements (6 m and 40 cm), phoria measurements (3 m and 40 cm), and clarity of vision ratings (far-away, intermediate, near). For models containing distance as a fixed factor, the interaction between film design pair and distance was also tested, and if significant, the effects were assessed at each level of the interacting term. Willingness to purchase was assessed using the χ2 test. A Bonferroni-Holm correction was applied to post hoc multiple comparisons.30 p Values for post hoc multiple comparisons are reported as the unadjusted p value × (total comparisons − rank + 1).
Additional analyses were performed to determine differences between test designs only and differences in visual acuity–based measures between the control and spectacles with no film (no film control). Differences between tests were assessed by removing control data from the dataset and applying the same analyses as described above. Differences between the control and spectacles with no film were assessed using a linear mixed model.
RESULTS DemographicsA total of 46 participants were screened, 44 were enrolled into the study and randomized, and 3 discontinued during the study (Fig. 2). All three discontinuations were due to a time conflict. Participants were included in the final analysis if they wore at least one study spectacle and completed the corresponding questionnaire. Two participants discontinued before wearing any study spectacle, and one discontinued after wearing three pairs of study spectacles. The final dataset comprised 42 participants, of which 41 wore all five pairs of spectacles and 1 wore control, F-1, and F-2; 59.5% were women; 26.2% were White, 69.0% were Asian, and 4.8% were “other ethnicity”; and the mean age ± SD was 29.1 ± 6.4 years (range, 18 to 40 years). There were no significant adverse events recorded during this study.
Subjective data and wearing timeDifferences between the control and each test for subjective ratings (clarity of vision, vision when walking, vision at night, overall vision satisfaction) are shown in Fig. 3. Control was significantly better than each test for all four subjective ratings (p<0.001).
 FIGURE 3:
 Differences in subjective ratings for (A) clarity of vision, (B) vision when walking, (C) vision at night, and (D) overall vision satisfaction between the control and tests (E, F-1, G, and F-2). Comparisons are between the control and each test. Differences in clarity of vision were independent of distance (far-away, intermediate, near: p=0.92), and thus, results are presented for all distances combined. Control was significantly better than each test for all subjective ratings (p<0.001). Error bars = 95% confidence intervals (1.96 × standard error).
Differences between the control and each test for willingness to purchase and the average wearing times per day are shown in Fig. 4. A significantly higher proportion of participants were willing to purchase the control compared with each test (p<0.001), and the control was worn for a significantly longer average wearing time per day compared with each test (p<0.001).
 FIGURE 4:
 Differences in (A) willingness to purchase and (B) average wearing time per day between the control and tests (E, F-1, G, and F-2). Comparisons are between the control and each test. For willingness to purchase, the top darker shade bar indicates “yes,” and the bottom lighter shade bar indicates “no.” Significantly more participants were willing-to-purchase control compared with each test (p<0.001). The average wearing time per day was significantly longer while wearing the control compared with each test (p<0.001). Error bars = 95% confidence intervals (1.96 × standard error).
Visual acuity–based measures and heterophoriaVisual acuity–based measures and heterophoria results for the control and all tests are shown in Table 1. Control was significantly better than F-1 and F-2 for binocular high-contrast visual acuity at 40 cm (p<0.001 and p=0.02, respectively). There were no significant differences between the control and each test for any other visual acuity–based measure or phoria.
TABLE 1 - Visual acuity–based measurements and heterophoria for the control and tests (E, F-1, G, and F-2) Control Test: E Test: F-1 Test: G Test: F-2 Design Variable Units Mean ± SD (95% CI) Mean ± SD (95% CI) Mean ± SD (95% CI) Mean ± SD (95% CI) Mean ± SD (95% CI) p Monocular HCVA at 6 m logMAR −0.06 ± 0.08 (−0.09 to −0.04) −0.05 ± 0.08 (−0.08 to −0.03) −0.06 ± 0.08 (−0.09 to −0.04) −0.05 ± 0.07 (−0.07 to −0.02) −0.05 ± 0.09 (−0.08 to −0.02) 0.11 Monocular LCVA at 6 m ln(logMAR)* −1.48 ± 0.41 (−1.60 to −1.07) −1.52 ± 0.43 (−1.65 to −1.09) −1.47 ± 0.39 (−1.59 to −1.07) −1.46 ± 0.40 (−1.58 to 1.06) −1.44 ± 0.46 (−1.58 to −0.98) 0.44 Median (IQR) logMAR 0.22 (0.20 to 0.30) 0.22 (0.20 to 0.30) 0.22 (0.20 to 0.30) 0.22 (0.20 to 0.30) 0.23 (0.20 to 0.32) — Monocular CS at 6 m ln(log CS)† 0.21 ± 0.11 (0.17 to 0.24) 0.21 ± 0.13 (0.17 to 0.24 0.21 ± 0.12 (0.18 to 0.25) 0.23 ± 0.12 (0.20 to 0.27) 0.23 ± 0.14 (0.19 to 0.27) 0.07 Median (IQR) log CS 1.0 (0.90 to 1.05) 1.0 (0.90 to 1.05) 1.0 (0.90 to 1.05) 1.0 (0.85 to 1.05) 1.0 (0.85 to 1.05) — Binocular HCVA at 6 m logMAR −0.12 ± 0.06 (−0.14 to −0.10) −0.13 ± 0.08 (−0.15 to −0.10) −0.12 ± 0.07 (−0.14 to −0.10) −0.10 ± 0.06 (−0.12 to −0.08) −0.12 ± 0.07 (−0.14 to −0.10) 0.15 Binocular HCVA at 40 cm logMAR −0.05 ± 0.06 (−0.07 to −0.03) −0.03 ± 0.07 (−0.05 to −0.01) −0.02 ± 0.07‡ (−0.04 to 0.00) −0.03 ± 0.06 (−0.05 to −0.01) −0.02 ± 0.07§ (−0.04 to 0.00) 0.01 Heterophoria at 3 m ln(Δ)∥ 1.6 ± 0.4 (1.5 to 1.8) 1.6 ± 0.5 (1.5 to 1.8) 1.6 ± 0.4 (1.5 to 1.7) 1.6 ± 0.4 (1.5 to 1.8) 1.6 ± 0.4 (1.5 to 1.7) 0.89 Median (IQR) Δ −1.0 (−2.0 to 0.0) −1.0 (−2.0 to 0.0) −1.0 (−2.0 to 0.0) −1.0 (−2.0 to 0.0) −1.0 (−2.0 to 0.0) — Heterophoria at 40 cm Δ −2.8 ± 3.9 (−3.9 to −1.6) −2.8 ± 3.9 (−3.9 to −1.6) −2.8 ± 3.9 (−3.9 to −1.6) −2.8 ± 3.9 (−3.9 to −1.6) −2.8 ± 3.9 (−3.9 to −1.6) 0.84Differences between tests for clarity of vision were independent of distance (p=0.86). Clarity of vision was significantly worse with test design F-2 compared with both designs F-1 (p=0.02) and G (p<0.001). There were no significant differences between tests for any other subjective rating (p value range, 0.18 to 0.29), willingness to purchase (p=0.11), or wearing time (p=0.06). There were also no significant differences between tests for any visual acuity–based measure (p value range, 0.08 to 0.31) or phoria at 3 m (p=0.96) or 40 cm (p=0.72).
There were no significant differences between the control and spectacles with no film for any visual acuity–based measure (p value range, 0.08 to 0.58) or phoria at 3 m (p=0.19) or 40 cm (p=0.15).
DISCUSSIONThe current study reports the visual performance of films containing optical elements, a new spectacle lens technology that utilizes at least two film pairs applied to the front surface of standard single-vision spectacle lenses to create a dynamic or spatially and temporally varying optical cue to the eye that may have efficacy in slowing the rate of myopia progression. This type of technology has been previously applied to soft contact lenses.21
The first aim of this study was to assess the visual performance of the four test film pairs against a control consisting of a film pair with no optical elements. The control film pair was slightly better than F-1 and F-2 for binocular high-contrast visual acuity at 40 cm (less than two letters), whereas there was no difference between control and tests for any other visual acuity–based or phoria measurement. This slight difference between the control and tests for acuity at 40 cm but no difference at 6 m suggests that participants were looking through optical elements when converging to read the acuity chart at 40 cm. Similar findings have been reported with commercially available defocus incorporated multiple segments (Miyosmart; Hoya Lens, Tokyo, Japan) spectacle lenses.31,32 Kaymak et al.31 reported no difference in primary gaze visual acuity and contrast sensitivity measurements between single-vision spectacle lenses and Miyosmart in photopic and mesopic conditions and under conditions of glare and no glare. Lam et al.32 reported no difference in either high- and low-contrast visual acuities, or distance and near phorias between single-vision and Miyosmart.
Other studies have compared visual acuity–based measures while viewing through the peripheral treatment zone of myopia management spectacles.33,34 Gao et al. reported reduced high- and low-contrast visual acuities while wearing highly aspherical lenslets (Stellest; Essilor, Charenton-le-Pont, France) compared with a single-vision control, but no difference between slightly aspherical lenslets (Essilor) and the control.33 Li et al. reported reduced visual acuity and contrast sensitivity while wearing Miyosmart, Stellest, and slightly aspherical lenslets compared with a single-vision control, with the greatest reduction occurring with Miyosmart.34 The Gao and Li studies also suggest that spectacle lenses showing the greatest efficacy for myopia management (Miyosmart13 and Stellest14) have the worst visual acuity–based visual performance when viewing through the peripheral treatment zone.33,34 The current study did not assess visual performance through the peripheral treatment zone of test films, but it is expected that a similar reduction in visual acuity–based measurements would occur given the location of the optical elements.
Although there were few differences between the control film pair and test film pairs for visual acuity–based measures, the control was significantly better for all subjective measures (subjective ratings, willingness to purchase) and wearing time. These findings of comparable visual acuity–based measures but reduced subjective measures have been reported while wearing multiple-focus contact lenses that also compromise visual performance due to induced defocus,35–37 suggesting that, like their contact lens counterparts,35–37 subjective measures of visual performance may be a more sensitive metric for assessing myopia management spectacle lenses. Therefore, the optical elements in the test films resulted in reduced visual performance, but studies reporting on the visual performance of myopia management spectacle lenses have also reported similar results.
Psarakis and colleagues reported that only 8% of myopic young adults were willing to continue wearing Miyosmart lenses after 1 hour due to poor vision satisfaction (Psarakis D, et al. IOVS 2022;63:ARVO E-Abstract 1443). Despite this low initial acceptance, this percentage increased to 38% after 2 days, presumably due to adaptation. In the current study, an average of 47% (range, 37 to 58%, Fig. 4A) of myopic young adults were willing to purchase the spectacles with test film pairs after 3 days of wear, which is comparable to the results reported by Psarakis and colleagues. Lu et al.26 reported the adaptability and acceptance of Miyosmart lenses after 30 minutes and after 1 week of lens wear in myopic Chinese children and adults. The acceptance rate of Miyosmart was greater in children compared with adults, suggesting that the acceptance rate of test film pairs may also be greater in children, who are the intended population for this intervention, than those reported by the young adults in the current study.
The findings from the current study suggest that subjective measures may be a more sensitive metric of visual performance while wearing myopia management spectacle lenses. However, there are no studies reporting the subjective visual performance of commercially available myopia management spectacle lenses such as Miyosmart or Stellest. The current study utilized a single-vision control rather a myopia management control, and thus, further studies are required to permit a direct comparison of the visual performance between commercially available myopia management lenses and test films.
The second aim of this study was to assess visual performance between test film pairs to determine the comparability and interchangeability between designs. It is vital that the test film pairs have comparable visual performance and be interchangeable to minimize one pair of spectacles being preferentially worn, which would negate any benefit derived from a dynamic optical cue. Therefore, the mirror-symmetric F-2 design is an unsuitable option in this respect because it was significantly worse than both the F-1 and G for clarity of vision ratings. By contrast, the asymmetric distribution of elements between the nasal and temporal regions of each eye of designs E, F-1, and G appears to be both comparable and interchangeable and may offer a balance between visual performance and possible myopia management efficacy.
Even though there is a paucity of subjective visual performance data available with current commercially available myopia management spectacle lenses, insights into the tolerance and visual acceptance of the test film pairs may be derived from myopia management contact lens studies, which also report reduced subjective visual performance due to induced defocus.24,25,35,38 When worn by myopic young adults, the subjective visual performance of MiSight (CooperVision, San Ramon, CA) contact lenses was reduced compared with a single-vision control35 and habitual correction,24 but the proportion who were willing to purchase MiSight significantly increased if the rate of myopia progression was reduced compared with those who were willing to purchase MiSight based on visual performance alone.35,38 Chamberlain et al.9 reported high subject retention and long wearing times in children wearing MiSight over 3 years, indicating acceptable visual acceptance with MiSight despite induced defocus. These findings by Diec et al.,35 Sha et al.,38 and Chamberlain et al.9 suggest that reduction in visual performance may be acceptable for the benefit of reduced myopia progression in young adults and children, and MiSight may be a useful surrogate for determining visual acceptance. The demographic factors of the cohort in the Diec study were comparable to the current study, and both studies obtained data using the same variables of overall vision satisfaction and willingness to purchase if myopia progression was reduced.35 Diec et al. reported an overall vision satisfaction of 5.9 units after 5 days of wearing MiSight, which is comparable to the 6.0 to 6.6 units (Fig. 3D) obtained in the current study after 3 days of wearing each test film pair. Diec et al. reported that 55% of participants (18 of 33) were willing to purchase MiSight if the rate of myopia progression was reduced,35 which is also comparable to the current study. There is no statistically significant difference between willingness-to-purchase MiSight (55%) and the test film pair, which achieved the lowest proportion (F-2: 37%, p=0.12), but the proportion for MiSight is significantly lower than the control film pair (95%, p<0.001) from the current study. Overall, these comparisons suggest that the four test film pairs achieve a comparable visual performance to MiSight and, by extension, a comparable visual acceptance and tolerance when used as a device for myopia management.
The third aim of this study was to compare visual acuity–based measures of a film pair without optical elements applied to single-vision spectacle lenses (control film pair) against single-vision spectacle lenses without a film to determine whether the optical film material and adhesive degraded vision compared with standard hard-coated CR-39 spectacle lenses. Spectacle films do not appear to have degraded vision based on the nonsignificant differences in visual acuity–based and phoria measurements between the control and spectacles without a film, the very high subjective ratings given by participants while wearing the control, and the very high proportion of participants willing to purchase the control.
Although spectacle lenses may be the preferred choice for managing myopia, particularly in younger children as they are easy and safe to wear, the high costs of current myopia management spectacles limit their access to everyone in need. The cost factor is also exacerbated due to the need for relatively frequent changes in lens prescription that are required in myopic children, even when myopia management is implemented. The current test films can be adhered to the wearer's own spectacle lenses and therefore may provide a more affordable spectacle lens–based solution for myopia management. This is, of course, dependent on test films providing a reduction in myopia progression. A multisite randomized clinical trial is currently planned to test the hypothesis that these films have efficacy in reducing myopia progression, and the dynamic optical cue sustains efficacy over a longer period (NCT06137560). Given the results of the current study, this planned trial will not employ the F-2 design or any configuration producing a similar mirror-symmetric design orientation of optical elements in the nasal region of the right and left eye films.
CONCLUSIONSVisual performance with the four test film pairs was reduced compared with the control film pair. Visual performance was comparable between the four test film pairs, and three of the four test film pairs were interchangeable. Visual acuity–based measures with the control film pair were not different from either the test film pairs or single-vision spectacle lenses without a film.
REFERENCES 1. Holden BA, Fricke TR, Wilson DA, et al. Global prevalence of myopia and high myopia and temporal trends from 2000 through 2050. Ophthalmology 2016;123:1036–42. 2. Fang Y, Yokoi T, Nagaoka N, et al. Progression of myopic maculopathy during 18-year follow-up. Ophthalmology 2018;125:863–77. 3. Marcus MW, de Vries MM, Junoy Montolio FG, et al. Myopia as a risk factor for open-angle glaucoma: A systematic review and meta-analysis. Ophthalmology 2011;118:1989–1994.e2. 4. Younan C, Mitchell P, Cumming RG, et al. Myopia and incident cataract and cataract surgery: The Blue Mountains Eye Study. Invest Ophthalmol Vis Sci 2002;43:3625–32. 5. Chia A, Chua WH, Cheung YB, et al. Atropine for the treatment of childhood myopia: Safety and efficacy of 0.5%, 0.1%, and 0.01% doses (Atropine for the Treatment of Myopia 2). Ophthalmology 2012;119:347–54. 6. Yam JC, Jiang Y, Tang SM, et al. Low-Concentration Atropine for Myopia Progression (LAMP) study: A randomized, double-blinded, placebo-controlled trial of 0.05%, 0.025%, and 0.01% atropine eye drops in myopia control. Ophthalmology 2019;126:113–24. 7. Cho P, Cheung SW. Retardation of Myopia in Orthokeratology (ROMIO) study: A 2-year randomized clinical trial. Invest Ophthalmol Vis Sci 2012;53:7077–85. 8. Walline JJ, Jones LA, Sinnott LT. Corneal reshaping and myopia progression. Br J Ophthalmol 2009;93:1181–5. 9. Chamberlain P, Peixoto-de-Matos SC, Logan NS, et al. A 3-year randomized clinical trial of MiSight lenses for myopia control. Optom Vis Sci 2019;96:556–67. 10. Sankaridurg P, Bakaraju RC, Naduvilath T, et al. Myopia control with novel central and peripheral plus contact lenses and extended depth of focus contact lenses: 2-year results from a randomised clinical trial. Ophthalmic Physiol Opt 2019;39:294–307. 11. Walline JJ, Greiner KL, McVey ME, et al. Multifocal contact lens myopia control. Optom Vis Sci 2013;90:1207–14. 12. Cheng D, Schmid KL, Woo GC, et al. Randomized trial of effect of bifocal and prismatic bifocal spectacles on myopic progression: Two-year results. Arch Ophthalmol 2010;128:12–9. 13. Lam CS, Tang WC, Tse DY, et al. Defocus incorporated multiple segments (DIMS) spectacle lenses slow myopia progression: A 2-year randomised clinical trial. Br J Ophthalmol 2020;104:363–8. 14. Bao J, Huang Y, Li X, et al. Spectacle lenses with aspherical lenslets for myopia control vs single-vision spectacle lenses: A randomized clinical trial. JAMA Ophthalmol 2022;140:472–8. 15. Rappon J, Chung C, Young G, et al. Control of myopia using diffusion optics spectacle lenses: 12-Month results of a randomised controlled, efficacy and safety study (CYPRESS). Br J Ophthalmol 2023;107:1709–15. 16. Liu XT, Wang PQ, Xie Z, et al. One-year myopia control efficacy of cylindrical annular refractive element spectacle lenses. Acta Ophthalmol 2023;101:651–7. 17. Tran HD, Tran YH, Tran TD, et al. A review of myopia control with atropine. J Ocul Pharmacol Ther 2018;34:374–9. 18. Watt KG, Swarbrick HA. Trends in microbial keratitis associated with orthokeratology. Eye Contact Lens 2007;33:373–7. 19. Chalmers RL, McNally JJ, Chamberlain P, et al. Adverse event rates in the retrospective cohort study of safety of paediatric soft contact lens wear: The ReCSS study. Ophthalmic Physiol Opt 2021;41:84–92. 20. Lam CS, Tang WC, Lee PH, et al. Myopia control effect of defocus incorporated multiple segments (DIMS) spectacle lens in Chinese children: Results of a 3-year follow-up study. Br J Ophthalmol 2022;106:1110–4. 21. Tilia D, Diec J, Ehrmann K, et al. Visual performance and binocular/accommodative function of S.T.O.P. contact lenses compared with MiSight. Eye Contact Lens 2023;49:63–70. 22. Brennan NA, Toubouti YM, Cheng X, et al. Efficacy in myopia control. Prog Retin Eye Res 2021;83:100923. 23. Smith EL 3rd, Hung LF, Huang J, et al. Effects of local myopic defocus on refractive development in monkeys. Optom Vis Sci 2013;90:1176–86. 24. Kollbaum PS, Jansen ME, Tan J, et al. Vision performance with a contact lens designed to slow myopia progression. Optom Vis Sci 2013;90:205–14. 25. Tilia D, Sha J, Thomas V, et al. Vision performance and accommodative/binocular function in children wearing prototype extended depth-of-focus contact lenses. Eye Contact Lens 2019;45:260–70. 26. Lu Y, Lin Z, Wen L, et al. The adaptation and acceptance of defocus incorporated multiple segment lens for Chinese children. Am J Ophthalmol 2020;211:207–16
留言 (0)