
記住我


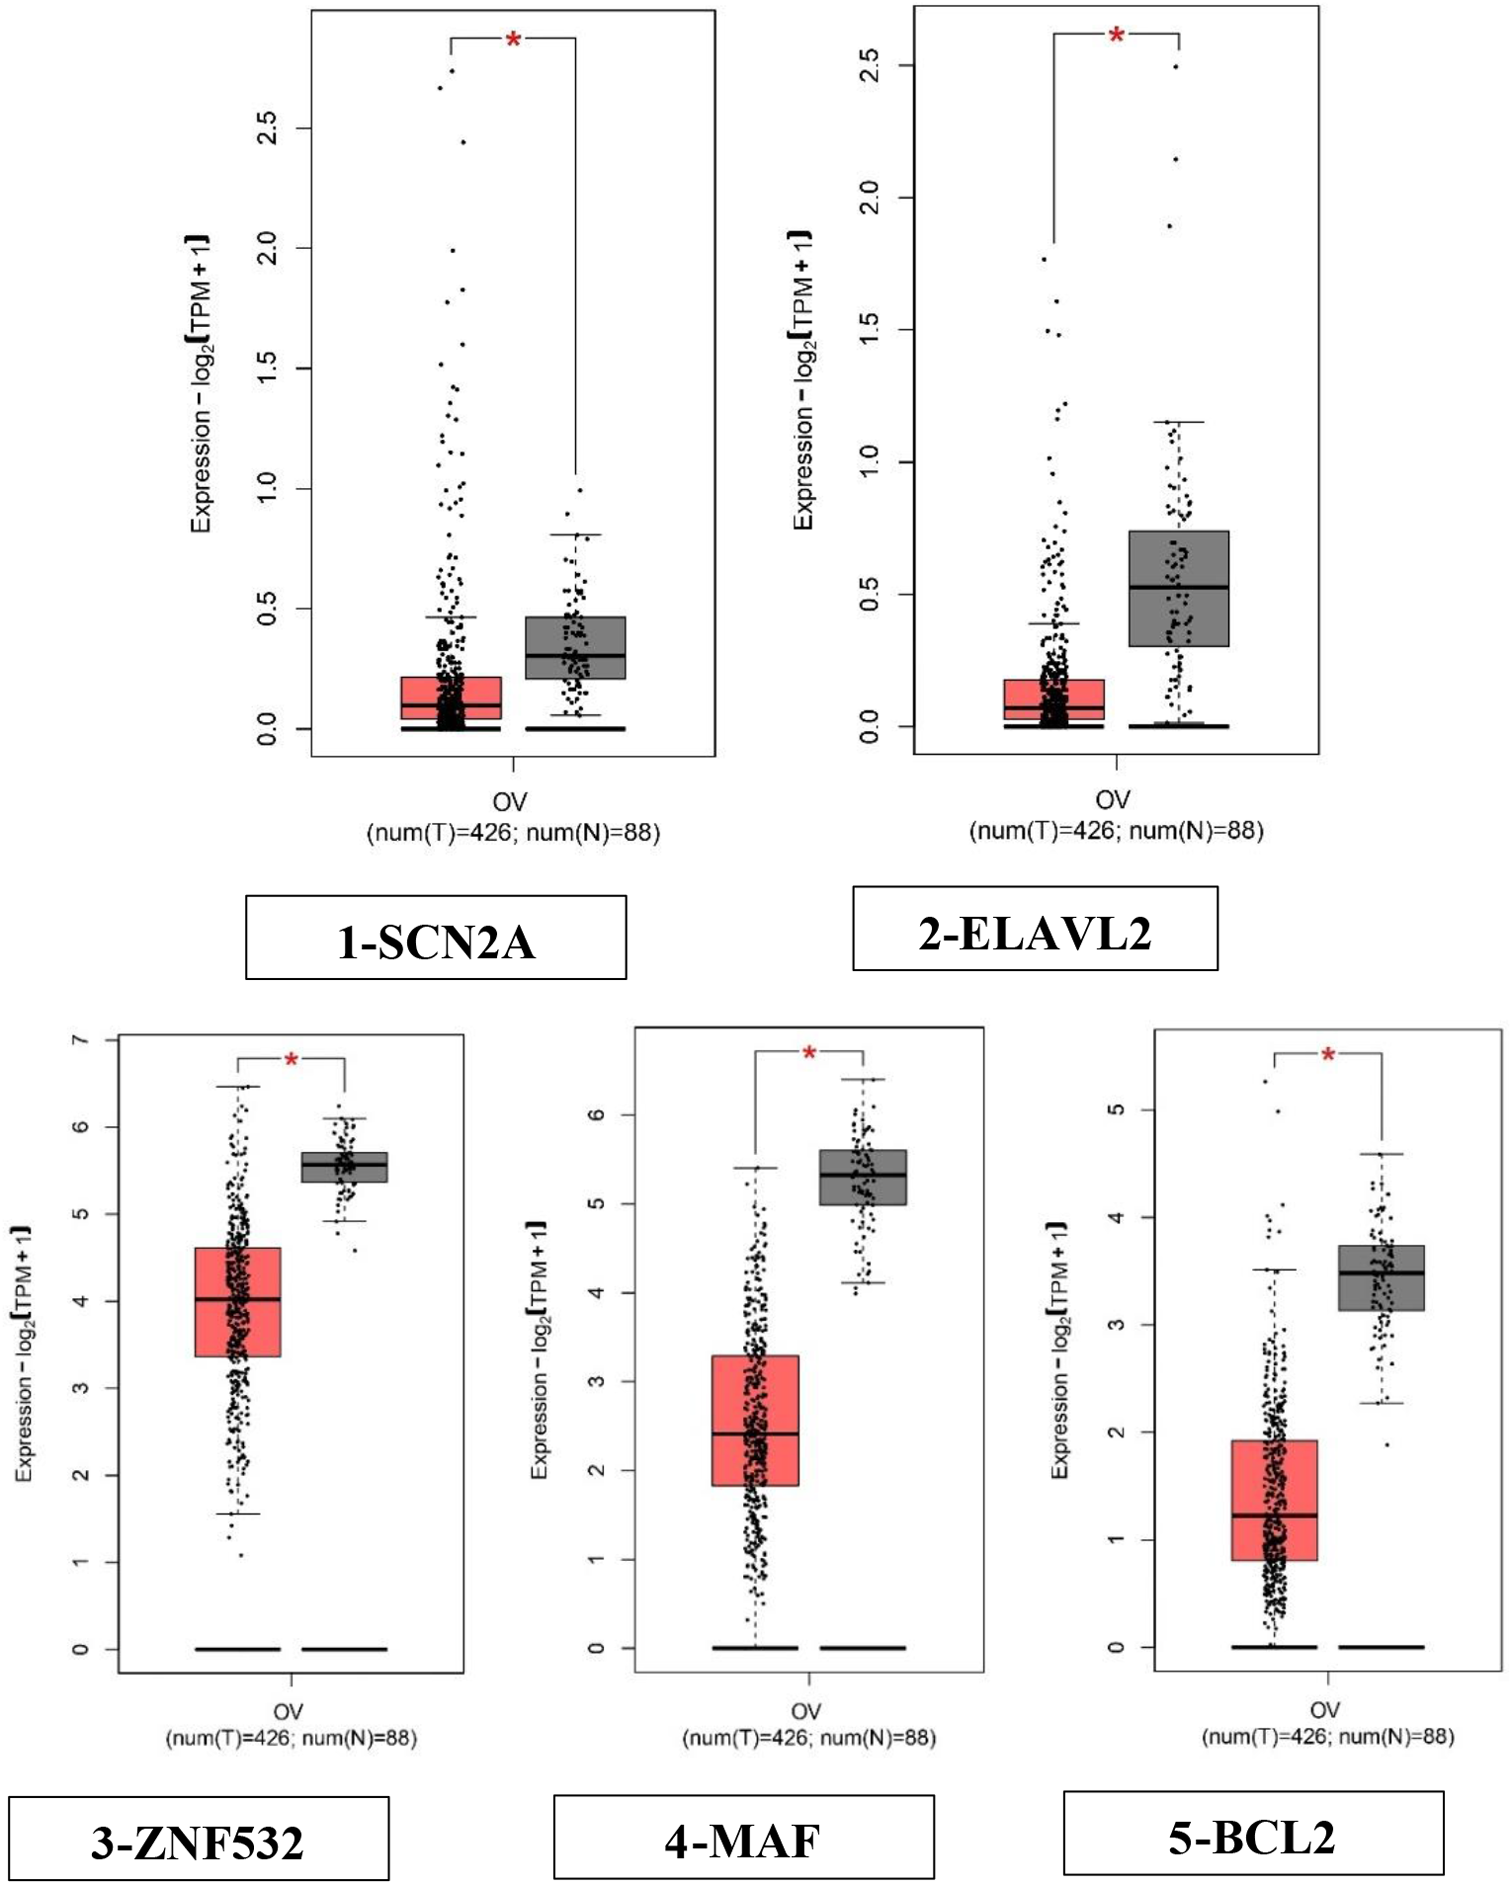
GEPIA, also known as Gene Expression Profiling Interactive Analysis, is a web-based platform that facilitates the analysis of gene expression data. The GEPIA2 platform was selected for the analysis of hub genes in ovarian cancer. This analysis focused on validating the total expression levels of these genes in normal tissues and examining their expression patterns at different stages of ovarian cancer [31]. The box plot depicted in Fig. 1 illustrates the aberrant expression of the 5 hub genes in ovarian cancer in comparison to normal ovarian tissue. The previous study observed a downregulation of the genes SCN2A, ELAVL2, ZNF532, MAF and BCL2 which were identified in ovarian cancer [11]. These 5 hub genes were validated by GEPIA2 for their expression and further analysed via KmPlotter for survival analysis.
Fig. 1
Comparisons of the expression of the five genes between ovarian cancer and normal ovarian tissues in TCGA and GTEx based on GEPIA. The Y axis represents the log2 (TPM + 1) for gene expression. The gray bar represents the normal tissues, whereas the red bar represents the tissues affected by ovarian cancer. The median is shown by a broad horizontal line positioned in the centre, while the lower and upper boundaries of each box correspond to the first and third quartiles, respectively. The lower and upper error bars correspond to the minimum and maximum values of the expression data, respectively. The red and grey boxes in the diagram correspond to ovarian cancers and normal tissues, respectively. The differential analysis was conducted using the one-way analysis of variance (ANOVA) method, where disease stage was considered as the variable for determining differential expression. Statistical significance was indicated by an asterisk, and each dot represented a unique tumor or normal sample. The values were obtained from the GEPIA database. Transcripts per kilobase million (TPM) is a metric used to quantify gene expression levels in transcriptomic studies. The box plots (1–5) depicting the expression levels of the five hub genes indicate significant dysregulation in ovarian cancer as compared to normal ovarian tissue. (1) SCN2A—down-regulated, (2) ELAVL2—down-regulated, (3) ZNF532—down-regulated, (4) MAF—downregulated (5), BCL2—down-regulated. All the genes were significant with p < 0.05
Survival analysis dataThe prognostic information of our five hub genes were determined using the KM plotter (SCN2A, ELAVL2, BCL2, MAF, and ZNF532,) to confirm the association between patterns of expression and metastasis risk in ovarian cancer patients. In this analysis we have selected genes that are significant. The KM plots shown in Fig. 2(A–I) depicted the low expression levels of all the 5 driver genes. SCN2A (HR = 1.21; 95% CI = 0.98–1.49; p > 0.05, ELAVL2 (HR = 1.6; 95% CI = 1.3–1.96; p < 0.05), ZNF532 (HR = 1.39; 95% CI = 1.13–1.71; p < 0.05), MAF (HR = 1.27; 95% CI = 1.1–1.48; p < 0.05), BCL2 (HR = 1.33; 95% CI = 1.2–1.5; p < 0.05). The p values show the significance of genes that is being taken into account. Table 1 displays the p value of each hub gene with significant genes taken into discussion in this research article.
In the context of a Kaplan-Meier (KM) plot or survival analysis, the Hazard Ratio (HR) the result in case of ELAVL2 is interpreted as for e.g.- “1.6 (1.3–1.96),” indicates the relative risk of an event occurring in one group compared to another group.
Point Estimate (HR = 1.6): The point estimate of the Hazard Ratio is 1.6. This means that the group associated with this HR value has a 1.6 times higher risk of experiencing the event of interest (e.g., death, disease recurrence) compared to the reference group. In other words, the event is 60% more likely to occur in the first group than in the reference group.
Confidence Interval (1.3–1.96): The confidence interval provides a range of values within which we can reasonably expect the true Hazard Ratio to fall with a certain level of confidence. In this case, the 95% confidence interval for the Hazard Ratio is between 1.3 and 1.96. This means that we are 95% confident that the true Hazard Ratio lies within this range. If the confidence interval does not include the value 1 (which indicates no difference in risk), it suggests that the observed difference is statistically significant.
If we interpret the result we may conclude that the point estimate (HR = 1.6) indicates that the group being compared has a 1.6 times higher risk of the event compared to the reference group.The lower limit of the confidence interval (1.3) suggests that the risk is at least 1.3 times higher, while the upper limit (1.96) suggests that the risk could be as much as 1.96 times higher.
In simpler terms, the data suggests that the group with the higher risk (as indicated by the Hazard Ratio) is statistically significantly more likely to experience the event of interest compared to the reference group. The magnitude of the risk increase falls within the range of 30% (1.3) to 96% (1.96) higher risk, based on the confidence interval.
Among the five hub genes examined, four genes were shown to be statistically significant. Subsequently, the four genes underwent further examination to identify any alterations. The cBio Cancer Genomics Portal was used to further investigate the highest mutation summary. The gene with the greatest number of mutations will be selected for subsequent study.
Fig. 2
Analysis of the prognostic value of all the different five genes using KM-Plotter Plots shown in Figure displays the prognostic relevance of all the 5 hub genes
Table 1 All the significant genes are taken into consideration for cBio portal analysis cBioPortal analysis of hub DEGs-Genetic alteration data analysisThe selected significant genes having p-value less than 0.005 is taken into consideration and (ELAVL2, MAF, ZNF532 and BCL2) were entered to cBioPortal for verifying their variation in genetics throughout 4 different groups incorporating overall 863 samples in 806 patients in 4 studies. All the selected cohorts are from the samples of epithelial ovarian cancer. Figure 3 shows an OncoPrint demonstrating the genetic modification frequency of key DEGS. Further to study the alteration frequency in different cancer types and sub types, bar plots are constructed that shows the alteration frequency in different cohorts showcasing different cancer type; the subtype and the cancer study Fig. 4. The green, red and blue colour demonstrates the mutation amplification and deep deletion respectively in different cohorts. The symbols + and – shows the number of profiles that has been profiled or not profiled respectively in different cohorts.
Summary based on all the cancer study from different cohorts shows that gene is altered in 12.67% of 584 cases with mutational frequency of 0.34% (2 cases), amplification frequency of 5.14% (30 cases) and deep deletion frequency of 7.19% (42cases) in all the queried genes of cohort, Ovarian serous cystadenocarcinoma of TCGA firehouse legacy. (Fig. 4A).
Summary based on analysis of different Cancer type depicts the overall alteration frequency of all the four significant genes as depicted in Fig. 4B indicates gene is altered in 8.94% of 828 cases with a mutational frequency of 0.24% (2cases), amplification frequency of 3.62% (30 cases), and deep deletion frequency of 5.07% (42 cases) in case of ovarian cancer. Figure 4B. The symbols + and – shows the number of profiles that has been profiled or not profiled respectively in different cohorts.
Considering the details of cancer sub types, we found that gene is altered in 12.67% of 584 cases with mutational frequency of 0.34% (2 cases), amplification frequency of 5.14% (30 cases) and deep deletion of 7.19% (42 cases) in case of serous ovarian cancer. (Fig. 4C). The symbols + and – shows the number of profiles that has been profiled or not profiled respectively in different cohorts.
To study the somatic mutations lollipop plots were constructed that indicate the frequency and position of potential mutations in ELAVL2. 0.2% is the percentage of samples with somatic mutations in ELAVL2. No somatic mutations have been found in MAF, ZNF532 and BCL2. (Fig. 5).
Fig. 3
OncoPrint highlights genomic alterations among samples. The rows are the hub DEGs, while the vertical columns are tumor samples. Red, blue, green, yellow, and gray colored bars represent amplification, deep deletion, missense, splice, and truncating mutations
Fig. 4Barplots depicting (A) Alteration frequency of all four key genes in different cohorts. (B) Alteration frequency of all four key genes in different cancer types (C) Alteration frequency all four key genes in detailed sub cancer types
Fig. 5
Lollipop plots of somatic mutations in the protein domains of ELAVL2. Below the gray horizontal bar is the amino acid range for the protein domain. Solid green boxes indicate protein domains. Lollipop-like dots on solid vertical lines indicated mutation locations and frequencies
Molecular docking analysisAutodock Vina program was used for molecular docking of ELAV-like protein 2. The protein was first retrieved from Uniprot with the accession code Q12926. The ZINC database’s natural compound library was also accessed, and thousands of compounds were evaluated for their capacity to bind to the protein. The compounds with the highest binding energies, namely ZINC03830554, ZINC03830332, ZINC03830328, ZINC03830649, and ZINC03831622, were chosen from Table 2. Subsequently, an in-depth investigation was conducted utilizing PyMOL and discovery studio visualizer to determine the compound exhibiting the most significant residual interaction (Supplementary Material-S1). Based on these results, one compound ZINC03830554 which shown (Fig. 6) highest interactions towards ELAV-like protein 2 was chosen for further investigation.
ELAVL2 structure contains a long chain of 359 amino acids, having 3 major domains apart from disordered domain. Region (aa 1–33) disordered, domain 39–117 RRM1, domain125-205 RRM2 and domain 276–359 RRM3. The domain containing residues LYS352, CYS277, TYR327, and PHE351is very important because of the presence of potentiality of ligand-interacting motif. It has been observed that the interaction between these interacting binding site residues (LYS352, CYS277, TYR327, and PHE351) has been shown to stop or significantly reduce in the catalytic activity of ELAVL2. The other interacting residues, ASN126, ASN205, LYS352, CYS277, TYR327, and PHE351, SER118, ARG123, THR153, ARG172, SER207, ASN44 and ARG172 belong to the three major domains of ELAVL2 and are also the part of interacting motif and participates in its activity. The ZINC03830554 bound with crucial residues such as LYS352, CYS277, TYR327, and PHE351, these residues formed conventional hydrogen bonds and THR 274 formed Pi-donor hydrogen bond which are very important. Other interactions such as salt bridge, pi-sulfur, pi-pi stacked, pi-pi T-shaped, pi-alkyl and Van der Waals forces was also observed. Distance between bonds was also measured. We found the residual interaction of all the five residues and the findings are reported in Supplementary Material S1. All the residual interaction files can also be found in Supplementary Figures. The compound ‘ZINC03830554’ showed greater binding affinity along with a greater number of interactions towards target protein as compared to other zinc compounds so its is further selected for molecular dynamics simulations.
Also, using Eq. 1, the protein’s inhibitory constant (Ki) value was computed (Table 2). It serves as a measure of the inhibitor’s efficacy; an inhibitor with a low Ki value is one that is effective [32].
Table 2 The docking score of different compounds with ELAVL2$$KI = }\left( }} \right)}\left( }} \right)} \right)$$
(1)
Where ΔG = docking energy; R = 1.98719 cal K− 1 mol− 1;T 298.15°k, Ki = inhibition constant (nM).
Apart from various other reasons there are three main reasons for choosing ZINC03830554 as a potential inhibitor for further studies:
The compound ‘ZINC03830554’ has been shown to reduce cell proliferation and tumor growth. ZINC03830554’ is reported as potential inhibitors of mutant PARP12 receptors [33].
Apart from this, ZINC03830554’ is among one of the potential inhibitors ranked by Z-mean value that is used as structure-based virtual screening method against Cz protein from T. cruzi [34].
In addition, a recent study found that ZINC03830554 (also known as Congo red) reduced the proliferation of cell of MLH1 deficient HCT116 in cells from humans with colon cancer and suppressed tumor growth [35].
Lastly, it is noteworthy that ZINC03830554 has exhibited the highest level of interaction with ELAVL2 and showed greater binding affinity along with interactions towards target protein as compared to other zinc compounds. Therefore, on further clinical studies and experimental validation we can assume that ZINC03830554 can also be used to suppress the cell proliferation and tumor growth in ovarian cancer as well. Here, out of 5 compounds, structural representation ZINC03830554 in complexed with ELAVL2 is shown which was selected to perform MD simulation studies (Fig. 6).
Fig. 6
ELAVL2 structure complexed with ZINC03830554. (A) A cartoon depiction of the ELAVL2 complex. (B) A zoomed surface illustration of ELAVL2 and ZINC03830554 is shown as sticks. (C) A close-up of the substrate binding pocket, which shows the critical amino acid residues of ELAVL2 interacting with the inhibitor compound ZINC03830554. (D) Surface depiction of ELAVL2’s preserved substrate-binding pocket
Physicochemical and ADME/T studiesThe top five hits on the shortlist, notably, ZINC03830554, ZINC03830332, ZINC03830328, ZINC03830649, and ZINC03831622 compounds were utilized to determine pharmacologic characteristics such as Molecular Weight, DonorHB, Lipnski violations and AcceptorHB. Four compounds broke one rule by increasing their MW, but this is still permitted. According to the RO3 investigation, the compound’s molecular weight ranged from 422 to 693, with 4–10 H-bond accepting and 0–14 H-bond donor. We discovered that all five compounds followed the rule of three (Ro3) [36]. There are various exceptions to the rule that an orally delivered drug/compound shouldn’t be in violation of more than one rules [37]. SwissAdme is the most extensively utilized tools in rational drug discovery are in-silico absorption, distribution, metabolism, excretion (ADME), and toxicity (T), which provide a good understanding of the drug candidateship. We investigated the ADMET (Ro3) of the top five hits in this context, and the findings are reported in Supplementary Table S2. Overall, the five hits demonstrated adequate drug-related characteristics and skills [38, 39].
Molecular dynamic simulationsROOT-mean-square deviationRMSD is frequently used metric to examine the structural resemblance between two conformations of a molecule, such as a protein or a protein-ligand complex, obtained from molecular dynamics (MD) simulations. In this study, we calculated the RMSD values for both the protein and the protein-ligand complex and compared their values. Our analysis revealed that the average RMSD value for the ELAV-like protein 2 was 0.55 nm, indicating a relatively stable structure during the simulation. Alternatively, the average RMSD value for the ELAV-like protein 2-ZINC03830554 complex was 0.56 nm, which was somewhat higher than that of the ELAV-like protein 2 alone, suggesting that the binding of the ligand may have induced some conformational changes in the protein. However, the deviation of the average RMSD value for the ELAV-like protein 2-ZINC03830554 complex was bit higher than that of the protein alone, indicating that the binding of the ligand may have also retain the protein structure stability. Overall, our results suggest that the ELAV-like protein 2-ZINC03830554 complex was relatively stable during the simulation (Fig. 7).
ROOT-mean-square fluctuationRMSF is a measure of the average deviation of each atom in a protein or protein-ligand complex from its average position over the course of a molecular dynamics (MD) simulation. In this case, the average RMSF of the ELAV-like protein 2 was 0.23 nm, indicating that the protein was stable during the simulation. However, the average RMSD of the ELAV-like protein 2-ZINC03830554 complex was 0.26 nm, which is higher than the average RMSF of the protein alone. This implies that the ligand’s adherence to the protein may be causing small fluctuations in the protein structure, potentially indicating some degree of instability in the complex. Overall, the results suggest that while the protein is relatively stable, the addition of the ligand introducing some level of flexibility in the complex although overall protein gets their stability (Fig. 7). Further analysis, such as examination of specific regions of the protein and ELAV-like protein 2-ZINC03830554 interactions, may be required to better comprehend the significance of these fluctuations and their potential impact on the structure and function of the complex.
Radius of gyrationIn the present study, Rg was used as a measure of the compactness of the ELAV-like protein-2 and its complex with the ligand ZINC03830554. The Rg values were calculated from the MD simulation trajectories and the average Rg values were determined for both the protein and the protein-ligand complex. The average Rg of the ELAV-like protein-2 was found to be 2.32 nm, indicating that the protein is compact in its native state. Similarly, the average Rg of the ELAV-like protein-2-ZINC03830554 complex was also found to be 2.32 nm, suggesting that the binding of the ligand did not considerably alter the compactness of the protein. These results indicate that the binding of ZINC03830554 did not induce any major conformational changes in the ELAV-like protein-2, and that the protein remained relatively compact throughout the simulation (Fig. 7). The Rg values obtained in this study provide valuable perspective into the structural dynamics of the ELAV-like protein-2 and its interaction with ZINC03830554 and could be useful in the design of new drug candidate for this target.
Solvent-accessible surface areaThe findings of the SASA analysis suggest a marginal elevation in the mean SASA following the interaction between the ELAV-like protein-2 and the ligand ZINC03830554. The mean solvent-accessible surface area (SASA) of the ELAV-like protein-2 was found to be 180.23, whereas the mean SASA of the ELAV-like protein-2-ZINC03830554 complex was determined to be 185.13. The observed rise in solvent-accessible surface area (SASA) implies that the interaction between the ligand and the protein induces a conformational alteration in the protein’s structure, resulting in the unveiling of supplementary surface area (Fig. 7). The SASA distribution, similar to the Rg values, demonstrates a comparable equilibration pattern in both systems without significantly impacting the overall folding and compactness.
Fig. 7
Structural dynamics of ELAVL2 upon ZINC03830554. (A) RMSD plot of ELAVL2 in complexed with ZINC03830554. (B) RMSF plot of ELAVL2 and its complex with ZINC03830554. Structural compactness and folding of ELAVL2 upon ZINC03830554. (C) Rg plot and (D) SASA plot of ELAVL2 with ZINC03830554
Hydrogen bond dynamicsHydrophobic interactions and intramolecular hydrogen bonds (H-bonds) determine the structural form of a protein. H-bonds inside a protein are crucial to the structure’s overall folding and conformation. Protein structure conformational changes and compactness have long been studied using intramolecular H-bonds. The ELAVL2 protein generated an average of 243 intramolecular hydrogen bonds, while ZINC03830554 interaction generated an average of 251 intramolecular hydrogen bonds (Fig. 8). These results suggest that the binding of the ZINC03830554 ligand to the ELAVL2 protein has a slight effect on the formation of intramolecular hydrogen bonds. The increase in the average number of intramolecular hydrogen bonds in the protein-ligand complex may indicate that the binding of the ligand promotes a more stable conformation of the protein. Overall, the MD simulation results suggest that the ELAVL2 protein can form intramolecular hydrogen bonds and that the binding of the ZINC03830554 ligand may affect the formation of these hydrogen bonds. Additional investigations are needed to investigate the functional implications of these results in the context of protein-ligand interactions. Furthermore, the time-dependent assessment of intermolecular H-bonds was investigated to determine the consistency of H-bonding between complexes. (Figure 8 depicts two average numbers of H-bonds, indicating a reasonable consistency for intermolecular H-bonds in the ligand bound position.
Fig. 8
Hydrogen bond analysis. (A) Time evolution of intra-molecular H-bonds. (B) Figure shows time-evolution of intermolecular hydrogen bonds formed between ELAVL2 upon ZINC03830554
Secondary structure changesThe computation of secondary structural components of the ELAVL2 protein was conducted in order to monitor alterations in the overall content of its structure over time during the interaction with a ligand.
The molecular dynamics (MD) simulation analysis of the apo ELAVL2 protein and its subsequent interaction with ZINC03830554 shown that there was no substantial alteration in the composition of the secondary structure. However, slight changes were observed in the formation of coils and helices. The secondary structure composition of the apo protein consisted of 0.18% alpha helices, 0.23% beta sheets, and 0.23% coils. After binding the ligand, the secondary structure composition of the protein remained relatively stable with a minor increase in the percentage of coils and a slight increase in the percentage of alpha helices. The new secondary structure composition consisted of 0.21% alpha helices, 0.22% beta sheets, and 0.26% coils Table 3. Overall, the results suggest that the binding of the ligand did not induce significant changes in the secondary structure of the protein, indicating that the ligand may not be affecting the overall conformation of the protein (Fig. 9). However, the observed changes in the formation of coils and helices may indicate localized changes in the protein’s structure, which could potentially impact its function. Further analysis and experimentation are necessary to determine the precise effects of the ligand binding on the protein’s structure and function (See Fig. 9. Table 3).
Fig. 9
Time dependent secondary structure content. (A) ELAVL2 protein. (B) ELAVL2 after interaction of ZINC03830554
Table 3 Percentage of residues participated in average structure formation
留言 (0)