Cell culture
CAOV3 and OVCAR5 cell lines were a gift from Dr. Anirban Mitra (Indiana University). CAOV3, OVCAR5, OVCAR8 (National Cancer Institute Division of Cancer Treatment and Diagnosis Cell Line Repository, Bethesda, MD, USA), and COV318 (Sigma-Aldrich, St. Louis, MO, USA) cell lines were cultured in DMEM (Corning, Corning, NY, USA) supplemented with 10% fetal bovine serum (FBS) (Gibco, Fisher Scientific, Waltham, MA, USA) and 1% penicillin–streptomycin (pen-strep) (Gibco). OVCAR4 (National Cancer Institute Division of Cancer Treatment and Diagnosis Cell Line Repository) were cultured in RPMI-1640 (Gibco) supplemented with 10% FBS and 1% pen-strep. The human immortalized FTE cell line FT282, a gift from Dr. Ronny Drapkin (University of Pennsylvania) [33], was used to generate the clonal cell line FT282-C11 as previously described [34], and was cultured in DMEM and Ham’s F12, 50/50 mix (Corning) supplemented with 10% FBS and 1% pen-strep. All cell lines were maintained at 37 °C in a humidified incubator with 5% CO2. Cell lines were authenticated using short tandem repeat (STR) analysis at the DNA Services Facility, University of Illinois at Chicago. Cell lines were confirmed mycoplasma-free by PCR analysis using Mycofind™ Mycoplasma PCR Detection Kit (Clongen Laboratories, LLC, Gaithersburg, MD, USA).
Chemical compounds
Details on the preparation and spectroscopic characterization of NB compounds were previously described [29]. NB-73, NB-115, Thiostrepton (Sigma-Aldrich #598226), FDI-6 (Sigma-Aldrich #SML1392), RCM-1 (R&D Systems, Minneapolis, MN, USA, #6845), N-phenylphenanthren-9-amine (Sigma-Aldrich, St. Louis, MO, USA, #761966), MG132 (Sigma-Aldrich #474790), Q-VD-OPh (R&D Systems #OPH001), and olaparib (Selleck Chemicals, Houston, TX, USA, #S1060) were dissolved in DMSO. NB-55 and monensin (R&D Systems #5223) were dissolved in ethanol. Carboplatin (Sigma-Aldrich #C2538) was dissolved in water. All compounds were stored at -20 °C.
Protein extractions
Whole cell proteins were extracted using radio-immunoprecipitation assay (RIPA) buffer (1X PBS, 1% NP-40, 0.5% sodium deoxycholate, 0.1% sodium dodecyl sulfate [SDS]) supplemented with protease and phosphatase inhibitors (Sigma-Aldrich). Briefly, media was removed from cells, cells were washed in ice cold PBS, and cells were lysed for 15 min in RIPA buffer, collected from the plate, and sonicated. The resulting extracts were centrifuged at 4 °C for 10 min at 16,100 × g to remove cell debris. In some cases (e.g., when measuring apoptotic markers such as cleaved PARP) floating cells were isolated in parallel and combined with the remainder of the cell sample prior to protein extraction. Protein concentrations were determined using the Pierce™ BCA Protein Assay Kit (Fisher Scientific, Waltham, MA, USA).
Nuclear and cytoplasmic protein fractions were extracted using the NE-PER Nuclear and Cytoplasmic Extraction Reagents (ThermoFisher Scientific, Waltham, MA, USA). Protein was isolated following the manufacturer’s protocol including supplementation of the CER I and NER reagents with protease and phosphatase inhibitors (Sigma-Aldrich). Protein concentrations were determined as described above.
Western blotting
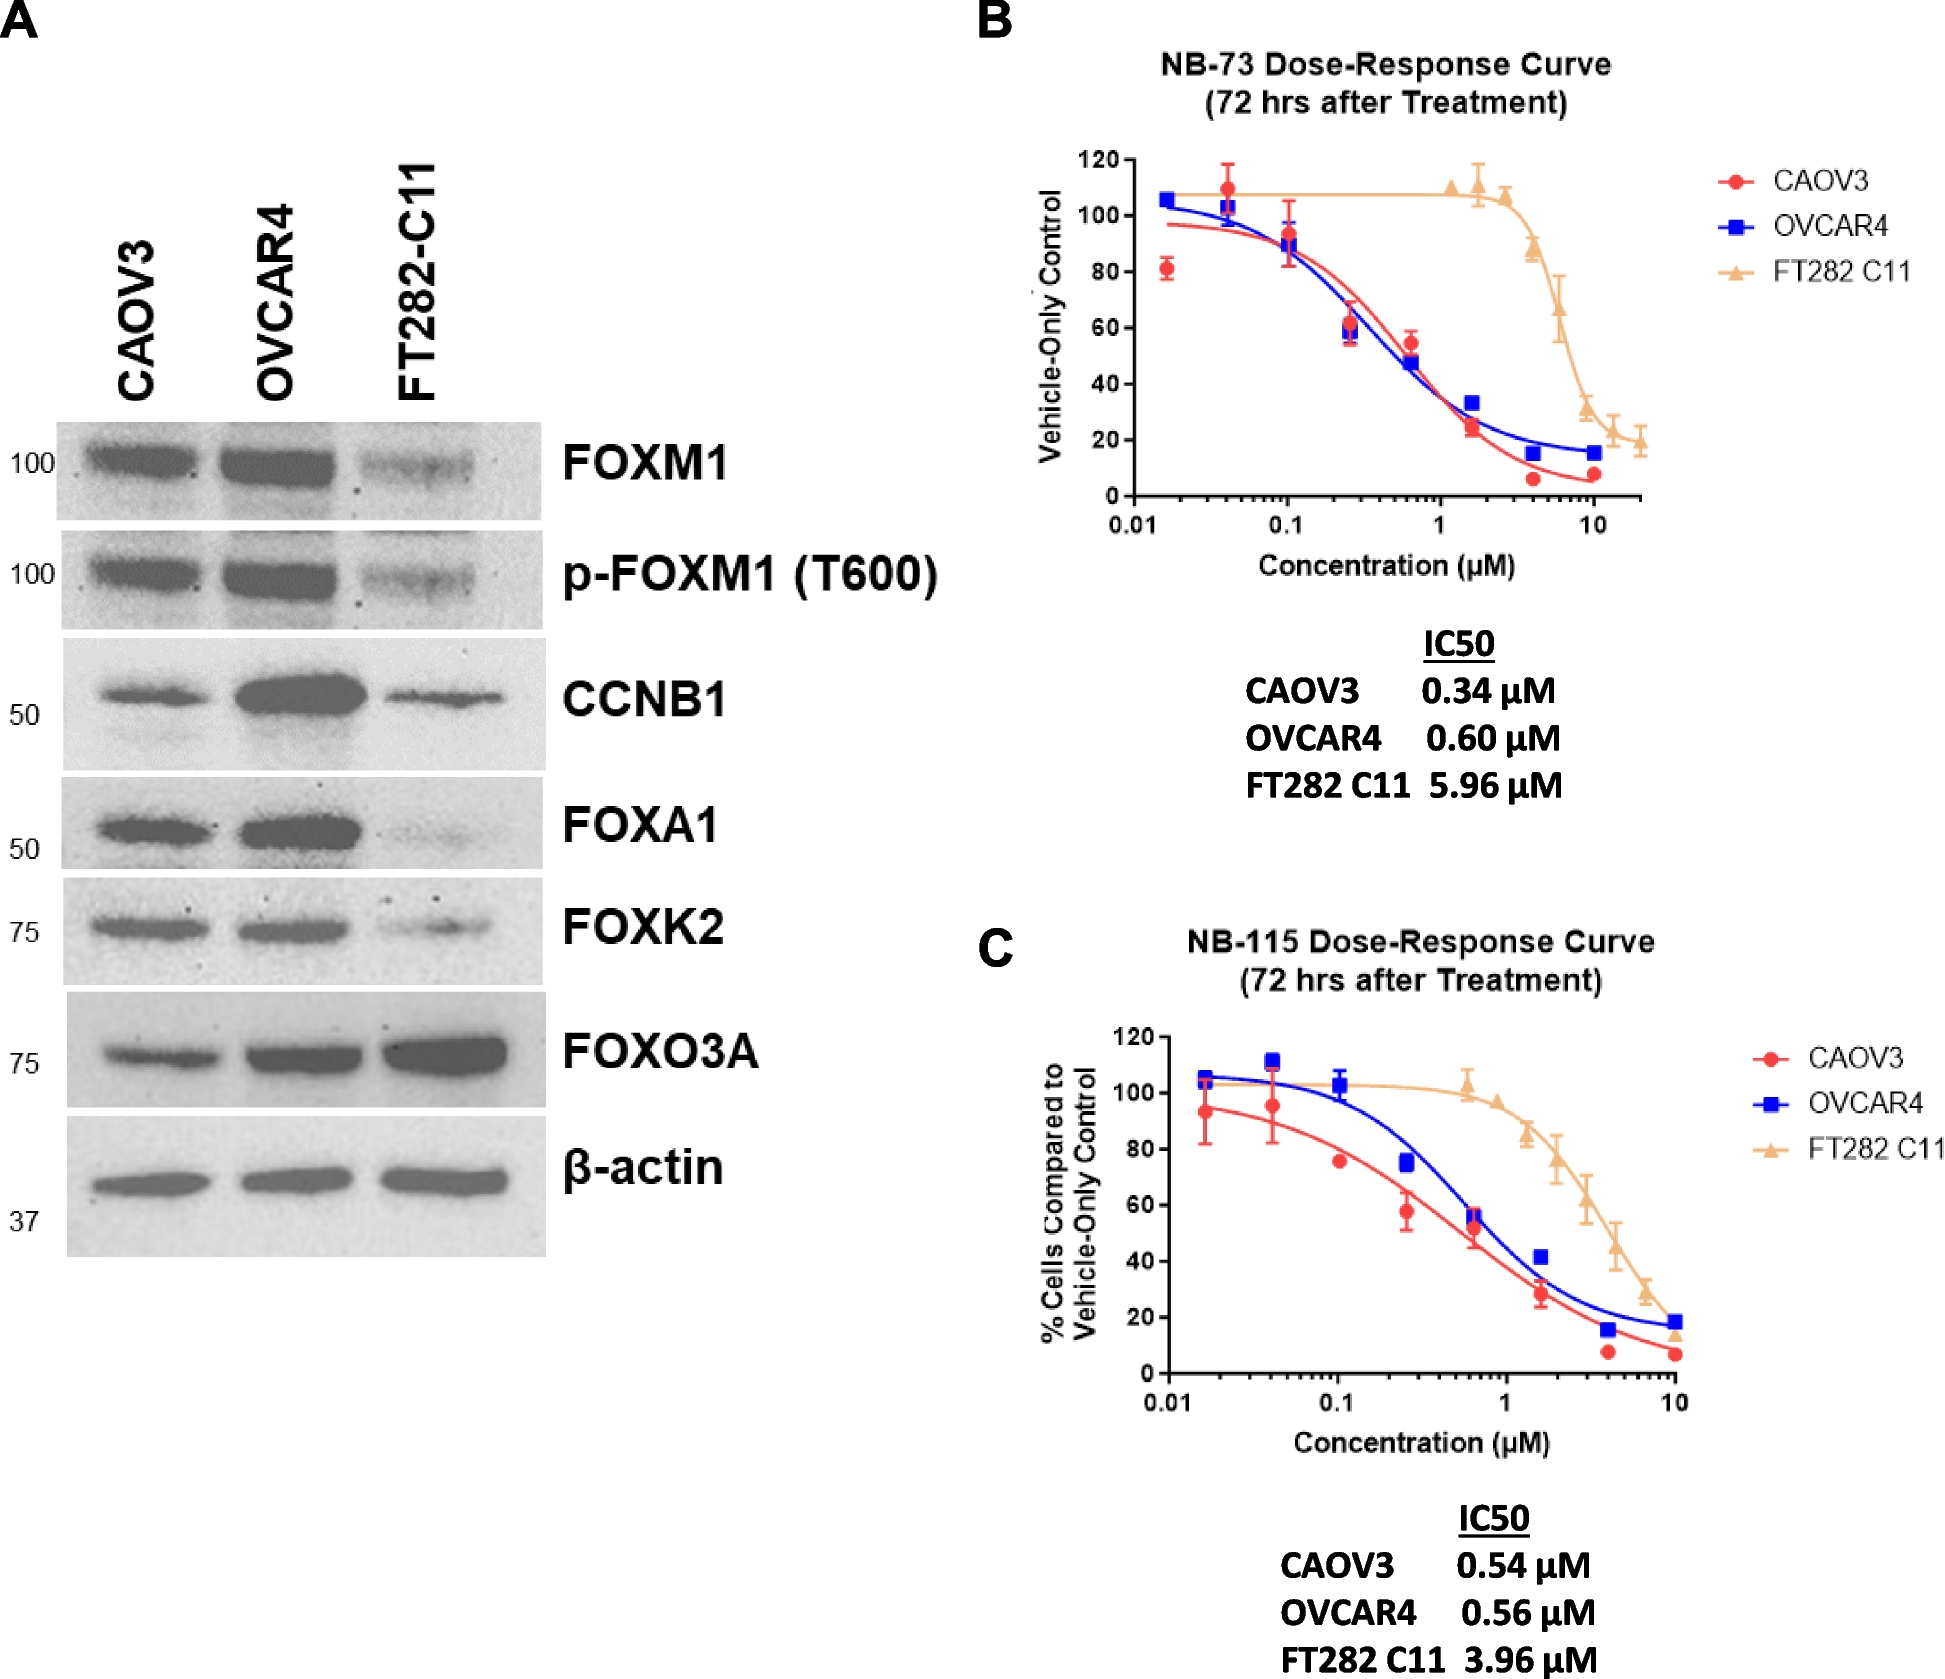
Equivalent amounts of protein per well, as determined by BCA assays, were loaded into Invitrogen™ NuPAGE™ 4–12%, Bis–Tris, 1.5 mm, mini protein gels (Fisher Scientific) or 7.5% Mini-Protein TGX precast protein gels (Bio-Rad, Hercules, CA, USA), and subsequently transferred to 0.45 µm polyvinylidene difluoride (PVDF) membranes (Millipore Sigma, St. Louis, MO, USA), using a wet transfer system. Membranes were stained with ThermoFisher Scientific™ Pierce™ Reversible Protein Stain Kit (Fisher Scientific) or Ponceau S (Acros Organics, Fisher Scientific, Waltham, MA, USA) to confirm equivalent protein loading. Membranes were blocked with 5% nonfat dry milk (Kroger, Cincinnati, OH, USA) in TBS-T at room temperature. Membranes were incubated in primary antibodies in 5% BSA (Sigma-Aldrich). Primary antibodies included anti- FOXM1 (Cell Signaling Technology, CST, Danvers, MA, USA) (CST #5436, 1:1,000), p-FOXM1 (Thr600) (CST #14655, 1:1,000–1:2,000), AURKB (Abcam, Waltham, MA, USA, #2254, 1:1,000), CCNB1 (CST #4138, 1:1,000–1:2,000), CDC25B (CST #9525, 1:1,000–1:2000), PLK1 (CST #4513, 1:1,000) FOXA1 (CST #53528, 1:1,000–1:2,000)), FOXK2 (CST #12008, 1:1,000), FOXO3a (CST #12829, 1:10,000), cleaved PARP (cl-PARP) (CST #5625, 1:1,000), ubiquitin (CST #14049, 1:20,000). alpha-tubulin (CST #2144, 1:5,000), β-actin (Santa Cruz Biotechnology, Dallas, TX, USA, # 47778, 1:10,000), and Lamin B1 (CST #12586, 1:1,000). Following primary antibody incubation, membranes were washed in TBS-T at room temperature and then incubated in goat anti-rabbit secondary antibody (CST #7074, 1:500–1:5,000) or horse anti-mouse secondary antibody (CST #7076, 1:500–1:10,000) in 5% non-fat dry milk (Kroger) in TBS-T for 1 h at room temperature. SuperSignal™ West Pico PLUS Chemiluminescent Substrate (Fisher Scientific) was used for protein detection. Ultra blue X-ray films (Light Labs, Aurora, CO, USA) were applied to the blots, and subsequently developed in a standard film processor. Quantification of protein expression was performed using Fiji software [35].
CyQuant assay
Cells were seeded into 96-well plates and treated with serial dilutions with the designated compounds for 72 h. Medium was then removed from the wells, and the cells were frozen at -80 °C for storage. After thawing, cell viability was analyzed using the CyQUANT™ Cell Proliferation Assay for cells in culture (Invitrogen, ThermoFisher Scientific, Waltham, MA, USA), according to manufacturer’s instructions. The CyQuant assay utilizes a DNA binding fluorescent dye, and the signal is proportional to the number of live cells, which thus reflects the effect of drug treatment on both cell proliferation and cytotoxicity. To integrate these two measures (proliferation and cytotoxicity) into one simple term, we refer to CyQuant data as a measure of cell viability. Fluorescence intensity was measured using POLARstar OPTIMA microplate multi-detection plate reader (BMG LabTech, Cary, NC, USA) with settings specified by the manufacturer’s instructions.
RT-qPCR
RNA was extracted using TRIzol Reagent (Invitrogen) and purified with the Direct-zol™ RNA MiniPrep Kit (Zymo Research, Irvine, CA, USA) following the manufacturer’s protocol with DNase treatment. RNA integrity was confirmed by running denatured samples on agarose gels in MOPS buffer containing formaldehyde. RNA yield and purity was assessed using a Nanodrop 2000 instrument (ThermoFisher) and by determining 260/280 and 260/230 nm sample absorbance. cDNA was generated using 200–1,000 ng RNA with the High-Capacity cDNA Reverse Transcription kit (Applied Biosystems, ThermoFisher Scientific, Waltham, MA, USA) following the manufacturer’s protocol. cDNA was diluted 1:5 in PCR-grade water (Sigma) and 1.0 μl sample was added to a mix of iTaq Universal SYBR® Green Supermix and primers. PCR primer sequences are listed in Table 1. Reaction mixtures were run using the CFX Connect Real-Time System (Bio-Rad) with an annealing temperature of 60OC for 40 cycles. Standard curves were generated using products from endpoint RT-PCR purified by gel-purification (QIAquick PCR purification kit, Qiagen, Germantown, MD, USA). mRNA measurement for genes of interest were normalized to 18S rRNA.
Time course analysis of FOXM1 mRNA and protein expression after NB compound treatment
CAOV3 cells were seeded into 6-well or 35 mm plates and treated with DMSO or NB-73. RNA and protein were isolated in parallel from untreated samples at the time of treatment (0 h) and at time points after treatment. RNA was isolated and used for RT-qPCR analysis. Whole cell protein extracts were isolated and used for western blotting.
Drug washout study
To assess FOXM1 protein expression, cells were seeded into 6-well plates and treated with DMSO or NB compounds the next day. At 3- or 6-h post-treatment, media was aspirated and cells were washed with PBS and incubated with drug-free media until reaching 24, 48, or 72 h post the initial treatment. At time points post-treatment, protein was isolated from washout and no washout (i.e., continuous treatment) treatment conditions and used for western blotting. To assess the effects of drug washout on cell viability, cells were seeded in 96-well plates, treated as described above, and cell viability was assessed at 72 h post the initial treatment using CyQuant assays.
Incucyte analysis
CAOV3 cells were seeded into 96-well plates in DMEM media containing Incucyte Nuclight Rapid Red Dye (Sartorius, Bohemia, NY, USA, Cat #4717) 1:1,000 (for live cell nuclear labeling) and Incucyte Cytotox Green Dye (Sartorius Cat #4633) 250 μM (for counting of dead cells). The following day, cells were treated with DMSO or NB compounds at 0.1, 0.5 or 1.0 μM concentrations. After treatment, cells were incubated in a Incucyte S3 time lapse imager (Sartorius). We obtained 5 pictures per well every 2 h, for a total of 72 h. Data were analyzed and plotted using Incucyte Live-cell Imaging and Analysis software.
Cell cycle analyses
Cells were seeded into 6-well plates and treated with the designated compound(s) for 24 h. For cell collection, the adherent cells were trypsinized, centrifuged at 500 × g to form a pellet, and washed with PBS. For cell fixation, the washed cells were centrifuged at 500 × g to form a pellet, PBS was aspirated from the cell pellet, and 1.0 mL 70% ice-cold ethanol was slowly added dropwise while the cell pellet was gently vortexed. Cells were stored in -20 °C for at least 3 h. For cell staining, the fixed cells were washed with 4.5 mL PBS thrice, centrifuging at 2,000 × g to form a pellet each time, and the final cell pellet was resuspended in 200 µL FxCycle™ PI/RNase Staining Solution (ThermoFisher Scientific). The cells were incubated for 30 min, protected from light. Cells were transferred to a 1.5 mL microcentrifuge tube for analysis. Cell cycle was analyzed by flow cytometry using the Cell Cycle program on the Guava® Muse® Cell Analyzer. A stained sample was used to adjust instrument settings, determine gating strategies, and define the DNA profile content histogram. Experimental samples were thoroughly resuspended before loading onto the Guava® Muse® Cell Analyzer, and 10,000 events were acquired for each experimental sample.
Caspase-3/7 activity assay
Cells were seeded into 6-well plates and treated with the designated compounds until the desired time point. Floating cells and trypsinized cells from the wells were collected, centrifuged at 500 × g, and washed with PBS. Cells were prepared using the Muse® Caspase-3/7 Kit (Luminex Corporation, Austin, TX, USA) according to the manufacturer’s instructions. Cells were analyzed by flow cytometry using the Guava® Muse® Cell Analyzer (Luminex Corporation).
Two-dimension (2D) and three-dimension (3D) colony formation assay
For 2D anchorage-dependent colony formation assays, 2500 cells in single-cell suspension were seeded into triplicate wells of 6-well plates, incubated for 24 h, then treated with the designated compounds and allowed to form colonies for 7 days (OVCAR4, OVCAR5, OVCAR8) or 14 days (CAOV3). At the end of incubation period, cells were fixed in methanol, stained with crystal violet, washed with water, and air-dried overnight. Pictures of the wells were captured and colonies were counted using Count and Plot Histograms of Colony Size (countPHICS) software [36], a macro written for ImageJ. The threshold for colony size was automatically determined by countPHICS.
For 3D anchorage-independent colony formation assays, 2500 cells in single-cell suspension were seeded into a 0.4% SeaPlaque™ Agarose (Lonza Bioscience, Rockland, ME, USA) liquid solution and placed on top of a solidified layer of 0.8% SeaPlaque™ Agarose solution in triplicate wells of 6-well plates. The top layer with cells was allowed to solidify at room temperature for at least 30 min. After 24 h, cells were treated with the designated compounds in the media above the two agarose layers and allowed to form colonies for 14 days. Following incubation, cells were stained with crystal violet and washed with water. Pictures of the wells were taken, and colonies were counted using countPHICS software [36]. The threshold for colony size was automatically determined by countPHICS.
Drug synergy assessment
CyQuant assays were performed as described above. Concentrations of each compound were decided based on the diagonal method to measure drug synergy and are presented in Table 2 [37]. Drug interactions and synergy assessment was determined using CompuSyn software (ComboSyn, Inc., Paramus, NJ, USA).
Table 2 Drug Concentrations used for synergy testingFor simultaneous drug treatment, cells were seeded into 96 well plates at 2500 cells per well and 24 h later the media was removed and treated with NB compounds and carboplatin. 72 h later, media was removed, and the plates were transferred to -80° C. Later, plates were thawed and processed for CyQuant assays. For sequential drug treatment, cells were seeded into 96 well plates at 2500 cells per well, and 24 h later the media was removed and treated with NB compounds. 24 h later, the media was removed, and cells were treated with carboplatin. 48 h later, the media was removed, plates were transferred to -80° C. Later, plates were thawed and processed for CyQuant assays.
Study replication and statistics
Experiments were performed using three biological replicates, typically each with technical triplicate measurements. In some cases, representative data from one replicate are presented (e.g., western blot images). Statistical analyses were performed using GraphPad Prism and specific tests used are provided in Figure Legends. If the numerical p-values are not specifically indicated, the significance notation used is * for p < 0.05, ** for p < 0.01, *** for p < 0.001, and **** for p < 0.0001.


留言 (0)