
記住我

Resuscitation strategies of bleeding trauma patients have evolved throughout the years. Military and civilian experiences and studies have repeatedly demonstrated that resuscitation with blood products is superior to fluid-based resuscitation. This holds especially true when balanced component therapy (CT) is achieved and maintained (1:1:1 ratio of plasma, platelets, and packed red blood cells [pRBCs]).1–4 However, high-volume resuscitation with imbalanced blood product transfusion may worsen trauma-induced coagulopathy, which significantly increases the risk of morbidity and mortality in trauma patients.5–7 Therefore, balanced blood transfusion early in the management of patients with hemorrhagic injuries is considered the standard of care.
Because of technical, immunological, and logistical considerations, whole blood (WB) donations are routinely separated into their components instead of being wholly transfused.8 However, experience with WB transfusion in the battlefield has resurrected its potential application in civilian trauma.9–12 Recent examinations of WB in civilian trauma resuscitation have demonstrated a decrease in total transfusion volume while offering a superior hemostatic profile and comparable risks of hemolytic reactions to CT.9,11–13 Further, WB has shown an added benefit in reducing both short-term and long-term mortalities as well as in-hospital complications in trauma resuscitation.13–16
This mortality benefit has led many trauma centers to use WB as the first blood product in trauma resuscitation transfusions before continuing with CT when massive transfusion protocol (MTP) is required.17 Despite the increasing adaptation of WB, the number of studies examining its effectiveness15,18 and safety12 in mixed transfusion scenarios (WB and CT) remains relatively limited. The findings reported by these previous studies have demonstrated mixed results on mortality and the risk of adverse outcomes when comparing mixed WB transfusions with CT alone.14–16,19 More recent studies have compared CT alone to WB added to traditional resuscitation protocols in a categorical approach, not accounting for volumes of transfused products. Carefully examining these studies, we identified two gaps that remain unanswered; there was no direct comparison between WB alone and CT alone, and there was generally no assessment of ideal transfused WB volume, especially in relation to the volume of subsequent CT transfusions. Thus, it is plausible that the added benefit of the limited early WB transfusion is eventually “diluted” with subsequent massive CT resuscitation.17
In this study, we aim to investigate the impact of different ratios of mixed blood resuscitations that utilize WB on the outcomes of injured patients requiring hemorrhage control interventions. We hypothesized that a low pRBC/WB transfusion ratio is associated with improved survival in trauma patients.
METHODSThis is a retrospective analysis of the 2021 Trauma Quality Improvement Program (TQIP) database. We aimed to evaluate adult trauma patients (>18 years old) who underwent hemorrhage control surgery at participating trauma centers and were transfused within 4 hours of hospital arrival with either WB, pRBC, or both. Hemorrhage control surgery in TQIP was defined as undergoing any of the following procedures for the purpose of controlling bleeding: laparotomy, thoracotomy, sternotomy, extremity procedures including management of mangled extremity, neck exploration, extraperitoneal pelvic packing, or other skin and soft tissue procedures. After constructing the study concept, we obtained 2021 TQIP data from the American College of Surgeons, being the most recently published data at the time of the analysis. Our aim was to determine the association of pRBC/WB ratio with mortality at 24 hours. Patients were excluded if they were transferred from another facility, died in the emergency department (ED), or only received pRBC. Since TQIP provides publicly available, unidentified pooled data, the study was exempt from full IRB review. Results are presented in accordance with The Strengthening the Reporting of Observational studies in Epidemiology (STROBE) guidelines (Supplemental Digital Content 1, https://links.lww.com/TA/D437).
Our comparison groups were the different ratios of packed red blood to whole blood cell units administered during the first 4 hours of resuscitation (pRBC/WB). Beginning in 2021, TQIP began reporting transfusion volumes in milliliters (mL). This information was limited to the first 4 hours only. These were collected from trauma flow sheets, anesthesia records, operative reports, nursing flow charts, and blood bank records per the National Trauma Data Standards (NTDS). These volumes were converted to units per standard guidelines (1 unit of WB = 500 mL, 1 unit of pRBC = 350 mL, 1 unit of fresh frozen plasma (FFP) = 250 mL, and 1 unit of platelets = 300 mL).20 Ratio of pRBC/WB was then categorized into five categories (1:1, 2:1, 3:1, 4:1, 5:1), in which each category includes ratios up to the next category and 5:1 indicates any ratio that was equal or higher than 5:1. Our primary outcome was mortality at 24 hours. Secondary outcomes included overall in-hospital mortality and reported in-hospital complications including acute respiratory distress syndrome, acute kidney injury, severe sepsis, deep vein thrombosis, unplanned intensive care unit stay, unplanned intubation, pneumonia, decubitus ulcer development, and unplanned return to the operating room. Patients who died in the first 24 hours were excluded from the in-hospital complications analyses to avoid survival bias effect. One exception was for unplanned return to the operating room as this could have occurred any time during the hospital stay. Unplanned return to the operating room excluded staged operation following damage-control surgery.
Analyses were adjusted for demographics (age, gender), injury severity and pattern (injury severity score, penetrating trauma), time to hemorrhage control surgery, hemodynamic status on presentation defined by shock index, Glasgow Coma Scale on presentation, total units of transfusion administered, and type of hemorrhage control surgery performed. Time to hemorrhage control surgery indicated time between presentation and surgical incision per NTDS. Total units transfused was calculated as the sum of WB, pRBC, and FFP units. Specific organ injuries were defined per ICD10-CM codes. To adjust for injury severity as well as anatomical location of injury the New Injury Severity Score (NISS) was included in the adjusted models. New Injury Severity Score is calculated similar to Injury Severity Score but uses the three most injured organs regardless of the body region. This was calculated using the ICDPIC-R package based on ICD10-CM codes. It was computed in R statistical software, then imported to STATA to complete the analysis.
Descriptive data are presented as frequencies for categorical variables, means for parametric continuous variables, and medians for nonparametric continuous variables. We applied Pearson's χ2 test with Fisher's exact test for sparse values to test independence for categorical data. Parametric continuous data were compared between the different ratio groups using Wilks' Lambda test for equality. Nonparametric data were analyzed using Kruskal Wallis equality-of-population rank test. In-group comparisons were performed using Dunn's test with adjustment for multiple computations (Supplemental Material 1, https://links.lww.com/TA/D438). Trends in mortality rates per each increase in ratio group were compared using Cuzick's trend analysis. Multiple logistic regression analysis was performed to obtain adjusted odds ratios (ORs) and 95% confidence intervals (CIs) for 24-hour mortality. We chose statistically significant and clinically important variables to include in the multiple logistic regression analysis. We tested the variables linearity using Box-Tidwell regression. This identified age and time to hemorrhage control surgery to not be linear. Therefore, age was categorized into three categories (18–45, 46–65, 66 and older). We also performed a log transformation of time to hemorrhage control surgery to correct nonlinearity in the model. Only 15 patients had time to hemorrhage control surgery recorded as 0 minutes, and they were excluded from the logistic regression analysis after log transformation. Model goodness-of-fit was tested using the Hosmer-Lemeshow test. Resulting predicted mortality was calculated and plotted in Figure 2. Empirical cutpoint estimation was performed using Liu method to estimate optimal cutoff point. Multivariable adjusted logistic regression analysis was then repeated while changing the reference value to different ratio groups in order to obtain in-group estimates. We then performed survival analysis to account for difference in time to death within the first 24 hours. We applied an adjusted Cox regression analysis to estimate hazard ratios of 24-hour mortality among the different groups, adjusting for the same variables that were used in the multiple logistic regression model. Significance was set at p = 0.05. We computed the analyses using a commercial statistical software (STATA/SE 17; StataCorp 2021, College Station, TX).
RESULTSWe identified 17,562 patients who underwent hemorrhage control surgery after accounting for inclusion and exclusion criteria. Of those, 13,678 patients received resuscitation with component therapy only, and therefore, were excluded from the final analytic cohort.
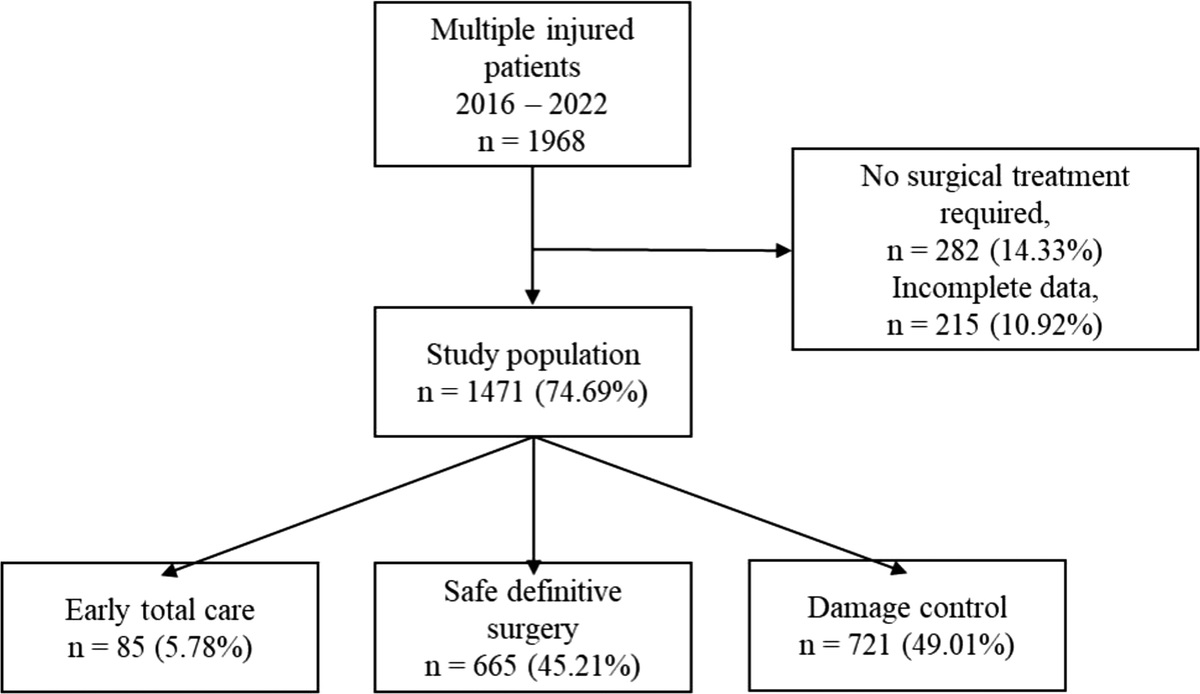
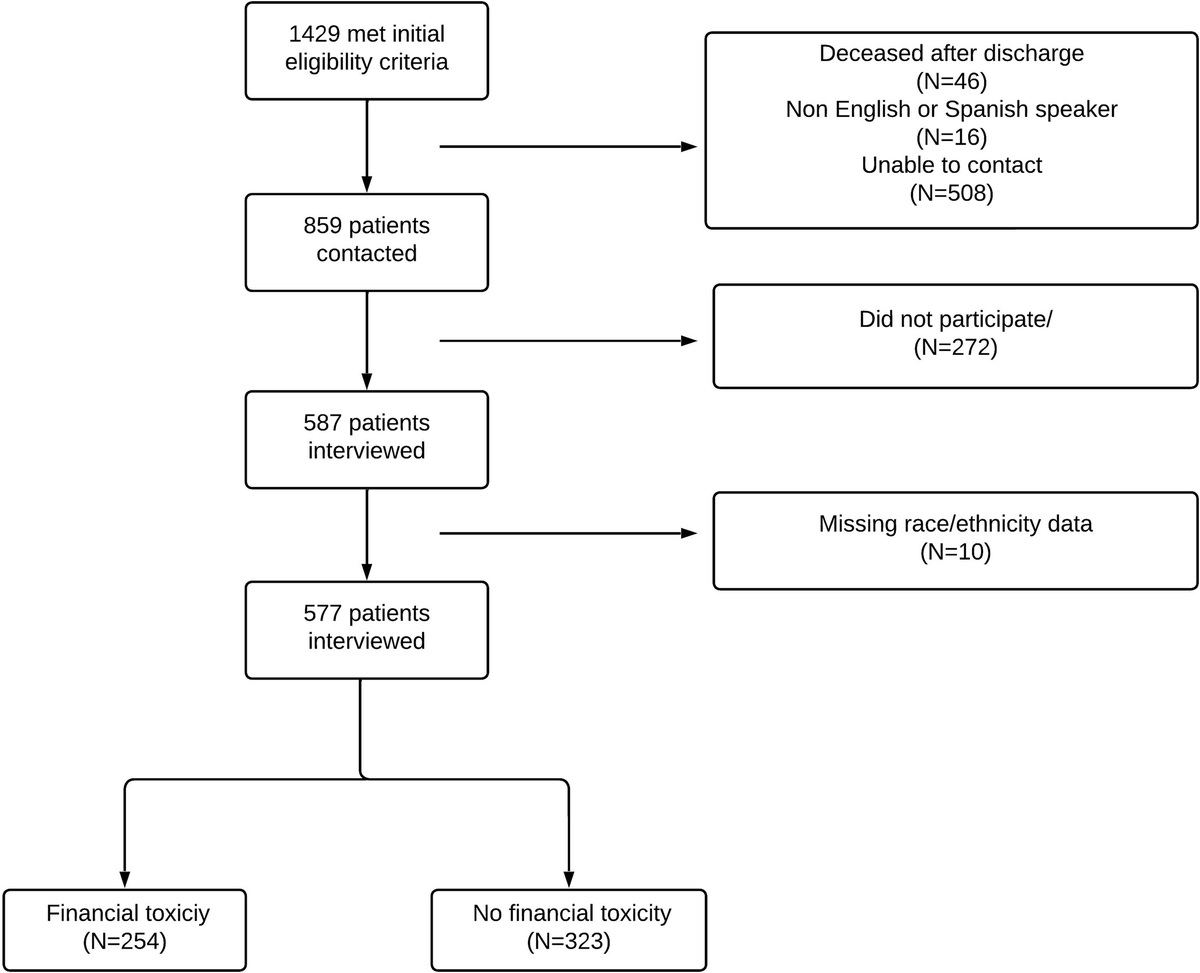
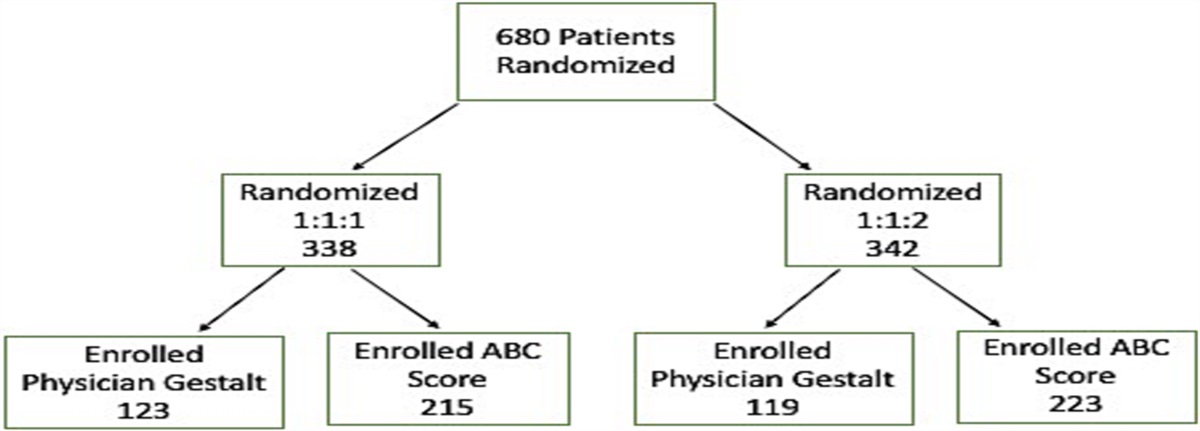
Our analytic cohort included 3,884 patients who received WB, either alone or in combination with pRBC (Fig. 1). On average, patients received 2 units of WB (interquartile range [IQR], 1–3) and 5 units of pRBC (IQR: 2–11). Aside from WB administration, transfusion of FFP was balanced (median FFP/pRBC ratio of 1:1) in all categories. Details regarding patients' demographics, injury patterns, and hemorrhage control procedures are listed in Table 1.
 Figure 1:
 Flow diagram of patient's selection to reach our analytic sample.
TABLE 1 - Characteristics of Patients Who Received WB Alone or With pRBC at Different Ratios Total WB Only 1:1 2:1 3:1 4:1 5:1+ p n 3,884 1,037 (26.7%) 469 (12.1%) 698 (18%) 436 (11.2%) 308 (7.9%) 936 (24.1%) Age, mean 39 ± 16 40 ± 16 40 ± 16 39 ± 16 40 ± 16 37 ± 15 39 ± 16 0.28 Male gender 3,208 (82.6%) 844 (81.4%) 379 (80.8%) 568 (81.4%) 359 (82.3%) 262 (85.1%) 796 (85%) 0.15 Race, Black 1,416 (36.5%) 341 (32.9%) 178 (38%) 256 (36.8%) 143 (32.8%) 121 (39.3%) 377 (40.3%) 0.008 SBP, mean 100 ± 37 110 ± 32 101 ± 35 102 ± 34 97 ± 37 92 ± 40 93 ± 43 0.0001 Lowest SBP 78 ± 40 89 ± 28 79 ± 29 79 ± 28 76 ± 27 71 ± 33 68 ± 34 0.0001 Heart rate 103 ± 36 101 ± 29 105 ± 34 107 ± 32 106 ± 36 103 ± 42 102 ± 44 0.01 SI > 1 1,549 (43.5%) 314 (31.5%) 197 (44.7%) 304 (46.1%) 196 (49%) 140 (51.9%) 398 (50.2%) 0.0001 BMI, mean 28.5 ± 12.1 28.8 ± 18 28.9 ± 9.8 28.3 ± 9.7 28.6 ± 6.6 28.9 ± 12.7 28 ± 6.4 0.87 GCS, median 14 (5–15) 15 (13–15) 14 (6–15) 14 (7–15) 14 (5–15) 14 (3–15) 12 (3–15) 0.0001 GCS < 8 1,137 (30%) 181 (17.7%) 126 (28.1%) 187 (27.4%) 132 (31.3%) 107 (36.2%) 404 (44.2%) 0.0001 WB units 2 (1–3) 2 (1–2) 4 (2–5) 2 (2–4) 2 (1–3) 2 (1–2) 2 (1–2) 0.0001 PRBC units 5 (2–11) NA 1 (1–3) 3 (2–5) 4 (2–7) 6 (3–7) 13 (8–22) 0.0001 FFP units 2 (0–7) 0 1 (0–3) 2 (1–5) 3 (1–6) 5 (2–8) 12 (6–20) 0.0001 Platelet units 0 (0–1) 0 (0–0) 0 (0–0) 0 (0–0) 0 (0–0) 0 (0–1) 1 (0–2) 0.0001 pRBC/FFP 1:1 (1:1–1:2) NA 1:1 (1:1–1:1) 1:1 (1:1–1:1) 1:1 (1:1–2:1) 1:1 (1:1–1:2) 1:1 (1:1–1:2) 0.0001 pRBC/PLT 7:1 (5:1–11:1) NA 2:1 (1:1–3:1) 5:1 (3:1–7:1) 5:1 (4:1–9:1) 6:1 (4:1–8:1) 8:1 (6:1–12:1) 0.0001 WB + PRBC, units 5 (3–11) 2 (1–2) 5 (3–7) 5 (4–9) 6 (3–10) 8 (4–9) 15 (10–24) 0.0001 Penetrating 2,026 (52.2%) 589 (56.8%) 255 (54.4%) 341 (48.9%) 200 (45.9%) 164 (53.3%) 477 (51%) 0.001 Hemorrhagic Injury Liver 1,104 (28.4%) 218 (21%) 130 (27.7%) 172 (24.6%) 116 (26.6%) 89 (28.9%) 379 (40.5%) 0.0001 Spleen 868 (22.4%) 172 (16.6%) 112 (23.9%) 148 (21.2%) 90 (20.6%) 78 (25.3%) 268 (28.6%) 0.0001 Pelvis 924 (23.8%) 189 (18.2%) 113 (24.1%) 172 (24.6%) 106 (24.3%) 81 (26.3%) 263 (28.1%) 0.0001 Renal 522 (13.4%) 105 (10.1%) 59 (12.6%) 93 (13.3%) 65 (14.9%) 42 (13.6%) 158 (16.9%) 0.001 Cardiac 238 (6.1%) 34 (3.3%) 29 (6.2%) 40 (5.7%) 24 (5.5%) 31 (10.1%) 80 (8.6%) 0.0001 Vascular 1,615 (41.6%) 336 (32.4%) 186 (39.7%) 280 (40.1%) 174 (39.9%) 135 (43.8%) 504 (53.8%) 0.0001 Hemothorax 444 (11.4%) 68 (6.6%) 61 (13%) 65 (9.3%) 48 (11%) 52 (16.9%) 150 (16%) 0.0001 Total injuries 1 (1–2) 1 (0–2) 1 (1–2) 1 (1–2) 1 (1–2) 1 (1–2) 2 (1–3) 0.0001 ISS, median 25 (16–34) 17 (10–26) 25 (16–34) 22 (14–34) 22 (16–35) 26 (17–38) 29 (21–41 0.0001 ISS > 25 1, 953 (50.3%) 331 (31.9%) 243 (51.8%) 343 (49.1%) 213 (48.9%) 185 (60.1%) 638 (68.2%) 0.0001 NISS, median 38 (26–54) 29 (17–43) 38 (27–50) 36 (24–50) 41 (27–57) 41 (27–57) 48 (34–59) 0.0001 Hemorrhage control surgery 0.0001 Laparotomy 2,299 (59.2%) 549 (52.9%) 293 (62.5%) 396 (56.7%) 265 (60.8%) 170 (55.2%) 626 (66.9%) Thoracotomy 491 (12.6%) 65 (6.3%) 60 (12.8%) 80 (11.5%) 58 (13.3%) 60 (19.5%) 168 (18%) Sternotomy 64 (1.6%) 11 (1.1%) 8 (1.7%) 10 (1.4%) 6 (1.4%) 9 (2.9%) 20 (2.1%) Pelvic packing 39 (1%) 4 (0.4%) 3 (0.6%) 8 (1.2%) 6 (1.4%) 9 (2.9%) 20 (2.1%0 Extremity 515 (13.3%) 213 (20.5%) 59 (12.6%) 96 (13.7%) 55 (12.6%) 37 (12%) 55 (5.9%) Other 476 (12.3%) 195 (18.8%) 46 (9.8%) 108 (15.5%) 46 (10.6%) 27 (8.85) 54 (5.8%) Time to hemorrhage control, min 53 (31–106) 65 (35–150) 53 (30–104) 58 (33–128) 58 (33–106) 53 (30–98) 41 (27–72) 0.0001Data are presented as counts and percentages, median with IQR, or means with standard deviation.
GCS, Glasgow Coma Scale; ISS, Injury Severity Score; NISS, New Injury Severity Score; SBP, systolic blood pressure; SI, shock index.
Mortality at 24 hours increased with increasing pRBC/WB ratio from 5.2% in the WB-only group, 10.9% in the 1:1 group, and up to 34.1% in the 5:1 or more group (p = 0.0001 using both χ2 test and Cusick trend test) (Fig. 2). Within-group comparisons showed that both 4:1 and 5:1 ratios had a significantly higher mortality compared with WB alone (p = 0.009 and 0.008, respectively). Table 2 details the differences in incidence of mortality and in-hospital complications between the groups.
 Figure 2:
 Adjusted mortality rates among different transfusion ratio groups. p Values indicate direct comparison to WB only group.
TABLE 2 - Differences in Outcomes Among the Different Ratio Groups Outcomes All n = 3,884 WB n = 1,037 1:1 n = 469 2:1 n = 698 3:1 n = 436 4:1 n = 308 5:1+ n = 936 p Death 24 h 635 (16.4%) 54 (5.2%) 51 (10.9%) 82 (11.8%) 65 (14.9%) 64 (20.9%) 319 (34.1%) 0.0001 In-hospital mortality 955 (24.6%) 94 (9.1%) 77 (16.4%) 145 (20.8%) 102 (23.5%) 80 (26.1%) 457 (48.8%) 0.0001 Hospital LOS, median 11 (4–22) 9 (5–18) 13 (6–24) 11 (6–23) 12 (5–23) 11 (4–26) 9 (2–24) 0.0001 ARDS 72 (2.2%) 8 (0.8%) 10 (2.4%) 12 (1.9%) 8 (2.1%) 11 (4.5%) 23 (3.7%) 0.001 AKI 205 (6.3%) 15 (1.5%) 17 (4.1%) 41 (6.7%) 14 (3.8%) 21 (8.6%) 97 (15.7%) 0.0001 Severe sepsis 87 (2.7%) 8 (0.8%) 11 (2.6%) 20 (3.3%) 7 (1.9%) 10 (4.1%) 31 (5%) 0.0001 DVT 185 (5.7%) 23 (2.6%) 27 (6.5%) 35 (5.7%) 22 (5.9%) 17 (7%) 61 (9.9%) 0.0001 Unplanned ICU admission 192 (5.9%) 43 (4.4%) 30 (7.2%) 32 (5.2%) 21 (5.7%) 19 (7.8%) 47 (7.6%) 0.06 Unplanned intubation 143 (4.4%) 28 (2.9%) 19 (4.6%) 27 (4.4%) 18 (4.9%) 15 (6.2%) 36 (5.8%) 0.06 Pneumonia 114 (3.5%) 13 (1.3%) 13 (3.1%) 18 (2.9%) 20 (5.4%) 19 (7.8%) 31 (5%) 0.0001 Decubitus ulcer 107 (3.3%) 14 (1.4%) 10 (2.4%) 26 (4.2%) 11 (3%) 16 (6.6%) 30 (4.9%) 0.0001 Unplanned return to operating room 393 (10.1%) 64 (6.2%) 43 (9.2%) 61 (8.7%) 50 (11.5%) 42 (13.6%) 133 (13.2%) 0.0001Data are presented as counts and percentages, unless otherwise specified.
LOS, length of stay; ARDS, acute respiratory distress syndrome, AKI, acute kidney injury, DVT, deep venous thrombosis; ICU, intensive care unit.
Multiple logistic regression analysis adjusting for demographics, injury severity, location and pattern, hemodynamic status, time to hemorrhage control surgery, type of hemorrhage control procedure, mental status, and total units of blood transfusions showed a significantly higher OR of 24-hour mortality in both the 4:1 group (OR, 2.85; 95% CI, 1.19–6.81) and the 5:1 group (OR, 2.89; 95% CI, 1.29–6.49) compared with WB only group. Hosmer-Lemeshow test indicated a good fit of the model (χ2 = 8.90, p = 0.35). Using Liu method of empirical cutpoint estimation, we identified ratio 3:1 or less as an optimal cutoff point for survival. Survival analysis using Cox regression showed higher hazard ratios in the 3:1, 4:1, and 5:1 transfusion ratio groups. Table 2 details adjusted OR and HR of 24-hour mortality for each of the ratio groups with WB considered the reference group. Full results of the regression models, as well as summary of the in-group estimates of mortality are presented in the Supplemental Materials, https://links.lww.com/TA/D438. Figure 3 shows Kaplan-Meier survival curves up to 24 hours.
 Figure 3:
 Kaplan-Meier survival curves for different transfusion ratio groups.
DISCUSSIONIn our analysis of the TQIP 2021 database in patients who received hemorrhage control surgery, we found that early resuscitation that was primarily centered on WB had a significant impact on mortality rate with improved survival in patients with lower ratios of pRBC to WB. Patients with higher pRBC/WB ratios had significantly higher adjusted hazard ratio of mortality at 24 hours.
Recently, several analyses have examined the effect of WB on morbidity and mortality in trauma resuscitation.14–16 Using similar TQIP databases, Hanna et al.14 and Torres et al.15 found that WB decreased mortality in trauma patients presenting with hemorrhagic shock and who received MTP (4+ units of pRBC within 1 hour of arrival or >10 units of pRBC transfused at 24 hours of ED arrival). However, prior to 2020, WB administration was not precisely defined in TQIP and researchers relied on ICD10 coding to identify patients who received WB. This inherently prevented researchers from accurately calculating the volume of WB transfusion, and as a consequence, limited our ability to identify a relationship between pRBC/WB ratio and outcomes. Nonetheless, compared with CT alone, adding WB to the resuscitation protocols was associated with a statistically significant decrease in 24-hour mortality, in-hospital mortality, and major complications. In addition, Torres et al. (2023) demonstrated survival benefits of WB extending up to 30 days post-resuscitation.15
Previous studies that evaluated effectiveness of WB resuscitation lacked a direct comparison between WB alone and CT alone. This is understandable as WB supply has been, and still is limited.8,17 As a result, most pre-hospital protocols and trauma centers, with some rare exceptions, have often limited the number of WB units transfused and often continued with CT afterwards. This was especially true in patients who required massive transfusion protocol (MTP). For example, at our academic Level I trauma center, we did not reach a reliable, adequate, and consistent supply of WB for several months after the initiation of our WB resuscitation protocol. Therefore, the currently available studies have only evaluated the additive effect of WB to CT. Naturally, the next question to be explored is whether the observed beneficial effect of WB is diluted when a large volume CT ensued. In the current analysis, we found that the risk of mortality at 24 hours in bleeding trauma patients who underwent hemorrhage control surgery decreased significantly with pRBC/WB ratio of 3:1 or less. It is also important to note that all transfusion ratio groups in our study patients received a balanced blood product resuscitation in addition to WB with a ratio of pRBC/FFP being on average 1:1. Although, platelet transfusion was variable among the groups, it appeared to actually increase with higher pRBC/WB transfusion, while survival diminished. The difference in platelet units transfused could be explained by the “catching-up” approach with large volume transfusions. Yet, the survival benefits of platelet transfusion seem to be more apparent when resuscitation relied primarily on WB, which inherently guarantees platelets transfusion. This
留言 (0)