
記住我


The specialty of acute care surgery originated in response to a need for a surgical provider workforce with expertise in trauma care, emergency general surgery, and surgical critical care.1–3 Twenty percent of inpatient acute care admissions are for traumatic injury or 1 of 16 emergency general surgery diseases.4 This trauma and emergency general surgery disease cohort accounts for $86 billion or 25% of United States inpatient health care spending out of $341 billion annually.4 Hospital admissions for emergency general surgery have steadily increased over the past 20 years and are projected to continue to grow.5 Emergency general surgery operations carry a 30% to 40% increased risk of mortality or morbidity compared with similar general surgery operations in the nonemergent setting after accounting for patient and procedure-associated risk factors.6
Because emergency general surgery is prevalent, is associated with substantial health care expenditures, and has a considerable rate of adverse outcomes, it represents a potential high-yield environment for quality improvement efforts. In fact, emergency general surgery patients cared for at hospitals with lower risk-adjusted trauma mortality have an approximately 33% reduction in mortality risk.7 The construct of a high-performing quality improvement effort relies on many factors. The following four principles have been suggested to build a quality improvement endeavor in emergency general surgery8:
Standardization of emergency general surgery definitions; Ability to conduct an emergency general surgery severity assessment (clinical, anatomic, and imaging) for risk adjustment of outcomes; Creation of an emergency general surgery data registry, which includes operative and nonoperative management; and Standardization of emergency general surgery patient care using evidence-based guidelines and bundles.To address the need for quality improvement in emergency general surgery, we have created an emergency general surgery collaborative centered on these four principles. Based on prior work in regional trauma quality improvement, we propose that inclusion of a collaborative quality initiative (CQI) environment is necessary to optimize the quality improvement infrastructure in addition to following the four principles listed.9 Here, we describe the construct and initial results from an emergency general surgery CQI.
PATIENTS AND METHODSA total of 16 different disease states have been identified to potentially examine emergency general surgery outcomes.10 Unfortunately, attempting to collect data on all of these disease states at once resembles an attempt “to drink the ocean.” However, seven operative procedures (laparotomy, peptic ulcer disease repair, small bowel resection, partial colectomy, lysis of adhesions, cholecystectomy, and appendectomy) account for most operations (80%), deaths (80%), complications (79%), and inpatient costs (80%) attributable to emergency general surgery in the United States per year.11 Given these facts, we focused our emergency general surgery collaborative on four clinical domains: acute appendicitis, acute gallbladder disease, small bowel obstruction, and emergent exploratory laparotomy.
Hospital participants for the Michigan Acute Care Surgery (MACS) CQI were recruited from existing Michigan Trauma Quality Improvement Program (MTQIP) enrolled trauma centers. We began with four hospitals in July 2019 and currently have 10 participant hospitals. Participation is voluntary, and each hospital receives 85% salary and benefits funding from Blue Cross Blue Shield of Michigan/Blue Care Network for a 1.0 full-time equivalent data abstractor. Each hospital is responsible for funding the remaining 15% of the position. Future data abstractor reimbursement will depend on patient volume with a base metric of 85% funding of 1.0 full-time equivalent for 750 cases. The eligibility and expectations for MACS enrollment and participation are detailed in a document provided to all participant hospitals prior to MACS enrollment (Supplemental Digital Content, Supplementary Data 1, https://links.lww.com/TA/D493).
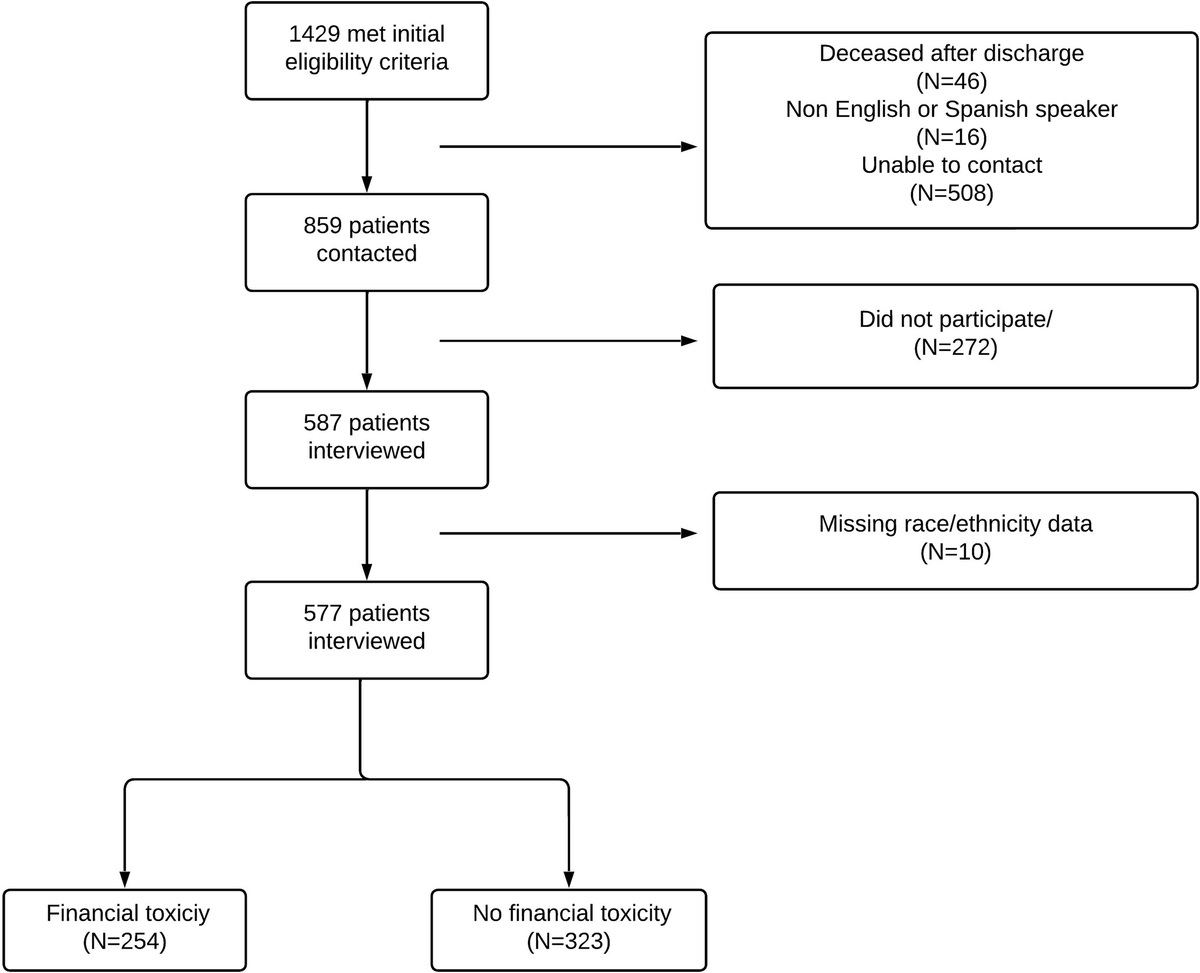
Data Collection and Data DefinitionsThe objective is to screen the daily Acute Care Surgical service “touches” at each MACS hospital to identify patients who meet the criteria for further data entry (Fig. 1). Patients were identified from the initial census records (e.g., consults, admissions, and operative cases). Final data capture was completed after discharge from the hospital. The specific patient diseases or conditions captured for emergency general surgery are the following:
 Figure 1:
 Flowchart describing data capture of ED visits and admission episodes for new and existing emergency general surgery patients.
1. Acute appendicitis 2. Acute gallbladder disease a. Acute cholecystitis b. Choledocholithiasis c. Cholangitis d. Gallstone pancreatitis 3. Small bowel obstruction a. Adhesive b. Hernia c. Malignancy/mass/stricture/other 4. Emergent exploratory laparotomy (including laparoscopic approach)The International Classification of Diseases, Ninth Revision, Clinical Modification codes and algorithms used for MACS inclusion and exclusion criteria are available in a patient selection document (Supplemental Digital Content, Supplementary Data 2, https://links.lww.com/TA/D494). After the daily census for patients admitted to the Acute Care Surgery Service or seen as a consult is screened, other electronic medical record (EMR) and information technology sources may be used for additional patient selection screening. Beyond the recommendations in the patient selection document, each hospital was free to use additional individualized methods for identifying potential patients based upon institution-specific features that may be present. Patients who underwent emergent operative intervention for small bowel obstruction due to a hernia, internal hernia, volvulus, or mass/malignancy etiology were included in the emergent exploratory laparotomy cohort (Supplemental Digital Content, Supplementary Data 3, https://links.lww.com/TA/D495). Patients assigned to the small bowel obstruction cohort received either no operative intervention, an urgent or planned operation after admission, or an emergent operation for obstruction due purely to adhesions.
The first level of data entry, after inclusion and exclusion criteria screening, involves the entry of the patient into the MACS database. This database is constructed using software from the Qualtrics XM Platform. All adult patients (18 years or older) with the identified disease or condition have data entered regardless of whether they received an operation during admission or emergency department (ED) visit. The second level of data entry occurs if an existing MACS patient returns to the hospital (ED visit or admission) or has outcome events identified within the 30-day postoperative time frame if the patient had surgery or within 30 days from discharge for the nonoperative patients. Data collection did not involve contacting patients and only used information that was part of the treating institutions medical record system. In addition to demographic, comorbid conditions, and outcomes data, information is captured on diagnostic and therapeutic interventions (e.g., endoscopic retrograde cholangiopancreatography), including radiologic studies, interventional procedures (e.g., percutaneous drain placement), types of operative repairs, and nonoperative management details.
Disease severity reporting is performed by reviewing clinical, anatomic, and imaging information in the EMR and using the American Association for the Surgery of Trauma (AAST) grading system specifically designed for emergency general surgery diseases.12 The AAST grading scale assigns a value from 1 to 5 based on increasing severity of disease. This value represents a measurement of inflammation and degree of peritonitis present for the specific condition. The AAST grading scale has been validated for the two disease cohorts, acute appendicitis and acute cholecystitis, in which we are employing data capture.13–15 The AAST grades were assigned during data abstraction and were not available or assigned during the patient’s hospitalization.
A MACS data definitions manual has been created and is updated annually (https://www.mtqip.org/resources/macs). Most of the data definitions are based upon existing standards in already available national sources (American College of Surgeons [ACS] National Surgical Quality Improvement Program [NSQIP], ACS Trauma Quality Improvement Program, Centers for Disease Control) and regionally (MTQIP, Michigan Surgical Quality Collaborative [MSQC]). Disease-specific data elements were created to capture studies performed, all operative interventions, interventional procedures, disease-specific outcomes, and nonoperative management. This is in addition to commonly found data elements in existing quality improvement platforms. Data validation visits are conducted annually, using a methodology like what has been published for trauma, with feedback provided to participants.16
ReportingHardcopy reports are created and distributed to each participant hospital every 4 months in conjunction with in-person meetings (Supplemental Digital Content, Supplementary Data 4, https://links.lww.com/TA/D496). The information includes a program summary of all patients. There are also disease-specific reports on acute appendicitis, acute gallbladder disease, small bowel obstruction, and exploratory laparotomy. Participant hospital data is compared with the collaborative in table and graphical form. Morbidity is reported as a composite that includes any incidence of a complication or mortality recorded in the index or subsequent readmission records.
Data AnalysisMultivariable generalized linear regression models were constructed for mortality, complications, and all other reported outcomes. For binary outcomes, a logit link function was used, and for continuous outcomes, a normal distribution was used. A stepwise selection process was used, to create a parsimonious multivariable model for each primary outcome while controlling for relevant candidate confounders, like demographics, disease factors, comorbid conditions, and hospital processes. If a model did not converge using the full selected model, a smaller model was tested using basic demographic variables. Most models converged using the full model. However, some outcomes were extremely rare; moreover, there was insufficient power to include many variables. We included AAST grade in the multivariable model(s) for acute appendicitis and acute gallbladder outcomes. Categorical variables being considered for use in modeling had a category of missing/not classed/not graded created to avoid the exclusion of patients in the analysis.
Results are expressed as risk-adjusted rates along with 95% confidence intervals. Risk-adjusted rates were calculated by adding the residual for each site (observed rate minus expected rate) to the overall observed rate. To compare sites to the collaborative, we calculated Z tests for binary outcomes and t tests for continuous outcomes. A p value of <0.05 was used as the threshold for statistical significance, and all reported p values were two-sided. If the p value was significant, and the center rate was less than the collaborative rate, the center was reported as a low-outlier. If the p value was significant and the center rate was more than the collaborative rate, the center was reported as a high outlier.
All statistical analyses were performed in Stata 15.0 (StataCorp, College Station, TX) or SAS 9.4 (SAS Institute, Inc., Cary, NC). Institutional review board approval was obtained for this study, and it was deemed exempt as it relied on the secondary use of already collected data. The SQUIRE 2.0 guideline was used to ensure proper reporting of methods, results, and discussion for a quality improvement study (Supplemental Digital Content, Supplementary Data 5, https://links.lww.com/TA/D497).17
RESULTSMichigan Acute Care Surgery CQI data collection included a total of 19,956 emergency general surgery patients. Of these, 56.8% were female, 82.8% were White, and the mean (SD) age was 53.3 (20.8) years (Table 1). A total of 3,013 patients (15.1%) had one or more readmission events. The prevalence of the top 15 diagnosis codes and operations performed during index admission are detailed in Table 2. Of all patients, 12.9% were transferred to a collaborative hospital after being seen in a referring hospital ED or being admitted to an outside hospital before transfer. Within the collaborative, 15,382 patients (77%) underwent operative intervention during their index admission.
TABLE 1 - Patient Characteristics A. Overall Patient Characteristic Management Cohort Aggregate Operative Nonoperative Cases, n 19,956 15,382 4,574 By disease, n (%) Acute appendicitis 5,325 (26.7) 4,605 (29.9) 720 (15.7) Acute gallbladder disease 8,681 (43.5) 7,322 (47.6) 1,359 (29.7) Small bowel obstruction 3,856 (19.3) 1,361 (8.9) 2,495 (54.6) Exploratory laparotomy 2,094 (10.5) 2,094 (13.6) 0 (0.0) Point of patient entry, n (%) ED 15,627 (78.3) 12,168 (79.1) 3,459 (75.6) Transfer from outside hospital ED 2,141 (10.7) 1,500 (9.8) 641 (14.0) Transfer from outside hospital 438 (2.2) 319 (2.1) 119 (2.6) ED only/not admitted 194 (1.0) 0 (0.0) 194 (4.2) Home/direct admit 1,428 (7.2) 1,294 (8.4) 134 (2.9) Other 128 (0.6) 101 (0.7) 27 (0.6) Payment, n (%) Private/other government 8,003 (40.1) 6,672 (43.4) 1,331 (29.1) Medicaid 2,657 (13.3) 2,189 (14.2) 468 (10.2) Medicare 5,842 (29.3) 3,912 (25.4) 1,930 (42.2) Uninsured/self-pay 387 (1.9) 338 (2.2) 49 (1.1) Missing 3,059 (15.3) 2,263 (14.7) 796 (17.4) Age, mean (SD), y 53.3 (20.8) 50.9 (20.8) 61.3 (18.6) Race, n (%) White 16,520 (82.8) 12,684 (82.5) 3,836 (83.9) Black 1,891 (9.5) 1,440 (9.4) 451 (9.9) Other 1,545 (7.7) 1,258 (8.2) 287 (6.3) Sex, n (%) Female 11,336 (56.8) 9,019 (58.6) 2,317 (50.7) Male 8,614 (43.2) 6,357 (41.3) 2,257 (49.3) Height, cm Mean (SD) 169 (10.7) 169 (10.6) 170 (10.8) Median (IQR) 168 (162–178) 168 (161–178) 170 (163–178) Weight, kg Mean (SD) 87 (24.8) 88 (25) 84.9 (26.2) Median (IQR) 84 (70–100) 84 (71–101) 81 (67–98) Body mass index Mean (SD) 30 (8.3) 31 (8.1) 30 (8.6) Median (IQR) 29 (25–35) 30 (25–35) 28 (24–33) Comorbid Conditions, n (%) Ascites 201 (1.2) 121 (0.9) 80 (2.1) CHF within 30 d 241 (1.4) 135 (1.0) 106 (2.8) COPD 724 (4.3) 463 (3.5) 261 (6.9) COVID-19 1,326 (7.8) 967 (7.4) 359 (9.5) Current cancer/malignancy 1,033 (6.1) 599 (4.6) 434 (11.5) Diabetes mellitus 2,357 (11.8) 1,631 (10.6) 726 (15.9) Dialysis within 2 wk 209 (1.2) 135 (1.0) 74 (2.0) Disseminated cancer 425 (2.5) 227 (1.7) 198 (5.2) Hypertension 6,318 (37.4) 4,484 (34.2) 1,834 (48.6) Functional health status—dependent 689 (4.1) 410 (3.1) 279 (7.4) History of DVT/PE 1,121 (6.6) 733 (5.6) 388 (10.3) Pregnancy 81 (0.4) 68 (0.4) 13 (0.3) Sepsis 2,977 (17.6) 2,451 (18.7) 526 (13.9) Severe sepsis/septic shock 1,385 (8.2) 1,042 (7.9) 343 (9.1) Sleep apnea 3,546 (21.0) 2,530 (19.3) 1,016 (26.9) Solid organ transplant 111 (0.8) 70 (0.6) 41 (1.2) Steroid or immunosuppressive Rx 1,017 (6.0) 597 (4.6) 420 (11.1) Tobacco within 1 y — cigarette 2,562 (15.2) 2,033 (15.5) 529 (14.0) Ventilator dependent within 48 h 283 (1.7) 220 (1.7) 63 (1.7) B. By Disease Patient Characteristic Appendicitis Gallbladder Small Bowel Exploratory Laparotomy Operative Nonoperative Operative Nonoperative Operative Nonoperative Cases, n 4,605 720 7,322 1,359 1,361 2,495 2,094 Point of patient entry, n (%) ED 4,199 (91.2) 572 (79.4) 5,450 (74.4) 861 (63.4) 1,085 (79.7) 2,026 (81.2) 1,434 (68.5) Transfer from outside hospital ED 151 (3.3) 80 (11.1) 807 (11.0) 256 (18.8) 151 (11.1) 305 (12.2) 391 (18.7) Transfer from outside hospital 11 (0.2) 7 (1.0) 138 (1.9) 67 (4.9) 45 (3.3) 45 (1.8) 125 (6.0) ED only/not admitted 0 (0.0) 44 (6.1) 0 (0.0) 99 (7.3) 0 (0.0) 51 (2.0) 0 (0.0) Home/direct admit 211 (4.6) 9 (1.3) 874 (11.9) 63 (4.6) 77 (5.7) 62 (2.5) 132 (6.3) Other 33 (0.7) 8 (1.1) 53 (0.7) 13 (1.0) 3 (0.2) 6 (0.2) 12 (0.6) Payment, n (%) Private/other government 2,648 (57.6) 335 (46.5) 3,098 (42.3) 336 (24.7) 298 (21.9) 660 (26.5) 628 (30.0) Medicaid 598 (13.0) 90 (12.5) 1,162 (15.9) 163 (12.0) 141 (10.4) 215 (8.6) 288 (13.8) Medicare 447 (9.7) 146 (20.3) 1,729 (23.6) 665 (48.9) 589 (43.3) 1,119 (44.8) 1,147 (54.8) Uninsured/self-pay 140 (3.0) 15 (2.1) 152 (2.1) 13 (1.0) 16 (1.2) 21 (0.8) 30 (1.4) Missing 768 (16.7) 134 (18.6) 1,178 (16.1) 182 (13.4) 316 (23.2) 480 (19.2) 1 (0.0) Age, mean (SD), y 40.7 (21.7) 48.9 (18.8) 51.3 (18.7) 64.0 (19.5) 64.4 (16.4) 63.4 (16.4) 62.9 (15.8) Race, n (%) White 3,810 (82.7) 570 (79.2) 6,021 (82.2) 1,148 (84.5) 1,088 (79.9) 2,118 (84.9) 1,765 (84.3) Black 326 (7.1) 73 (10.1) 691 (9.4) 130 (9.6) 208 (15.3) 248 (9.9) 215 (10.3) Other 469 (10.2) 77 (10.7) 610 (8.3) 81 (6.0) 65 (4.8) 129 (5.2) 114 (5.4) Sex, n (%) Female 2,429 (52.7) 358 (49.7) 4,715 (64.4) 667 (49.1) 764 (56.1) 1,292 (51.8) 1,111 (53.1) Male 2,175 (47.2) 362 (50.3) 2,604 (35.6) 692 (50.9) 596 (43.8) 1,203 (48.2) 982 (46.9) Height, cm Mean (SD) 170.5 (10.5) 170.7 (10.4) 168.3 (10.4) 169.7 (11.0) 168.9 (11.1) 169.1 (10.7) 169.1 (11.1) Median (IQR) 170. (163–177) 170 (163–179) 168 (160–175) 170 (163–178) 168 (160–178) 170 (160–178) 168 (160–178) Weight, kg Mean (SD) 85.1 (22.5) 85.1 (25.6) 91.7 (23.7) 88.1 (27.6) 82.0 (27.2) 83.0 (25.3) 83.3 (25.9) Median (IQR) 81.7 (69–97.5) 80.6 (67.7–97) 88.85 (75.3–105) 83.6 (70.2–101) 77.7 (63.5–95) 79.3 (64.9–97) 79.2 (64.9–97.5) Body mass index Mean (SD) 29.3 (7.5) 29.1 (8.6) 32.3 (7.8) 30.5 (8.8) 28.7 (9.0) 28.9 (8.3) 29.1 (8.7) Median (IQR) 28.1 (24.1–32.8) 27.4 (23.6–32.3) 31.1 (27.0–36.5) 29.1 (24.9–34.1) 26.5 (22.9–32.7) 27.4 (23.1–33.1) 27.7 (23.3–33.1) Comorbid condition, n (%) Ascites 3 (0.1) 2 (0.3) 12 (0.2) 28 (2.4) 29 (2.8) 50 (2.5) 77 (3.7) CHF within 30 d 9 (0.2) 6 (1.0) 45 (0.7) 65 (5.5) 17 (1.6) 35 (1.7) 64 (3.1) COPD 48 (1.3) 11 (1.9) 147 (2.4) 114 (9.7) 87 (8.3) 136 (6.7) 181 (8.6) COVID-19 286 (7.5) 72 (12.3) 430 (7.0) 126 (10.7) 67 (6.4) 161 (8.0) 184 (8.8) Current cancer/malignancy 73 (1.9) 34 (5.8) 144 (2.3) 145 (12.3) 94 (9.0) 255 (1
留言 (0)