
記住我


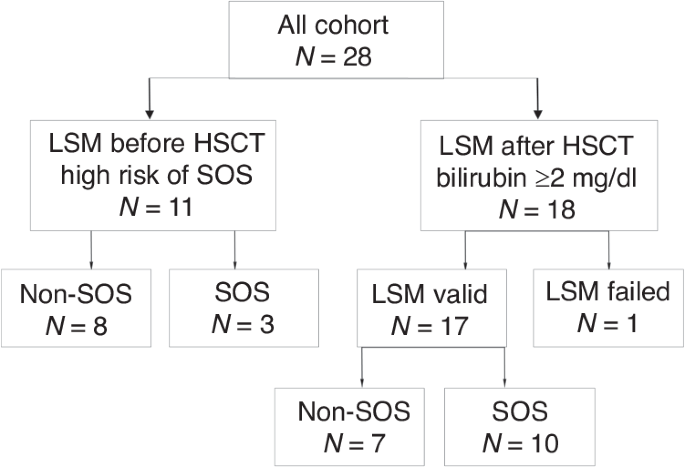


Eleven patients at high risk of developing SOS were evaluated before HSCT. The clinical and demographic characteristics of these patients are presented in Table 1. The median age at the time of transplantation was 43 years (IQR, 37–60) and 45.5% of the patients were male.
Table 1 Baseline demographic and clinical characteristics of patients assessed before HSCT because of high-risk for development SOS.Out of the 11 patients, 7 had AML, that was secondary or treatment-related in 4. The remaining four patients had myelofibrosis. Before undergoing HSCT, 5 out of the 7 AML patients received chemotherapy, with a median of 4 lines of treatment (ranging from 2 to 5). Two out of the seven patients with secondary AML received a azacytidine (vidaza) and venetoclax regimen, and all 4 of the myelofibrosis patients received ruxolitinib. Two patients, 1 from the venetoclax regimen group and 1 from the ruxolitinib group received chemotherapy for a previous malignancy. The donors were sibling, matched-unrelated, and haploidentical for 5, 2, and 4 patients, respectively.
There were several risk factors for developing severe hepatic SOS. These included being over the age of 60, having severe obesity, active illness, undergoing multiple rounds of chemotherapy, and having pre-existing liver disease. The liver-related SOS risk factors included nonalcoholic steatohepatitis cirrhosis without portal hypertension in one patient, splenomegaly in five patients, portal hypertension with esophageal varices in one patient, alcohol abuse in one patient, and baseline liver enzyme elevation in two patients (one with secondary hemochromatosis and the other experiencing severe liver toxicity after previous treatment).
As for the donor and conditioning, two patients had HLA-mismatched and four patients had Haplo-HSCT donors. Four, one, and five patients received MAC, TBI-based, and DAC regimens, respectively.
Five patients received MTX for GVHD prophylaxis. It is worth noting that most patients had multiple factors that put them at risk for SOS, with a median of 5 factors (ranging from 3 to 8).
Out of 11 patients, 6 changed the planned conditioning regimen protocols after LSM indicated a value of >7.0 kPa. The changes included switching from BU to Treosulfan for 3 patients, implementing an alternative protocol to DAC (our routine for myelofibrosis and for haploidentical transplants) for 3 patients, using RIC instead of MAC for 4 patients, and not using MTX for GVHD prophylaxis for 2 patients. One patient received Defibrotide prophylaxis.
Three of 11 patients (27.3%) developed SOS. Two patients developed mild to moderate SOS, while one had severe SOS. The last patient died despite immediate defibrotide treatment.
One of these three patients did not have protocol modified while developing moderate SOS. The LSM levels were 10.1 kPa (IQR, 4.9–11.6) for patients who did not develop SOS, while those who did had LSM levels of 7.4 kPa (IQR, 7.0–22.5). There were no factors that could predict the occurrence of an SOS. However, none of the patients from the high-risk group with an LSM less than 7 kPa developed SOS.
LSM after HSCT for assessment of SOSSeventeen patients underwent LSM after their bilirubin levels exceeded 2 mg/dl. The clinical and demographic characteristics of these patients are presented in Table 2. The median age at the time of transplantation was 49 years (IQR, 34–62), and 59% of the patients were male. Ten of these patients were diagnosed with SOS based on EBMT criteria. The LSM was conducted when the bilirubin level increased above 2 mg/dl, regardless of the presence of any other signs of SOS. Out of the 17 patients whose bilirubin level exceeded 2 mg/dl, 7 (41%) had causes of bilirubin elevation other than SOS. Bilirubin elevation in the remaining cases was due to sepsis (n = 5) or drug-induced liver injury (n = 2). However, due to the small sample size, no statistical differences were found between patients who developed SOS and those who did not. The LSM was performed at a median time of 8.5 days (IQR, 4.25–12.5 days, ranges 1–36 days) after HSCT and 0 days (IQR, 0–1 days, ranges 0–7 days) after bilirubin elevation above 2 mg/dl.
Table 2 Baseline demographic and clinical characteristics of patients with bilirubin elevation above 2 mg/dl after allo-HSCT.Patients who developed SOS experienced a higher frequency of abdominal pain, hepatomegaly, ascites, weight gain, and oliguria than those who did not (Table 3). ALT elevation was observed in patients with and without SOS.
Table 3 Clinical and laboratory characteristics of patients with and without SOS after HSCT.Patients who developed SOS had a significantly higher LSM compared to those who did not. The LSM levels were 5.9 kPa (IQR, 4.9–7.4) for patients without SOS and 10.7 kPa (IQR, 7.5–25.2) for patients with SOS (p = 0.007) (Fig. 2a).
Fig. 2: Comparison of liver stiffness measurements (LSM) in patients with and without sinusoidal obstruction syndrome (SOS).
a Scatter plots displaying the median with interquartile range of LSM values of SOS and non-SOS group, b Scatter plots displaying the median with interquartile range of LSM values according to severity of SOS, c Regression plot of the Spearman rank correlation between LSM value and SOS diagnosis after HSCT, d ROC curve analysis of LSM and prediction of SOS diagnosis after HSCT, e Scatter plots displaying the median with interquartile range of LSM values of died and survived patients.
We categorized the LSM based on the severity of SOS. As the severity of SOS increased, the median LSM value also increased. For mild, moderate, severe, and very severe cases of SOS, the LSM values were 8.5, 14.75, 19.25, and 17.95 kPa, respectively. However, due to the small sample size, the numbers did not show significant statistical differences (Fig. 2b).
There was a positive correlation between the diagnosis of SOS and LSM levels, with a correlation coefficient of 0.66 (p = 0.007) as determined by the Spearman correlation test (Fig. 2c). The LSM can diagnose SOS with an AUC of 0.89 (p = 0.008) (Fig. 2d). The cut-off value for SOS diagnosis is 7.5 kPa, with sensitivity 80% and specificity 86%.
During a follow-up of 203 days (IQR, 37–521 days), six patients died. Four patients (40%) died in the SOS group, while two (28.6%) died in the non-SOS group. In the SOS group, only one patient died due to extremely severe SOS with multi-organ failure. Other causes of death included disease progression (two patients), GVHD with severe sepsis, and multi-organ failure (one patient). In the non-SOS group, one patient died due to GVHD with sepsis due to a fungal infection, while the other died due to disease progression.
The median LSM was higher in patients who died compared to those who survived after HSCT in the SOS group (19.9 kPa (IQR, 8.1–30.7) vs. 9.7 kPa (IQR, 7.1–20.7), respectively). However, this difference did not reach statistical significance due to the small sample size. In patients from the non-SOS group, there was no difference in LSM between those who died and those who survived (5.4 kPa (IQR, 4.9–5.9 vs 6.9 kPa (IQR, 5.1–7.8), respectively) (refer to Fig. 2e).
留言 (0)