
記住我


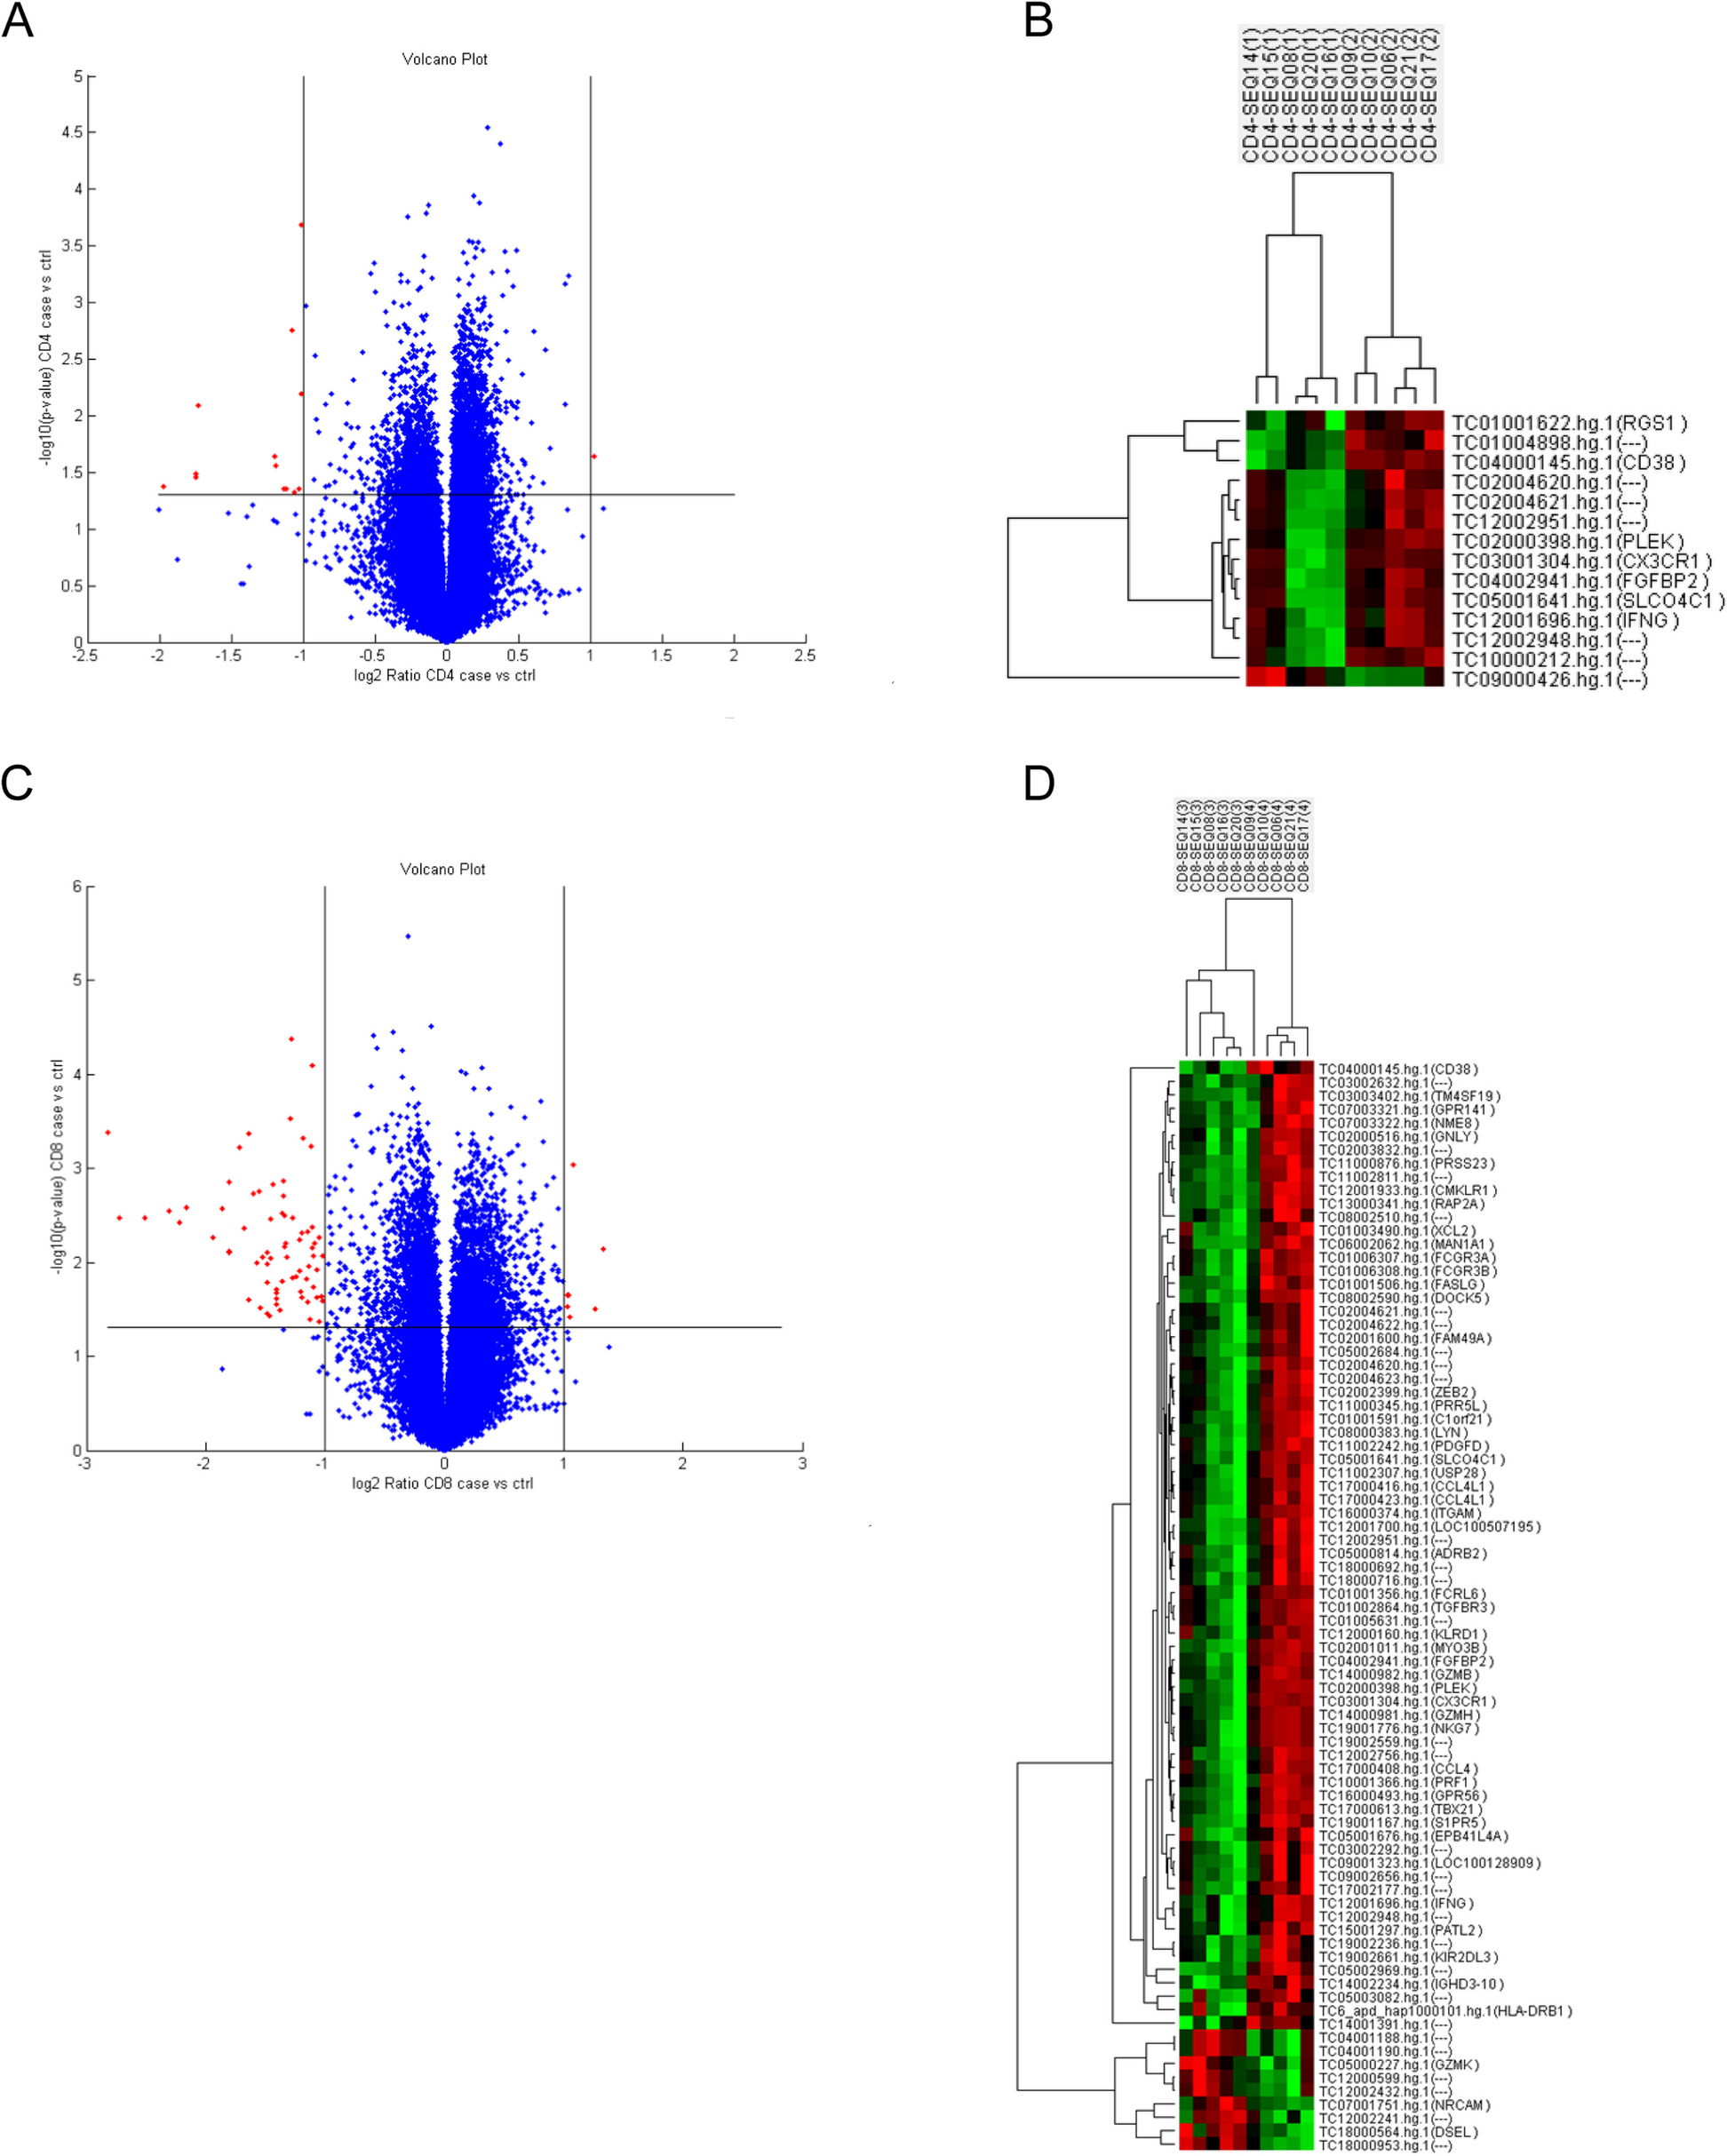


Ten sorted CD4 + T cell and CD8 + T cell specimens from five SLE patients with ESRD (two for 4 years and three for 12 years more) and five patients without LN in the disease course were sent for microarray transcriptomes analysis. The expression levels on CD4 and CD8 T cells were used to execute a hierarchical clustering analysis of T cells. The Volcano plots and hierarchical clustering heat map revealed that LN with ESRD and SLE without LN phenotypes clustered significantly different gene expression levels. The volcano plot and heatmap of the most altered genes, as depicted in Fig. 1, several critical unappreciated heterogeneity immune response genes that revealed a distinctive gene signature profile related to T cells differentiation, activation, and cytotoxicity on CD4 and CD8 T cells. In SLE with ESRD patients, CD38, PLEK (platelet and leukocyte C kinase substrate and the KSTR sequence of amino acids), interferon-γ, CX3CR1, fibroblast growth factor binding protein type 2 (FGFBP2), and solute carrier organic anion transporter family member 4C1 (SLCO4C1) were significantly downregulated on CD4 and CD8 T cells simultaneously. Fc receptor-like 6 (FCRL6), granzyme B (GZMB), GZMH, FcγR3A/3B, integrin subunit alpha M (ITGAM), FAS ligand, TBX21 (T-box transcription factors; also known as T-bet), LYN (Lck/Yes Novel tyrosine kinase, Src kinase family), granulysin, C–C motif chemokine ligand 4 like 1 (CCL4L1), chemerin chemokine-like receptor 1 (CMKLR1), HLA-DRβ1, KIR2DL3 and killer cell lectin like receptor D1 (CD94) transcripts were downregulated, whereas GZMK, NRCAM (Neuronal cell adhesion molecule) and DSEL (dermatan sulfate epimerase like) were upregulated in CD8 T cells. Pathway enrichment analysis of CD8 T cells revealed that Chemokine and cell migration were critical on BP (Fig. 2A), cytolytic granule on CC (Fig. 2B), Ig binding and platelet derived growth factor receptor binding on MP (Fig. 2C) and graft versus host disease on KEGG were associated with the majority of genes and fold changes (Fig. 2D). PPI network analysis uncovered the functional interdependence of these crucial pathways (Fig. 2E). As depicted in the Supplemental Figures, the gene list best defining the pathways suggests that the NK cytotoxicity signature (KIR2DL3, CD94, FcγR, perforin, granzyme and Fas/Fas ligand induced apoptosis), graft versus host disease (MHC class II antigen processing and type I interferon and host target tissue injury), and chemokine-cytokine interaction (CCL4 and CX3CR1) significant influence the pathogenesis of advanced LN. Collectively, the aforementioned molecules are responsible for the phenomenon of inflammatory senescence commonly observed in repeatedly activated T cells, resulting in a substantial reduction of CD8 T cell cytotoxicity in LN patients with ESRD.
Fig. 1
Differential expressed genes (DEGs) in SLE patients with ESRD (14, 15, 08, 20,16) and inactive SLE controls (09, 16, 06, 21, 17) (A) Volcano of the DEGs of CD4 T cells. B Heatmap of the CD4 T cells DEGs in SLE patients with ESRD and inactive SLE controls. C Volcano of the DEGs of CD8 T cells. D Heatmap of the 52 DEGs in SLE patients with ESRD and inactive SLE controls
Fig. 2
Pathway enrichment analysis of CD8 T cells based on in-depth analyses of our DEGs (A) Chemokine mediated signal pathway and cell migration on biological process (BP) (B) Cytolytic granule on cellular component (CC) (C) Ig binding, platelet derived growth factor receptor binding and chemokine activity on molecular function (MF) (D) graft versus host disease on KEGG (E) The protein–protein interaction was obtained from the STRING database showed cytotoxicity signature, antigen presentation and chemokine-cytokine interaction influence the pathogenesis of advanced LN
GZMB and GZMK expressing CD8 + T cells impact on SLE and clinical outcomeIn order to gain greater comprehension of GZMK expression in SLE, we compared GZMK-expressing CD8 + T cells from normal controls, SLE with and without LN. As shown in Table 1, there was no significant difference observed in the percentage and MFI expression of CD45RA-CD197-CD8 + GZMK + T cells between SLE patients and normal controls (20.32 ± 1.872%, (N = 38) vs. 19.96 ± 1.685% (N = 25), p = 0.895; MFI: 3546 ± 273.9 (N = 38) vs. 3526 ± 192 (N = 25), p = 0.9589). Yet, compared to normal controls, the proportion of CD45RA- CD103-CD8 + KLRB(CD161) + GZMK + Mucosal-associated invariant T (MAIT) cells decreased in SLE patients (6.200 ± 1.103%, (N = 25) vs. 1.158 ± 0.2279%, (N = 38), p = < 0.0001; MFI: 3709 ± 197.6 (N = 38) vs. 4323 ± 329.3 (N = 25), p = 0.9589). The observation of a notable decrease in the quantity of CD8 + CD161 + GZMK + MAIT cells indicates that a segment of these cells may have escaped the bloodstream by migrating to inflamed tissues.
Table 1 Expression distribution of CD161 and GZMK on CD8 T cells in SLE, LN + , LN- and normalTo determine the impact of GZMB and GZMK-expressing CD8 + T cells on ESRD, the expression levels of GZMB and GZMK on CD8 T cells from LN with ESRD, healthy controls, and SLE were compared. Table 2 presented that SLE patients possess a surge in CD45RA-CD197-8 + GZMB + CD8 T cells (9.320 ± 1.169%, (N = 25) vs. 26.32 ± 2.474%, (N = 38), p = < 0.0001), CD45RA-CD8 + CD103-CD161- GZMK + T cells (4.207 ± 0.6274%, (N = 25) vs. 6.989 ± 1.461%, (N = 38), p = 0.1432), and CD45RA-CD8 + CD103-CD161- GZMK + GZMB + T cells (1.874 ± 0.2710%, (N = 25) vs. 6.989 ± 1.461%, (N = 38), p = 0.0365) than healthy controls. It is noteworthy that ESRD patients exhibited greatly greater of CD45RA-CD8 + CD103-CD161- GZMK + T cells (1.874 ± 0.2710%, (N = 25) vs. 11.29 ± 4.934%, (N = 5), p = 0.0082), and CD45RA-CD8 + CD103-CD161- GZMK + GZMB + T cell (1.874 ± 0.2710%, (N = 25) vs. 7.846 ± 4.233%, (N = 5), p = 0.0033) were detected. Additionally, ESRD patients have a slightly higher quantity of CD45RA-CD8 + CD103-CD161 + GZMK + T MAIT cells than other SLE patients (2.070 ± 1.18 (N = 5) vs. 1.234 ± 0.2120 (N = 38)). Therefore, a diversity of GZMK + CD8 T cells may be responsible for an upsurge in GZMK expression in ESRD patients comparing to other SLE patients. Following this, the expression of Co-IRs (TIGIT, PD-1, and TIM3) on CD8 + cells was correlated with that of CD8 + cells expressing GZMK and GZMB. Figure 3 showed that there was a moderate negative correlation between the expressions of CD8 + TIGIT + T cells with CD45RA-CD8 + CD103-CD161- GZMK + T cells (r = -0.5806; p = 0.0001) and CD45RA- CD8 + CD103-CD161-GZMK + GZMB + CD8 T cells (r = -0.5953; p = < 0.0001). Nevertheless, additional longitudinal research is necessary in order to ascertain the serial long-term effects.
Table 2 Expression distribution of CD8 T cells for CD161, GZMB, and GZMK in SLE, ESRD and normalFig. 3
The performance of Co-IRs expression on CD8 T cell correlation with varied CD8 + T cell expressing GZMK and GZMB. The p values are represented as follows: *P < 0.05, **P < 0.01, ***P < 0.001, ****P < 0.0001, NS no significance (P ≥ 0.05)
Co-IRs expressions of T cell activation and exhaustion between SLE and healthy controlsThe functionality of T cells is strictly controlled by an abundance of immune modulating signals from immunological inhibition and activation surface molecules, that include HLA-DR, CD38, inducible costimulatory molecule (ICOS), TIGIT, PD-1 and T cell immunoglobulin, and mucin domain-containing protein 3 (TIM3). In addition to upregulating PD-1, exhausted T cells lose the capacity to differentiate into memory cells, as indicated by the expression of the interleukin-7 receptor (IL-7R; CD127). On CD4 + and CD8 + T cells, we evaluate the frequency and intensity of T cell activation (CD38 and HLA-DR) and several Co-IRs, including TIGIT, PD-1, CD127, CD160, signaling lymphocytic activation molecule family member 4 (SLAMF4; CD244; 2B4) and TIM3 expression. Table 3 showed that the percentages of CD279 (8.027 ± 0.7983%, (N = 91) vs. 3.93 ± 0.7035%, (N = 27), p = 0.008) and TIGIT (25.67 ± 1.119%, (N = 90) vs. 20.13 ± 0.8377% (N = 26), p = 0.0109) expressions on CD4+ T cells were expanded in SLE patient. In contrast, CD127 expression on CD4 + T cells was reduced in SLE patients compared to HC (33.85 ± 2.343%, (N = 90) vs. 44.59 ± 5.149% (N = 27), p = 0.0382; MFI: 394.1 ± 6.585 vs. 421.3 ± 12.36, p = 0.0439). Also, TIM3 (12.56 ± 0.9711%, (N = 91) vs. 9.826 ± 1.19% (N = 27), p = 0.1534; MFI: 444.3 ± 7.502 vs. 384.9 ± 12.23, p = 0.0002), TIGIT (35.06 ± 1.65%, (N = 90) vs. 25.81 ± 1.774% (N = 27), p = 0.0042) and HLA-DR (46.74 ± 2.319% (N = 51) vs. 18.6 ± 1.909% (N = 17), p < 0.0001; MFI: 740.2 ± 31.93 vs. 547.2 ± 24.81, p = 0.0013) expression on CD8+ T cells were higher in patients with SLE. In contrast, CD127 expression on CD8 + T cells was reduced in SLE patients compared to HC (22.46 ± 1.752%, (N = 90) vs. 40.86 ± 4.19% (N = 27), p < 0.0001; MFI: 360.8 ± 7.882 vs. 421 ± 14.87, p = 0.0003). CD160 expression on CD3 + T cells was higher in SLE patients compared to HC (16.92 ± 1.199, (N = 91) vs. 10.93 ± 1.137, (N = 27) p = 0.0101). However, CD160 MFI expression on CD8 + T cells was lower in SLE patients compared to HC (MFI: 717.8 ± 14.43, (N = 86) vs. 791.4 ± 21.65, (N = 26) p = 0.0121). As shown in Table 4, CD8 + CD279 + TIM3 + (0.5922 ± 0.09517, (N = 90) vs. 0.08077 ± 0.01666, (N = 26), p = 0.0048) and CD8 + HLA-DR + CD38 + (13.75 ± 1.162 (N = 87), vs. 4.519 ± 0.8416 (N = 27), p < 0.0001) T cells were higher in patients with SLE.
Table 3 CD4 and CD8 T cell expression of cell single activation and Co-IRs in SLE and normalTable 4 CD4 and CD8 T cell expression of cell double activation and Co-IRs in SLE and normalCo-IRs expression on T cell correlated to SLE clinical disease parametersWe next determined several Co-IRs and activation markers including TIGIT, PD1, TIM3, CD160, HLA-DR, CD38 and CD127 expression on CD3+/CD4+/CD8+ T cells and analyzed the performance of their correlation with a series of clinical manifestations, disease activity and laboratory features including presence of nephritis (proteinuria < 0.5gm vs. > 0.5gm), decreased complement component 3 (C3) and/or complement component 4 (C4), disease activity (SLEDAI > 6) and ds-DNA antibody production. Figure 4A to E showed SLE patients with nephritis exhibited higher frequencies of CD4+ T cells expressing PD1, CTLA4, TIM3, CD127 and TIGIT [CD4 + CD279 + (6.162 ± 0.6218%, (N = 65) vs. 10.57 ± 1.938%, (N = 23), p = 0.0056); CD4 + CTLA4 + (0.1545 ± 0.04463%, (N = 66) vs. 0.5565 ± 0.1915%, (N = 23), p = 0.0038); CD4 + TIM3 + (3.279 ± 0.4234%, (N = 66) vs. 7.378 ± 1.095%, (N = 23), p < 0.0001); CD4 + CD127 + (28.55 ± 2.72%, (N = 67) vs. 49.3 ± 2.767%, (N = 23), p < 0.0001); CD4 + TIGIT + (24.13 ± 1.297%, (N = 67) vs. 30.14 ± 1.978%, (N = 23), p = 0.0184)]. CD8+ T cells (Fig. 4F to K) express higher TIM3, CTLA4, CD127, TIGIT, CD160 and CD244 [CD8 + TIM3 + (10.59 ± 1.041%, (N = 68) vs. 18.38 ± 1.858%, (N = 23), p = 0.0003); CD8 + CTLA4 + (0.1538 ± 0.0323%, (N = 65) vs. 0.313 ± 0.04415%, (N = 23), p = 0.0099); CD8 + CD127 + (19.94 ± 2.074%, (N = 67) vs. 29.82 ± 2.773%, (N = 23), p = 0.013); CD8 + TIGIT + (31.86 ± 1.76%, (N = 67) vs. 44.38 ± 3.271%, (N = 23), p = 0.0007); CD8 + CD160 + (31.2 ± 1.77%, (N = 66) vs. 40.82 ± 2.944%, (N = 23), p = 0.0068); CD8 + CD244 + (1.025 ± 0.2473%, (N = 65) vs. 2.523 ± 0.7825%, (N = 22), p = 0.0178)]. SLE patients with high disease activity (SLEDAI < 6 vs. SLEDAI ≥ 6) have expanded cell numbers of CD3 + CD160 + (14.32 ± 1.012%, (N = 64) vs 22.22 ± 3.09%, (N = 23), p = 0.0022). SLE patients with C3 depression have significant higher expression cells number (%) of CD4 + CD279 + (7.109 ± 0.8234%, (N = 69) vs 10.91 ± 1.973%, (N = 22), p = 0.0408) and CD3 + CD279 + (5.245 ± 0.5207%, (N = 66) vs 9.191 ± 1.728%, (N = 22), p = 0.0041). C4 depression showed lower expression of CD4 + CTLA4 + % (0.1681 ± 0.03076, (N = 72) vs. 0.4125 ± 0.1793, (N = 16), p = 0.023 and CD8 + LAG3 + (0.23 ± 0.04366, (N = 70) vs. 0.5063 ± 0.134, (N = 16), p = 0.0149). SLE patients with positive dsDNA demonstrated higher expression cells number (%) of CD4 + CD279 + (5.516 ± 0.6812%, (N = 49) vs 9.756 ± 1.44%, (N = 32), p = 0.0041). The detail of Co-IRs and activation markers correlation with a series of clinical manifestations, disease activity and laboratory features were listed in Supplemental Tables 2 , 3, 4, 5 and 6.
Fig. 4
The performance of Co-IRs expression on T cell correlation with a series of clinical manifestations, disease activity and laboratory features including presence of nephritis (proteinuria < 0.5gm vs. > 0.5gm), decreased complement component 3 (C3) and/or complement component 4 (C4), disease activity (SLEDAI > 6) and ds-DNA antibody production. The p values presentation as above Fig. 3
Regarding two Co-IRs analysis, Fig. 5A to E demonstrated nephritis patients exhibited a statistically significant increase in the cell numbers of CD4 + CD279 + TIM3 + (0.5075 ± 0.09351%, (N = 67) vs. 1.127 ± 0.2388%, (N = 22), p = 0.0045); CD4 + CD127 + TIGIT + (3.634 ± 0.4631%, (N = 67) vs. 5.587 ± 0.6844%, (N = 23), p = 0.0303); CD8 + HLA-DR + CD127 + (1.322 ± 0.1797%, (N = 46) vs. 5.183 ± 1.346%, (N = 6), p < 0.0001); CD8 + HLA-DR + CD38 + (11.23 ± 0.9701%, (N = 63) vs. 18.41 ± 2.934%, (N = 22), p = 0.0033). SLE patients with high disease activity (Fig. 5F and G) showed expanded CD8 + HLA-DR + CD38 + (11.81 ± 1.076%, (N = 63) vs. 18.55 ± 3.281%, (N = 21), p = 0.0127; CD8 + HLA-DR + CD127 + 1.417 ± 0.1921%, (N = 42) vs. 3.24 ± 1.105%, (N = 10), p = 0.0076). C3 depression (Fig. 5H to K) had low CD8 + HLA-DR + CD38 + (11.32 ± 0.9845%, (N = 64) vs. 18.26 ± 2.912%, (N = 21), p = 0.0047); CD8 + CTLA4 + LAG3 + (0.007246 ± 0.004762%, (N = 69) vs. 0.03636 ± 0.01239%, (N = 22), p = 0.0092); CD3 + CD160 + CD244 + (0.3254 ± 0.04261%, (N = 67) vs. 0.655 ± 0.1496%, (N = 20), p = 0.0043) and CD3 + CD279 + TIGIT + (3.312 ± 0.4021 (69) vs. 5.757 ± 0.9143 (21), p = 0.007). SLE patients with positive dsDNA (Fig. 5L and M) showed higher expression of CD4 + CD279 + TIM3 + (0.3531 ± 0.059%, (N = 49) vs. 0.87 ± 0.199%, (N = 30), p = 0.0037).
Fig. 5
The performance of two Co-IRs expression on T cell correlation with a series of clinical manifestations, disease activity and laboratory features. The p values presentation as above Fig. 3
Subsequently, we compared the levels of activated (CD38, HLA-DR), functioning (CD127), and exhaustion (PD-1, CTLA4, TIGIT, Tim-3, CD160, and CD244) markers on T cells prior to and following seven to twenty-three moths immunotherapy. Notably, higher Co-IRs expression levels of most SLE patients decreased after treatment (Fig. 6), indicating that Co-IRs monitor are useful tools in determining the treatment response, including CD4 + CD279 + (p = 0.0405, N = 14), CD4 + TIM3 + (p = 0.0043, N = 14), CD4 + CTLA4 + (p = 0.0494, N = 13), CD4 + CD127 + (p < 0.0001, N = 13), CD8 + CD279 + (p = 0.0317, N = 14), CD8 + TIM3 + (p < 0.0001, N = 14), CD8 + CTLA4 + (p = 0.0371, N = 13), CD8 + LAG3 + (p = 0.0061, N = 12), CD8 + CD127 + (p < 0.0001, N = 13), CD8 + TIGIT + (p = 0.0034, N = 13), CD8 + CD160 + (p = 0.0024, N = 14), CD8 + CD244 + (p = 0.0305, N = 14), CD4 + CD279 + TIM3 + (p = 0.0159, N = 13), CD4 + CD127 + TIGIT + (p = 0.0002, N = 12), CD8 + CD279 + TIM3 + (p = 0.037, N = 14), CD8 + CD127 + TIGIT + (p = 0.0027, N = 12). Our research suggests that abnormal immune activation with Co-IRs expression may contribute to the immune dysregulation observed in SLE disease courses. The detail information of fourteen patients were listed in Supplemental Table 7.
Fig. 6
The performance of Co-IRs expression on T cell changes after treatment. The p values presentation as above Fig. 3
Soluble PD-1, PDL-2 and TIM3 levels in SLEPD-L2 is one of the ligands of PD-1 expressed by T cells, and its binding to PD-1 blocks activation signals from the T cell receptor and CD28 in typical T cells. TIM3 modulates Th1 immunity through eliciting apoptosis, prompts the generation of a disintegrin and metalloproteinase, and limits autoimmunity [17]. We then asked whether these soluble mediators can correlate to disease phenotypes. As shown in Fig. 7, SLE patients have significant elevated serum levels of soluble PD-1, PDL-2 and TIM3 than HCs (sPD-1: 396.2 ± 69.71, N = 77 vs. 111.1 ± 32.92, N = 92 p = 0.0001; sPDL2: 16.97 ± 0.9238, N = 87 vs 12.78 ± 0.2314, N = 92 p < 0.0001; sTIM3: 6.822 ± 1.5367, N = 91 vs 3.675 ± 0.08441, N = 92 p < 0.0001). Figure 8 indicated sPD-1 levels were correlated to CD4 + CD279 + % (p = 0.0027, N = 75), CD8 + CD279 + % (p = 0.0009, N = 75) and CD3 + CD279 + % (p = 0.001, N = 75). sPD-L2 levels were correlated to CD4 + CD279 + (% p = 0.0111, MFI = 0.0089, N = 87), CD4 + CD279 + (% p = 0.0187, MFI < 0.0001, N = 87) and CD3 + CD279 + (% p = 0.0209, MFI = < 0.0001, N = 87). sTIM3 levels were correlated to CD8 + TIM3 + % (p = 0.0041, N = 90). High sPD-L2 levels correlated with SLE proteinuria (14.37 ± 0.9327, (N = 67) vs 21.99 ± 1.797, (N = 25), p < 0.0001) whereas inverse to C4 depression (17.69 ± 1.055, (N = 71) vs 12.31 ± 1.392, (N = 21), p = 0.0116). High sTIM3 levels correlated with SLE proteinuria (4.966 ± 0.2901, (N = 68) vs 11.63 ± 1.341, (N = 27), p < 0.0001; high (SLEDAI ≥ 6) disease activity (5.274 ± 0.344, (N = 68) vs 10.06 ± 1.157, (N = 27), p < 0.0001 and C3 depression (6.294 ± 0.587, (N = 73) vs 9.872 ± 1.778, (N = 26), p = 0.0148. They functioned as serologic indicators of disease activity and organ involvement.
Fig. 7
Soluble PD-1, PDL-2 and Tim3 serum levels showed significant elevated in SLE patients and correlation with the performance of Co-IRs expression on T cell. The p values presentation as above Fig. 3
Fig. 8
Soluble PD-1, PDL-2 and Tim3 serum levels showed correlation with the presence of nephritis (proteinuria < 0.5gm vs. > 0.5gm), decreased complement component 3 (C3) and/or complement component 4 (C4), and disease activity (SLEDAI > 6). The p values presentation as above Fig. 3
Type I interferon (IFN-β) and JAK inhibitor (JAKi) effects on SLE T cellsThe transcriptional regulation of Co-IR expression such as TIGIT, PD-1, TIM-3, LAG-3, and others can be controlled by the Type I IFN-JAK-STAT axis pathway. In an effort to elucidate the Co-IR expression discrepancy found in our study, we applied exogenous IFN-β together with or without the JAK inhibitor Tofacitinib to the PMBC cultures obtained from LN- (n = 3) and LN + (n = 4) SLE patients. Following stimulation, we employed the FACS analysis to examine the expressions of co-IRs on CD4 + or CD8 + T cell subsets of LN- and LN + patients, including TIGIT, CD38, HLA-DR, CD366, CD279 and CD38 + DR + , as well as the levels of phosphorylated STAT1 (Tyr701) and total STAT1 in CD3 + T cell subsets. As shown in Fig. 9, in response to IFN-β stimulation, both LN- and LN + derived PBMCs exhibited a comparable range of percentages for p-STAT1 + /STAT1 + double positive CD3 + T cells (19.5% to 38.5% in LN- vs 18.3% to 33.1% in LN +). Furthermore, the relative MFI of p-STAT1 (Tyr701) and total STAT1 in these PBMCs increased by four to sixfold in comparison to unstimulated T cells (Fig. 8C). More importantly, we revealed that the CD3 + T cell subsets from LN + patients exhibited a greater degree of responsiveness to Tofacitinib than of those from LN- patients (Fig. 8C and D). With the exception of CD279 on CD4 + T cells, the expression of the majority of co-IRs does not differ significantly in response to IFN- (Supplementary Fig. 4). It is worth noting that LN- patients exhibit reduced levels of CD38 expression, whereas CD38 expression surged following IFN-β induction and declined after JAKi addition. Tofacitinib is more likely to inhibit the expression of CD38 on CD4 + or CD8 + subsets, as well as the expression of CD38 + DR + on CD8 + subsets; therefore, the preponderance of hyperactive p-STAT1 signaling in LN + T lymphocytes might occur in these subpopulations.
Fig. 9
Flow cytometry analysis of phospho and total STAT1 in CD3 + lymphocytes from SLE-LN- and SLE-LN + patients. A Prominent proportions of total STAT1 + or p-STAT1 + double-positive lymphocytes were collected from three LN- and three LN + patients were underwent stimulation for 48 h with 200 ng/mL IFN-\(\upbeta\) in the presence or absence of 200 nM Tofacitinib. B Representative histograms of the levels of p-STAT1 and total STAT1 in LN- and LN + lymphocytes treated, as described in (A). The unstimulated cell populations are represented by the solid black lines, whereas the cell populations that were treated with IFN-β and IFN-β + Tofacitinib were denoted by the solid and dashed red lines, respectively. Histograms that were gray-filled depict negative controls (FMO with isotypes). C Comparative statistical evaluation of p-STAT1 and total STAT1 relative MFI in B. Bar graphs show the fold change MFI of p-STAT1 in IFN-\(\upbeta\)-stimulated CD3 + T cells with or without JAKi Tofacitinib between LN- and LN + patients. The results were found to be statistically significant using an unpaired t-test, and the data are presented as mean ± SEM. D The percentages of p-STAT1 + /STAT1 + double positive T cells (CD3 +) from LN- and LN + patients with or without IFN-\(\upbeta\) stimulation in the presence or absence of Tofacitinib. An unpaired t-test was employed to assess the difference between the two groups, and statistical bar graphs with mean ± SEM were utilized for presenting the quantitative results
留言 (0)