
記住我


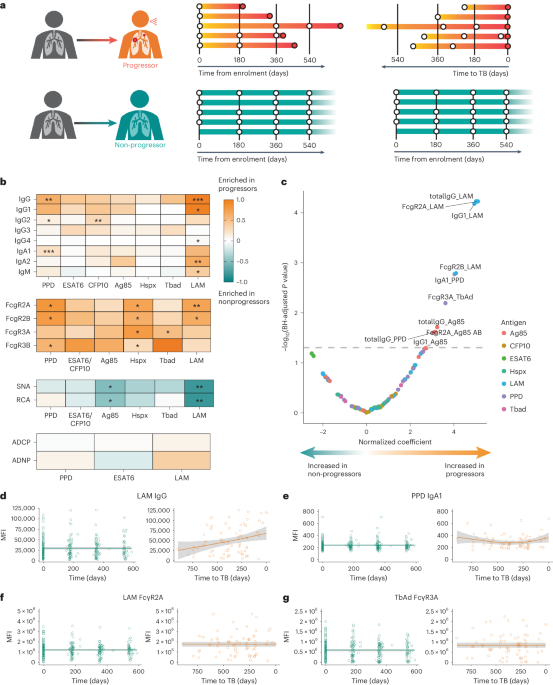
Changes in Mtb-specific antibody levels, isotype selection and Fc glycosylation are sensitive biomarkers of TB disease states25,26,27,28,29,34,35. We therefore sought to determine the extent to which Mtb-specific antibody profiles, which can distinguish active TB from latent infection26,30, pre-date the diagnosis of active TB. We comprehensively profiled the Mtb-specific humoral immune response in longitudinal serum samples collected from 36 adolescent progressors before the diagnosis of active TB and 104 matched non-progressors from the ACS cohort14 (Fig. 1a and Supplementary Table 1). Averaged across all timepoints, overall levels of Mtb-specific IgG, the dominant isotype in the blood, trended higher in progressors compared with non-progressors (Fig. 1b). Lipoarabinomannan (LAM)-specific IgG, IgG1, IgG4, IgA2 and IgM were all significantly increased in progressors compared with non-progressors, as were purified protein derivative (PPD)-specific IgG, IgG2 and IgA1, and culture filtrate protein 10 (CFP10)-specific IgG2. Mtb-specific Fc receptor binding antibodies were also increased in progressors, including LAM-specific FcγR2A and FcγR2B, PPD-specific FcγR2A, FcγR2B and FcγR3B, heat shock protein X (HspX)-specific FcγR2A, FcγR2B, FcγR3A and FcγR3B, and 1-tuberculosinyl adenosine 1 (TbAd)-specific FcγR3A. LAM- and antigen 85 complex (Ag85)-specific Fc binding of lectins Sambucus nigra agglutinin (SNA) and Ricinus communis agglutinin I (RCA) were selectively increased in non-progressors, indicating elevated Fc sialylation and galactosylation; decreased Fc sialic acid and galactose have been associated with the inflammatory humoral profile of active TB27. We assessed antibody-mediated effector functions, but no differences between progressors and non-progressors were identified in antibody-dependent cellular or neutrophil phagocytosis across several Mtb-specific antigens.
Fig. 1: ACS progressors exhibit distinct Mtb-specific antibody profiles.
a, Serum collected longitudinally from a cohort of South African adolescents who later progressed to active TB disease (n = 36) or who maintained asymptomatic infection (n = 104). For analyses in the current study, progressors were aligned by time of diagnosis and non-progressors by time of enrolment. b, Systems serologic assays performed against a panel of Mtb antigens, including the selection of antibody isotype and subclasses, the binding of Fcγ receptors, the binding to Fc of lectins SNA (recognizes sialic acid) and RCA (recognizes galactose), and the ability to recruit antibody-mediated cellular phagocytosis (ADCP) and neutrophil phagocytosis (ADNP). For each indicated assay, values for each individual were averaged over time. Each heatmap represents log2(median value in progressors/median value in non-progressors). The statistical significance of the differences between progressors and non-progressors was measured by two-sided Mann–Whitney test followed by Benjamini–Hochberg (BH) correction for multiple comparisons. *P < 0.05; **P < 0.01. c, Mixed-effects linear modelling to evaluate the association between antibody features and progressor status by controlling age, sex, ethnicity, school code and time of sample collection. Likelihood ratio test was used to compare the two paired models, and P values were corrected for multiple comparisons by the BH method. The x axis indicates the effect size as a normalized coefficient of the variable of progression, and the y axis −log10 of the adjusted P values. The dotted line represents the corrected P value of 0.05. d, Raw values of LAM-specific IgG measurements for all individuals plotted over time from enrolment (non-progressors, teal) or time to TB (progressors, orange). The solid lines indicate a smooth of median values, using a generalized additive model, and the grey shading indicates one standard deviation. e–g, Plots for PPD-specific IgA1 (e), LAM-specific antibody binding of FcγR2A (f) and TbAd-specific antibody binding of FcγR3A (g).
We next used a mixed linear model to rank and identify the most differential antibody features between progressors and non-progressors, controlling for the effects of demographic confounders and study timepoints (Fig. 1c). The model identified antibody responses targeting LAM as increased in progressors compared with non-progressors, including LAM-specific total IgG, IgG1, FcγR2A and FcγR2B binding levels. PPD-specific total IgG and IgA1 were also selectively enriched in progressors, albeit to a lesser extent, as were Ag85-specific total IgG, IgG1 and FcγR2A, and TbAd-specific FcγR3A binding. By contrast, no measured Mtb-specific antibody features were significantly enriched in non-progressors.
Mtb-specific antibody responses vary longitudinallyPrior analyses of the ACS cohort found that blood transcriptional signatures of progression increased closer to the time of TB diagnosis12,15,17,18, whereas the frequency of TCR specificities enriched in progressors remained relatively stable across the study period24. We therefore examined the longitudinal evolution of antibody features that were significantly increased in progressors as compared with non-progressors (Fig. 1d–g and Extended Data Fig. 1). The temporal and inter-individual variability of each measured feature was high. In progressors, some antibody features, such as LAM-specific IgG and PPD-specific IgA1, increased at timepoints proximal to TB diagnosis. However, others, such as LAM-specific FcγR2A binding and TbAd-specific FcγR3A binding, remained stably elevated in progressors over the duration of follow-up. Thus, while some measured antibody features increased approaching the time of clinical diagnosis, like the transcriptional signatures, others appeared to be longitudinally stable up to 2 years before TB diagnosis, as observed for TCR specificities.
An Mtb-specific SeroScore detects TB progression riskA parsimonious transcriptomic signature was previously developed, RISK6, which differentiates progressors from non-progressors in the ACS cohort15. RISK6 signature scores were determined by a pair-ratio approach using three transcripts upregulated in progressors (SERPING1, GBP2 and FCGR1B) and three downregulated in progressors (TRMT2A, SDR39U1 and TUBGCP6). We next asked whether the measured differential antibody features captured the same or distinct immunological processes as those marked by RISK6, by measuring correlations between Mtb-specific antibody features and RISK6 scores and transcript expression levels. The two sets of RISK6 transcripts showed the expected correlations with each other, consistent with how they were identified (Fig. 2a). However, the measured antibody features showed minimal correlation with RISK6 and its individual component transcripts (Fig. 2a), suggesting that Mtb-specific antibody profiles capture distinct biologic processes.
Fig. 2: An Mtb-specific SeroScore differentiates progressors from non-progressors.
a, For all individuals at all timepoints, Spearman correlations were calculated between all measured Mtb-specific antibody features and RISK6 score (n = 377 measurements) or transcript expression levels of each of its six components (n = 312 measurements). The heatmap indicates Spearman correlation coefficient for each comparison. b, A multivariate SeroScore was developed on the basis of systems serology data in ACS. The heatmap represents Z-scored data for the six features included in the SeroScore. Each column represents one individual (n = 36 progressors and n = 104 non-progressors). Individuals are sorted by overall SeroScore as shown in the track beneath the heatmap. RISK6 score and progressor/non-progressor status of each individual are also indicated in tracks. c, ROC curves developed assessing the ability to differentiate progressors (n = 29) from non-progressors (n = 99) of RISK6 (left), SeroScore (middle) and both RISK6 and SeroScore in combination (right). ROC curves were generated 50 times using randomly selected 80% of samples with group stratification. The mean curve is indicated in blue, with grey shading indicating one standard deviation. The mean AUC with 95% confidence interval is indicated. d–f, Additional ROC curves developed only including progressors in time windows 0–9 months before diagnosis (n = 19 progressors) (d), 9–18 months before diagnosis (n = 18 progressors) (e) and 18–27 months before diagnosis (n = 10 progressors) (f).
We next defined a minimal set of antibody features associated with progression. We used the least absolute shrinkage and selection operator (LASSO) technique to identify the most relevant features differentiating progressor and non-progressor groups and identified the combination of features with the highest discriminative ability (Extended Data Fig. 2a). This analysis generated a minimal set of seven features (PPD-specific IgG2, IgA1, IgA2, IgM, FcγR3B, LAM-specific IgG1 and early secretory antigen 6 (ESAT6)-specific IgG2) that enabled resolution of progressors and non-progressors in ACS (Fig. 2b). We used these seven features to define a SeroScore, a multivariate score differentially associated with progression.
To further understand whether the SeroScore and RISK6 captured similar or different biologic processes, we compared their ability to differentiate progressors and non-progressors over time. Across the full study period, RISK6 and SeroScore similarly differentiated progressors, each with an area under the curve (AUC) of 0.82 independently, which improved to 0.86 in combination (Fig. 2c). At 0–9 months, the time window most proximal to diagnosis of active TB, the SeroScore had a median AUC of 0.79, compared with 0.86 for RISK6; combining the two scores in this timeframe did not improve performance beyond that of RISK6 alone (Fig. 2d). At 9–18 months (Fig. 2e) and 18–27 months (Fig. 2f), RISK6 performance declined to AUC of 0.83 and 0.67, respectively, but the SeroScore remained stable with AUC of 0.78 and 0.86. These findings suggest that, particularly at timepoints more remote from diagnosis, the SeroScore captured biologic information that RISK6 did not.
Sex influences scores associated with progressionSex is a well-established modifier of immune responses36,37,38, and the global prevalence of active TB in males exceeds that in females with a ratio of 1.7 (ref. 39). We sought to determine whether sex influenced the association of the SeroScore or the RISK6 signature with progression in the ACS cohort, which is 67.1% female. Across the full study period, both the SeroScore and RISK6 identified male progressors slightly better than females (Fig. 3a,b). We then combined the SeroScore and RISK6 linearly to determine whether they had better ability to identify progressors in combination. The combined score was better able to identify progressors in both male and female subgroups, but the mean AUC among female participants, at 0.84, remained lower than among male participants, where it reached 0.94 (Fig. 3c). When we directly plotted SeroScore by sex and progressor status, male progressors trended towards higher SeroScores and RISK6 scores than female progressors, while both scores were similar in male and female non-progressors (Fig. 3d). Thus, despite being discovered in a predominantly female cohort, both the SeroScore and RISK6 signatures captured progression better among males than females.
Fig. 3: Sex modulates the association of SeroScore and RISK6 with TB progression.
ROC curves were developed measuring the ability of the ACS-derived SeroScore and RISK6 to differentiate progressors from non-progressors in ACS. a, The identification of progressors by the ACS-derived SeroScore among all ACS individuals (n = 29 progressors and n = 99 non-progressors), males only (n = 7 progressors and n = 37 non-progressors) and females only (n = 22 progressors and n = 63 non-progressors). b, As in a, the performance of RISK6 among all ACS, males only and females only. c, The identification of progressors by the ACS-derived SeroScore and RISK6 in combination among all ACS, males only and females only. For a–c, the mean of 50 curves is shown in blue, with grey shading indicating one standard deviation. The mean AUC with 95% confidence interval is indicated on each plot. d, The ACS SeroScore and RISK6 signature score were plotted for female (n = 22) and male (n = 7) progressors (P, orange) and female (n = 63) and male (n = 37) non-progressors (NP, teal) from ACS. The groups were compared by Kruskal–Wallis test, with P values <0.05 indicated.
The ACS SeroScore detects TB progression among adolescentsWe next sought to assess the performance of the ACS SeroScore in a second cohort of 39 progressors and 169 non-progressors from the South African subcohort of GC6, a longitudinal study of TB household contacts12. Prior work demonstrated that the ACS-defined RISK6 signature had reduced performance in the GC6 cohort, which was attributed to differences in study design, environmental or temporal exposure to TB, geography of the participants and wider age range (Supplementary Table 2 and Extended Data Fig. 3)15.
When applied to the GC6 cohort, the ACS-derived SeroScore identified progressors marginally, with an overall mean AUC of 0.60 (Fig. 4a). To more closely align the demographic features of GC6 with ACS, we stratified the GC6 subjects into adolescents, who were 8–20 years of age at enrolment (14 progressors and 63 non-progressors), and adults, who were 21–60 years of age at enrolment (25 progressors and 106 non-progressors). The AUC of the SeroScore differed with age, with a mean value of 0.72 among adolescents and only 0.53 among adults (Fig. 4b). Interestingly, among individuals with an available RISK6 score, the RISK6 test performance also improved among the adolescent GC6 group (Extended Data Fig. 4). As in the ACS cohort, the ability of the ACS-derived SeroScore to identify progressors remained longitudinally stable in GC6 up to 18 months before diagnosis, but the small sample size limited evaluation at timepoints earlier than 18 months (Extended Data Fig. 5).
Fig. 4: Mtb-specific antibody profiles correlate with progression in GC6 adolescents.
a, ROC curves developed to evaluate the ability of the ACS-derived SeroScore to differentiate progressors (n = 39) and non-progressors (n = 169) among individuals from the GC6 cohort. The grey shading indicates one standard deviation. The mean AUC is indicated. b, ROC curves evaluating the ability of the ACS-derived SeroScore to differentiate progressors from non-progressors among GC6 adolescents (age 8–20 years at enrolment, n = 14 progressors and n = 63 non-progressors) and adults (age >20 years at enrolment, n = 25 progressors and n = 106 non-progressors). The mean of 50 curves is shown in blue, with grey shading indicating one standard deviation. The mean AUC with 95% confidence interval is indicated. c, Mtb-specific systems serology used to profile serum collected longitudinally from the GC6 cohort. For each indicated assay, values for each individual were averaged over time. In the heatmap, each cell represents log2(median value in progressors/median value in non-progressors). The statistical significance of the differences between progressors and non-progressors was measured by two-sided Mann–Whitney test followed by Benjamini–Hochberg (BH) correction for multiple comparisons. *P < 0.05 after correction. d, A heatmap representing averaged values over time for adolescent individuals only. Each cell represents log2(median value in progressors/median value in non-progressors). The statistical significance of the differences between progressors and non-progressors were measured by two-sided Mann–Whitney test followed by BH correction for multiple comparisons. *P < 0.05 after correction. e, Among all GC6 individuals, mixed-effects linear modelling was used to evaluate the association between antibody features and progressor status by controlling age, sex and time of sample collection. Likelihood ratio test was used to compare the two paired models, and P values were corrected for multiple comparisons by the BH method. The x axis indicates effect size as normalized coefficient of the variable of progression, and the y axis −log10 of the adjusted P values. The dotted line represents the corrected P value of 0.05. f, A heatmap representing Spearman correlation coefficients between each antibody feature and age among GC6 non-progressors only (n = 169). P values for each correlation were adjusted for multiple comparisons by the BH method, and adjusted P values are indicated: *P < 0.05, **P < 0.01, ***P < 0.001.
Given the increased heterogeneity of the GC6 cohort, we next aimed to independently determine whether distinct Mtb-specific antibody features associated with progression existed in GC6. Humoral differences between progressors and non-progressors were more subtle in the GC6 cohort compared with ACS (Fig. 4c). Among adolescents, several Mtb-specific antibody responses were selectively enriched among progressors, including markedly increased LAM-specific IgG1, IgG2 and IgG3 levels and binding of FcγR2A, FcγR2B and FcγR3A, though, given the small sample size, none achieved statistical significance after multiple test correction. As observed in ACS, Fc sialylation and galactosylation trended towards an enrichment in non-progressors (Fig. 4d). In a mixed linear model, IgG and IgA1 responses to PPD, LAM and Ag85, and FcγR binding to these antigen-specific antibodies, were significantly enriched in progressors (Fig. 4e). Thus, while the differences were smaller in magnitude, the specific discriminatory Mtb-specific antibody profiles observed across progressors and non-progressors in GC6 resembled features identified in the ACS cohort (Fig. 1).
Class-switched Mtb antibodies emerge with increasing ageWe postulated that the reduced association of antibody features with progression among GC6 adults might be due to chronic Mtb exposure increasing background Mtb-specific antibody levels among non-progressors. We measured the relationship between antibody features and the age at the time of enrolment in the non-progressors in GC6 (Fig. 4f). We found that class-switched antibody responses, primarily IgG2, IgG3 and IgA1, positively correlated with age at enrolment. Conversely, IgM levels and Fc sialylation and galactosylation, represented by SNA and RCA, demonstrated negative correlations with age. Together, these data demonstrate that, with increasing age, individuals without known active TB disease exhibit broad class-switching of Mtb-specific antibody responses and decreased Fc sialylation and galactosylation, antibody features suggestive of increased inflammatory tone40.
The GC6 SeroScore detects progressors across cohortsFinally, we hypothesized that profiles of progression identified in a more heterogeneous population would be more likely to yield an epidemiologically concordant score of TB progression. We therefore defined an independent SeroScore in GC6 (Extended Data Fig. 2b) with markers that were disproportionately enriched among progressors (Fig. 5a). The LASSO algorithm is designed to avoid selecting multiple co-correlated variables to limit the risk of model overfitting, and thus may select different features for different datasets, even when the underlying architecture is very similar. Nevertheless, the GC6-derived SeroScore included some of the same features as the ACS-derived SeroScore, including PPD-specific IgA1 and IgG2. Similarly, LAM- and ESAT6-specific total IgG were included in the GC6 SeroScore, whereas subclasses LAM-specific IgG1 and ESAT6-specific IgG2 had been included in the ACS SeroScore.
Fig. 5: A GC6-derived SeroScore detects humoral correlates of progression.
a, A multivariate SeroScore was developed in GC6. The heatmap represents Z-scored data for the six features included in the SeroScore. Each column represents one individual (n = 39 progressors and n = 169 non-progressors). The individuals are sorted by overall SeroScore as shown in the track beneath the heatmap. The RISK6 score and progressor/non-progressor status of each individual are also indicated in tracks. b, To evaluate the ability of the GC6-derived SeroScore to identify progressors in the same cohort, ROC curves were developed over the total study period (n = 39 progressors, n = 169 non-progressors) and for progressors in time windows 0–9 months (n = 30 progressors), 9–18 months (n = 19 progressors) and 18–27 months (n = 8 progressors) before the diagnosis of active TB. The mean of 50 curves is shown in blue, with grey shading indicating one standard deviation. The mean AUC with 95% confidence interval is indicated. c, ROC curves measure the ability of the GC6-derived SeroScore to identify GC6 progressors in an age-stratified analysis of adolescents (n = 14 progressors and n = 63 non-progressors) and adults (n = 25 progressors and n = 106 non-progressors). d, The ROC curves measure the ability of the GC6-derived SeroScore to identify progressors in the full ACS cohort (n = 29 progressors and n = 99 non-progressors), males only (n = 7 progressors and n = 37 non-progressors) and females only (n = 22 progressors and n = 63 non-progressors).
The GC6-derived SeroScore differentiated progressors from non-progressors in GC6 at all tested time windows, with a longitudinally stable mean AUC of 0.72–0.73 at 0–9 months, 9–18 months and 18–27 months, and over all time windows (Fig. 5b). Similar to the ACS SeroScore, the GC6-derived SeroScore identified progressors better among adolescents than adults, with mean AUC values of 0.82 and 0.69, respectively (Fig. 5c). The G6C SeroScore was able to discriminate progressors in ACS, with an AUC of 0.66 overall (Fig. 5d). It also performed better in males, with an AUC of 0.83 as compared with females with an AUC of 0.63. These findings highlight the presence of similar humoral features differentiating progressors from non-progressors in both the ACS and GC6 cohorts, including enhanced expansion of class-switched Mtb-specific IgA and IgG2, and higher levels of LAM-specific antibodies in progressors. We also find that age and sex modify the relationship between these Mtb-specific humoral features and TB progression.
留言 (0)