
記住我
Type 1 diabetes mellitus (T1DM) is the most common metabolic disorder in children and adolescents. Globally, 98,200 children are estimated to develop T1DM annually.1 Diabetic retinopathy (DR) is the most common ocular complication of T1DM patients and will lead to moderate or severe visual impairment or blindness.2,3 The prevalence of DR was 11% in children with T1DM, and the prevalence of DR was increased to 94% when children with T1DM are 17 to 34 years of age.4 At present, there is no standard protocol on examination for DR in children younger than 9 years or with T1DM duration less than 5 years.5 Clinically, DR is diagnosed by detecting microaneurysms through fundus examination. Recently, A few studies have revealed that microvascular changes and neurodegenerative damage have occurred before clinical DR in patients with Type 2 diabetes.6–10 Currently, there are few studies on microvascular and neurodegenerative changes detected before microaneurysms in children with T1DM.
Different from Type 2 diabetes mellitus, T1DM is characterized by autoimmune destruction of insulin-producing β-cells in the pancreas, with a need for daily insulin injections to control blood glucose.11 Currently, the ways for daily insulin injections are multiple daily insulin injections (MDI) and continuous subcutaneous insulin infusion (CSII). In randomized controlled trials, as the most physiological way to administer insulin, CSII has been demonstrated to achieve a better metabolic control in children with T1DM than MDI.12–14 There are few studies that evaluate whether different daily insulin injection ways influence microvascular and neurodegenerative changes in children with T1DM without DR.
The purpose of this study was to measure the microvascular and neurodegenerative changes of retina by optical coherence tomographic angiography (OCTA) and optical coherence tomography (OCT) in children with T1DM without DR. We assessed whether CSII benefits on reducing the microvascular and neurodegenerative changes of retina compared with MDI therapy. We aimed to provide evidence and methods for monitoring DR in children with T1DM.
Methods Study Design and OversightThis cross-sectional observational study was performed from October 2020 to December 2021. Sixty-three eyes of children with T1DM with no DR examined at the Second Affiliated Hospital and Yuying Children's Hospital of the Wenzhou Medical University enrolled in this study. Of these 63 children, 41 were treated with multiple daily insulin injections and admitted to T1DM-MDI group, and 22 were treated with CSII and admitted to T1DM-CSII group. Sixty-two age-matched and sex-matched normal children were recruited as controls.
Patient SelectionThe inclusion criteria were as follows: aged 5 to 18 years, diagnosed with T1DM for a minimum duration of 1 year without DR, and BCVA equal to or greater than 20/25.The exclusion criteria were children with eye diseases or other systemic diseases covering the following 1) DR, maculopathy, and other retina diseases; 2) corneal diseases, lens diseases, and other eye diseases that may affect the results of OCTA examinations; 3) a history of intraocular surgery; and 4) hypertension, circulatory system diseases, respiratory system diseases, and other systemic diseases.
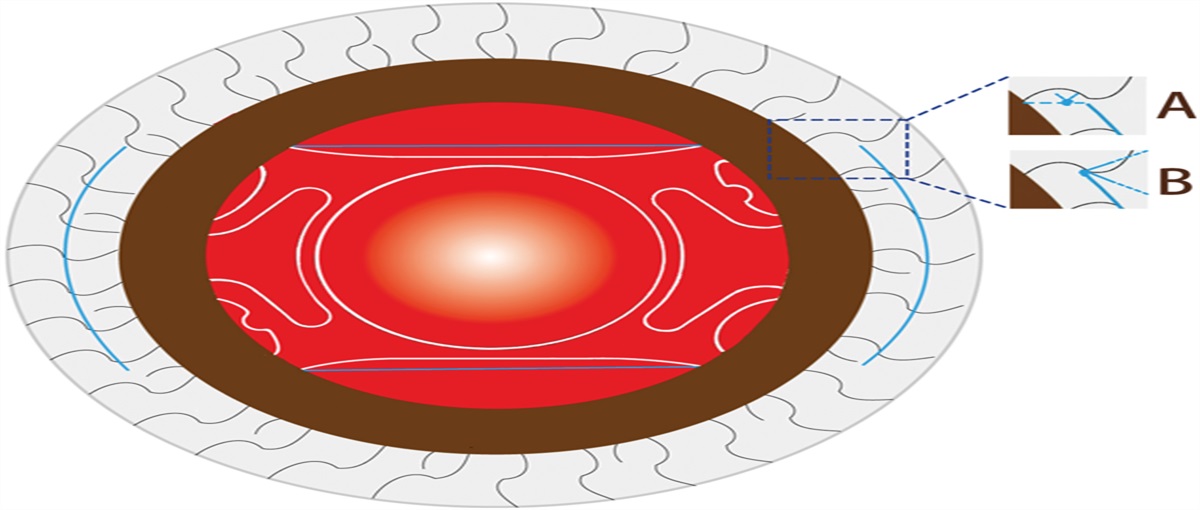
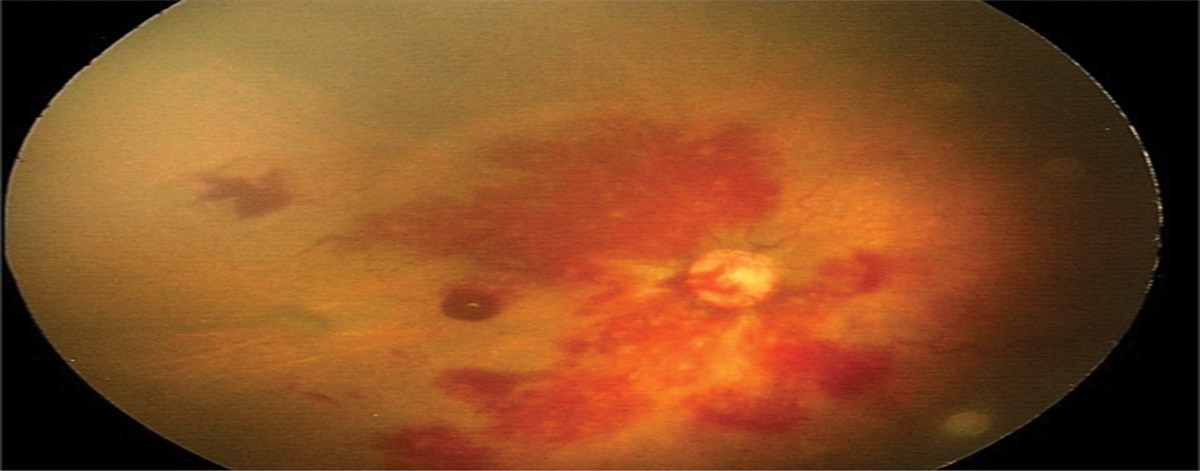
Ophthalmic ExaminationFirst, baseline characteristics were collected, including age, sex, history of DM, history of medications, and surgery. Metabolic variables of children with T1DM were collected including hemoglobin A1c (HbA1c), low-density lipoprotein, high-density lipoprotein, triglyceride (TG), total cholesterol, 24-hour urinary protein quantity (24h UPQ), 25-(OH)VitD, and C-peptide. Subsequently, children underwent a full ophthalmic examination: 1) Slit-lamp examination for the anterior segment, 2) intraocular pressure (IOP) using TOPCON RM-800, 3) best-corrected visual acuity using an Early Treatment Diabetic Retinopathy Study chart at 4 m, 4) axial length using IOLMaster 500 (Carl Zeiss Meditec AG, Jena, Germany), 5) examination of the fundus retina with noncontact lens, and fundus photography using Optomap 200Tx Scanning Laser Ophthalmoscope (United Kingdom OPTOS PLC, United Kingdom), 6) OCT and OCTA performed using SPECTRALIS OCT (Heidelberg Engineering, Heidelberg, Germany) to obtain 6×6 mm images of retina centered on the fovea. SPECTRALIS OCT was equipped with a software allowing the analysis of thickness of retinal nerve fiber layer, ganglion cell layer, inner plexiform layer, inner nuclear layer, outer plexiform layer, outer nuclear layer, inner retinal layer, and outer retinal layer. Images of OCTA were automatically segmented to superficial vascular plexus (SVP), intermediate capillary plexus (ICP), and deep capillary plexus (DCP) using built-in software. Vessel density (VD) of SVP, ICP, and DCP, foveal avascular zone area, foveal avascular zone perimeter, and foveal avascular zone morphology index (FAZM) were calculated using Image J software (National Institutes of Health, Bethesda, MD).
Statistical AnalysisStatistical analysis was conducted in IBM SPSS statistics version 26. For all analysis, P value of <0.05 was considered statistically significant. All data were reported as means ± SD. Kolmogorov–Smirnov test was used to determine whether demographic data were distributed normally. Analysis of varience was performed to compare continuous demographic variables (age, BCVA, length of optic axis (AL), IOP, thickness of retina, VD, foveal avascular zone area, foveal avascular zone perimeter, FAZM) among the three groups. Student test was performed to compare continuous metabolic variables (HbA1c, TG, total cholesterol, low-density lipoprotein, high-density lipoprotein, 24h UPQ, 25-(OH)VitD, C-peptide) between the two T1DM groups. Pearson correlation analysis was used to study the association between OCTA parameters and metabolism parameters.
ResultsA total of 41 children with T1DM were admitted to T1DM-MDI group and 22 children were admitted to T1DM-CSII group. Another 62 healthy children were admitted to control group of this study. The participants' age in both T1DM groups ranged from 6 to 17 years, whereas those in control group ranged from 7 to 17 years. There were no significant differences in age, body mass index (BMI), IOP, AL, and SE among the three groups. Basic information of the children in the three groups is shown in Table 1. The average duration of DM of T1DM-MDI group and T1DM-CSII group was similar (2.45 vs. 2.18 years; P = 0.947). The blood HbA1C values of T1DM-MDI group ranged from 5.10 to 13.79 mmol/L (average, 8.00 mmol/L). The blood HbA1C values of T1DM-CSII group ranged from 5.84 to 13.79 mmol/L (average, 8.33 mmol/L). No statistically significant differences were observed in HbA1C and other metabolic variables (Table 2).
Table 1. - Basic Information of Children in T1DM-MDI Group, T1DM-CSII Group, and Control Group Parameters T1DM-MDI T1DM-CSII Control F P Age, years 11.59 ± 2.61 11.36 ± 3.33 11.37 ± 2.95 0.054 0.947 BMI, kg/m2 17.29 ± 2.82 17.49 ± 2.43 17.26 ± 4.27 0.730 0.485 IOP, mmHg 15.33 ± 2.66 15.47 ± 1.83 15.41 ± 2.84 0.022 0.978 AL, mm 23.48 ± 1.75 23.53 ± 1.02 23.91 ± 1.12 1.419 0.246 SE, D −1.08 ± 1.69 −0.74 ± 1.13 −1.08 ± 2.20 0.298 0.743SE, spherical equivalent.
24h UPQ, 24-hour urinary protein quantity; HDL, high-density lipoprotein; LDL, low-density lipoprotein; TC, total cholesterol; TG, triglyceride.
The VD of SVP, ICP, and DCP were all significantly different among the three groups. Furthermore, the VD of SVP, ICP, and DCP in T1DM-MDI group were all significantly lower than those in the T1DM-CSII with similar HbA1c. FAZM in T1DM-MDI and T1DM-CSII groups were both smaller than that in the control group. No statistically significant differences were observed in foveal avascular zone area and foveal avascular zone perimeter among the three groups. There was no statistically significant difference in the thickness of the retina among the three groups (Table 3).
Table 3. - OCTA and OCT Results of Children in T1DM-MDI Group, T1DM-CSII Group, and Control Group Parameters T1DM-MDI T1DM-CSII Control F P VDSVP 0.39 ± 0.05 0.44 ± 0.04 0.42 ± 0.06 8.466 0.000 VDICP 0.26 ± 0.04 0.30 ± 0.02 0.28 ± 0.04 6.175 0.003 VDDCP 0.30 ± 0.04 0.33 ± 0.04 0.32 ± 0.04 3.712 0.027 FAZA, µm2 0.46 ± 0.16 0.40 ± 0.15 0.40 ± 0.15 1.917 0.151 FAZP, µm 3.01 ± 0.60 2.83 ± 0.57 2.71 ± 0.64 2.849 0.062 FAZM 0.63 ± 0.11 0.63 ± 0.12 0.69 ± 0.15 3.318 0.040 RNFL, µm 19.13 ± 1.37 19.80 ± 1.24 19.39 ± 1.52 1.635 0.199 GCL, µm 50.49 ± 4.06 51.48 ± 3.47 51.56 ± 3.93 1.001 0.370 IPL, µm 40.85 ± 2.40 42.27 ± 2.57 41.35 ± 2.42 2.443 0.091 INL, µm 40.34 ± 3.14 41.26 ± 2.74 41.49 ± 3.23 1.705 0.186 OPL, µm 33.43 ± 4.38 35.57 ± 2.92 33.10 ± 4.85 2.619 0.077 ONL, µm 69.11 ± 7.45 65.65 ± 8.92 68.75 ± 6.43 1.835 0.164 IRL, µm 233.12 ± 13.63 235.45 ± 14.51 234.62 ± 11.16 0.289 0.750 ORL, µm 81.85 ± 2.06 82.64 ± 2.53 81.48 ± 2.07 2.435 0.092FAZA, foveal avascular zone area; FAZM, foveal avascular zone morphology index; FAZP, foveal avascular zone perimeter; GCL, ganglion cell layer; INL, inner nuclear layer; IPL, inner plexiform layer; IRL, inner retinal layer; ONL, outer nuclear layer; OPL, outer plexiform layer; ORL, outer retinal layer; RNFL, retinal nerve fiber layer; VDDCP, vessel density of deep capillary plexus; VDICP, vessel density of intermediate capillary plexus; VDSVP, vessel density of superficial vascular plexus.
Using the data from T1DM-MDI, we performed Pearson correlation analysis between OCTA parameters and metabolism parameters. The analysis indicated that higher HbA1c was associated with lower VD of SVP (r = −0.377, P = 0.015). There was no statistically significant association between OCTA parameters and other metabolism parameters (Table 4). However, HbA1c was not statistically associated with VD of SVP in T1DM-CSII group (r = 0.172, P = 0.444).
Table 4. - Correlation of OCTA Parameters and Metabolism Parameters in T1DM-MDI Group HbA1C C-peptide 25-(OH)VitD 24h UPQ LDL HDL TC TG VDSVP −0.377* 0.226 −0.113 0.064 −0.178 −0.148 −0.235 0.131 VDICP −0.203 0.154 −0.204 −0.016 −0.116 0.069 −0.111 0.009 VDDCP −0.216 0.144 −0.015 0.008 −0.109 0.104 −0.078 −0.024 FAZM 0.292 0.219 −0.132 −0.015 0.106 −0.048 0.097 0.23124h UPQ, 24-hour urinary protein quantity; HDL, high-density lipoprotein; LDL, low-density lipoprotein; TC, total cholesterol; TG, triglyceride; VDDCP, vessel density of deep capillary plexus; VDICP, vessel density of intermediate capillary plexus; VDSVP, vessel density of superficial vascular plexus.
*P < 0.05.
As a noninvasive technique to quantify the retinal microvasculature, OCTA can detect small microvascular changes of retina.15 Employing OCTA, this study found that MDI-treated children with T1DM without DR had lower VD of SVP, ICP, and DCP compared with healthy control children. Inanc et al16 also reported significant differences in superficial and deep plexus vascular density in children with T1DM compared with healthy subjects. Li et al17 found that the VD of the inner and outer rings of the macula in children and adolescents with DM showed a statistically significant decrease. These results suggested that reduction in blood flow and impairment of the blood–retinal barrier have occurred because of chronic hyperglycemia before apparent signal of DR in children with T1DM. As a noninvasive and repeatable technique,18 OCTA is an available technology to detect and closely follow-up the earlier microvascular changes of retina in children with T1DM without clinical DR. In future, VD of retina may be an important indicator to predict and monitor the T1DM DR in clinic.
Different from Type 2 diabetes mellitus, T1DM is characterized by autoimmune destruction of insulin-producing β-cells in the pancreas, with a need for daily insulin injections to control blood glucose.11 Insulin is typically delivered either as MDI or as CSII. Numerous studies19–21 have demonstrated that CSII improved metabolic control by lowering HbA1c and decreased complications among adolescent and adults with T1DM. Reid et al22 proposed that CSII therapy was associated with significantly slower DR progression over a 3-year follow-up period compared with MDI therapy. Similarly, we found that the VD of three vascular layers in T1DM-MDI group was significantly lower than that in the T1DM-CSII group in this study. Compared with MDI therapy, CSII therapy may be protective against retinal microvascular damage in early DR stage. In this study, we found that higher HbA1c was associated with lower VD of SVP in children with T1DM with MDI. However, HbA1c was not statistically associated with VD of SVP in T1DM-CSII group. HbA1C in the T1DM-CSII group was not significantly different from that in the T1DM-MDI group, indicating that CSII therapy may not simply control mean blood glucose to decrease its damage to retinal microvasculature. The mechanism may relate to glycemic variability, miRNA expression, inflammation, and oxidative stress. Quirós et al23 found that CSII therapy reduced the frequency of hypoglycemia, which has conferred beneficial in terms of DR risk, even with no HbA1c reduction. Scott et al24 discovered that HbA1c and C-peptide changed similarly, but vascular-related miRNAs expression decreased in CSII users versus MDI users over a 1.5-year follow-up. Rather than HbA1c or residual C-peptide, miRNA differences may more likely reflect true differences of two insulin delivery modalities. To prevent the retinal complication, we suggest that CSII be the first choice for children with T1DM to control blood glucose, which have demonstrated a cost-effective treatment in T1DM.
DM not only leads to retinal vasculopathy but also leads to retinal neuropathy. Some studies25–27 indicated that retinal neurodegeneration is one of the earliest detectable retinal abnormalities in patients with DM, and even possibly preceding retinal vasculopathy. El-Fayoumi et al28 found that the mean average retinal nerve fiber layer thickness and the mean GCC thickness in children with T1DM with normal fundus examination were both significantly thinner than healthy control children using OCT. These studies suggests that neurodegenerative changes occur in the absence of microaneurysm. In this study, there was no statistically significant difference in the thickness of the retina among the three groups. Retinal neurodegeneration may occur earlier than the apparently visible retinal vasculopathy but not earlier than retinal microvascular abnormalities, which can be detected by OCTA. Optical coherence tomographic angiography is beneficial to detect the retinal abnormalities in children with early T1DM.
The present study has several limitations. First, it was a single-center study, containing a small number of subjects, particularly T1DM-CSII group. Due to the pump, CSII therapy needed higher initial costs than MDI. In Wenzhou, children with T1DM preferred MDI therapy to CSII therapy because of its lower cost. Second, it was a cross-sectional study without long-term retinal data to explore T1DM retinal change using different therapies in different DM stages. Finally, this study did not collect data on miRNA and hypoglycemia, which may directly confirm the protection mechanism of CSII on retinal microvasculopathy.
In summary, OCTA and OCT were performed on children with T1DM without clinical DR to quantify retinal microvascular and neurodegenerative changes. Vessel density of SVP, ICP, and DCP were lower in T1DM with MDI than in healthy control children, and higher HbA1c was associated with lower VD of SVP. There was significantly significant difference on VD of SVP, ICP, and DCP betweenT1DM-MDI and T1DM-CSII groups, with the similar HbA1c. No statistically significant difference was found in the thickness of the retina among the three groups. This study suggested that OCTA is beneficial to detect the retinal abnormalities in children with early T1DM and CSII be a better choice than MDI for children with T1DM to prevent the retinal complication.
References 1. Desai S, Buchade S, Chitlange S, et al. Vaccines for type 1 diabetes: prevention or reversal? Curr Diabetes Rev 2021;17:30–36. 2. Yau JW, Rogers SL, Kawasaki R, et al. Global prevalence and major risk factors of diabetic retinopathy. Diabetes Care 2012;35:556–564. 3. Wang SY, Andrews CA, Herman WH, et al. Incidence and risk factors for developing diabetic retinopathy among youths with type 1 or type 2 diabetes throughout the United States. Ophthalmology 2017;124:424–430. 4. Staurenghi G, Sadda S, Chakravarthy U, Spaide RF. Proposed lexicon for anatomic landmarks in normal posterior segment spectral-domain optical coherence tomography: the IN•OCT consensus. Ophthalmology 2014;121:1572–1578. 5. Lueder GT, Silverstein J. Screening for retinopathy in the pediatric patient with type 1 diabetes mellitus. Pediatrics 2005;116:270–273. 6. Xia Z, Chen H, Zheng S. Alterations of retinal pigment epithelium-photoreceptor complex in patients with type 2 diabetes mellitus without diabetic retinopathy: a cross-sectional study. J Diabetes Res 2020;2020:9232157. 7. Prakasam RK, Matuszewska-Iwanicka A, Fischer DC, et al. Thickness of intraretinal layers in patients with type 2 diabetes mellitus depending on a concomitant diabetic neuropathy: results of a cross-sectional study using deviation maps for OCT data analysis. Biomedicines 2020;8:190. 8. Li Z, Alzogool M, Xiao J, et al. Optical coherence tomography angiography findings of neurovascular changes in type 2 diabetes mellitus patients without clinical diabetic retinopathy. Acta Diabetol 2018;55:1075–1082. 9. Nesper PL, Roberts PK, Onishi AC, et al. Quantifying microvascular abnormalities with increasing severity of diabetic retinopathy using optical coherence tomography angiography. Invest Ophthalmol Vis Sci 2017;58:BIO307–BIO315. 10. Li ST, Wang XN, Du XH, Wu Q. Comparison of spectral-domain optical coherence tomography for intra-retinal layers thickness measurements between healthy and diabetic eyes among Chinese adults. PloS One 2017;12:e0177515. 11. Cooke DW, Plotnick L. Type 1 diabetes mellitus in pediatrics. Pediatr Rev 2008;29:374–384; quiz 385. 12. Fureman AL, Lilja M, Lind T, et al. Comparing continuous subcutaneous insulin infusion and multiple daily injections in children with Type 1 diabetes in Sweden from 2011 to 2016-A longitudinal study from the Swedish National Quality Register (SWEDIABKIDS). Pediatr Diabetes 2021;22:766–775. 13. Steineck I, Cederholm J, Eliasson B, et al. Insulin pump therapy, multiple daily injections, and cardiovascular mortality in 18,168 people with type 1 diabetes: observational study. BMJ 2015;350:h3234. 14. Weissberg-Benchell J, Antisdel-Lomaglio J, Seshadri R. Insulin pump therapy: a meta-analysis. Diabetes Care 2003;26:1079–1087. 15. Alam M, Zhang Y, Lim JI, et al. Quantitative optical coherence tomography angiography features for objective classification and staging of diabetic retinopathy. Retina 2020;40:322–332. 16. Inanc M, Tekin K, Kiziltoprak H, et al. Changes in retinal microcirculation precede the clinical onset of diabetic retinopathy in children with type 1 diabetes mellitus. Am J Ophthalmol 2019;207:37–44. 17. Li T, Jia Y, Wang S, et al. Retinal microvascular abnormalities in children with type 1 diabetes mellitus without visual impairment or diabetic retinopathy. Invest Ophthalmol Vis Sci 2019;60:990–998. 18. Corvi F, Corradetti G, Parrulli S, et al. Comparison and repeatability of High resolution and High speed scans from spectralis optical coherence tomography angiography. Transl Vis Sci Technol 2020;9:29. 19. Zabeen B, Craig ME, Virk SA, et al. Insulin pump therapy is associated with lower rates of retinopathy and peripheral nerve abnormality. PloS One 2016;11:e0153033. 20. Foster NC, Beck RW, Miller KM, et al. State of type 1 diabetes management and outcomes from the T1D exchange in 2016-2018. Diabetes Technol Ther 2019;21:66–72. 21. Blair JC, McKay A, Ridyard C, et al. Continuous subcutaneous insulin infusion versus multiple daily injection regimens in children and young people at diagnosis of type 1 diabetes: pragmatic randomised controlled trial and economic evaluation. BMJ 2019;365:l1226. 22. Reid LJ, Gibb FW, Colhoun H, et al. Continuous subcutaneous insulin infusion therapy is associated with reduced retinopathy progression compared with multiple daily injections of insulin. Diabetologia 2021;64:1725–1736. 23. Quirós C, Giménez M, Ríos P, et al. Long-term outcome of insulin pump therapy: reduction of hypoglycaemia and impact on glycaemic control. Diabetic Med 2016;33:1422–1426. 24. Scott ES, Januszewski AS, Carroll LM, et al. Continuous subcutaneous insulin infusion alters microRNA expression and glycaemic variability in children with type 1 diabetes. Scientific Rep 2021;11:16656. 25. Götze A, von Keyserlingk S, Peschel S, et al. The corneal subbasal nerve plexus and thickness of the retinal layers in pediatric type 1 diabetes and matched controls. Scientific Rep 2018;8:14. 26. Scarinci F, Picconi F, Virgili G, et al. Single retinal layer evaluation in patients with type 1 diabetes with no or early signs of diabetic retinopathy: the first hint of neurovascular crosstalk damage between neurons and capillaries? Ophthalmologica 2017;237:223–231. 27. Prakasam RK, Röhlig M, Fischer DC, et al. Deviation maps for understanding thickness changes of inner retinal layers in children with type 1 diabetes mellitus. Curr Eye Res 2019;44:746–752. 28. El-Fayoumi D, Badr Eldine NM, Esmael AF, et al. Retinal nerve fiber layer and ganglion cell complex thicknesses are reduced in children with type 1 diabetes with no evidence of vascular retinopathy. Invest Ophthalmol Vis Sci 2016;57:5355–5360.
留言 (0)