
記住我

A Markov cohort model was developed in R [12, 13] to evaluate the cost-effectiveness of the NHS DPP compared with usual care, from the perspective of the English NHS. A model was developed as it is likely that many of the benefits of the NHS DPP occur in the long-term, beyond that which can be observed using routinely collected data. The model code is available via the author’s GitHub repository [14].
2.1 Interventions AnalysedTwo strategies were considered: (1) usual care and (2) referral to the NHS DPP, in addition to usual care. In this instance, usual care was defined as what existed prior to the introduction of the NHS DPP. Guidance from the National Institute for Health and Care Excellence (NICE), first published in 2012, recommends that individuals with non-diabetic hyperglycaemia be offered a blood test and assessment of their body mass index at least once a year [15]. The intervention evaluated was a referral to the NHS DPP. An individual referred to the programme is free to take up as much or as little of the programme as they wish. The usual programme pathway comprises of first, an initial assessment and then a series of group-based sessions. Depending on the provider, there are either 13 or 18 total sessions. Further details about the programme can be found in Barron et al. [16].
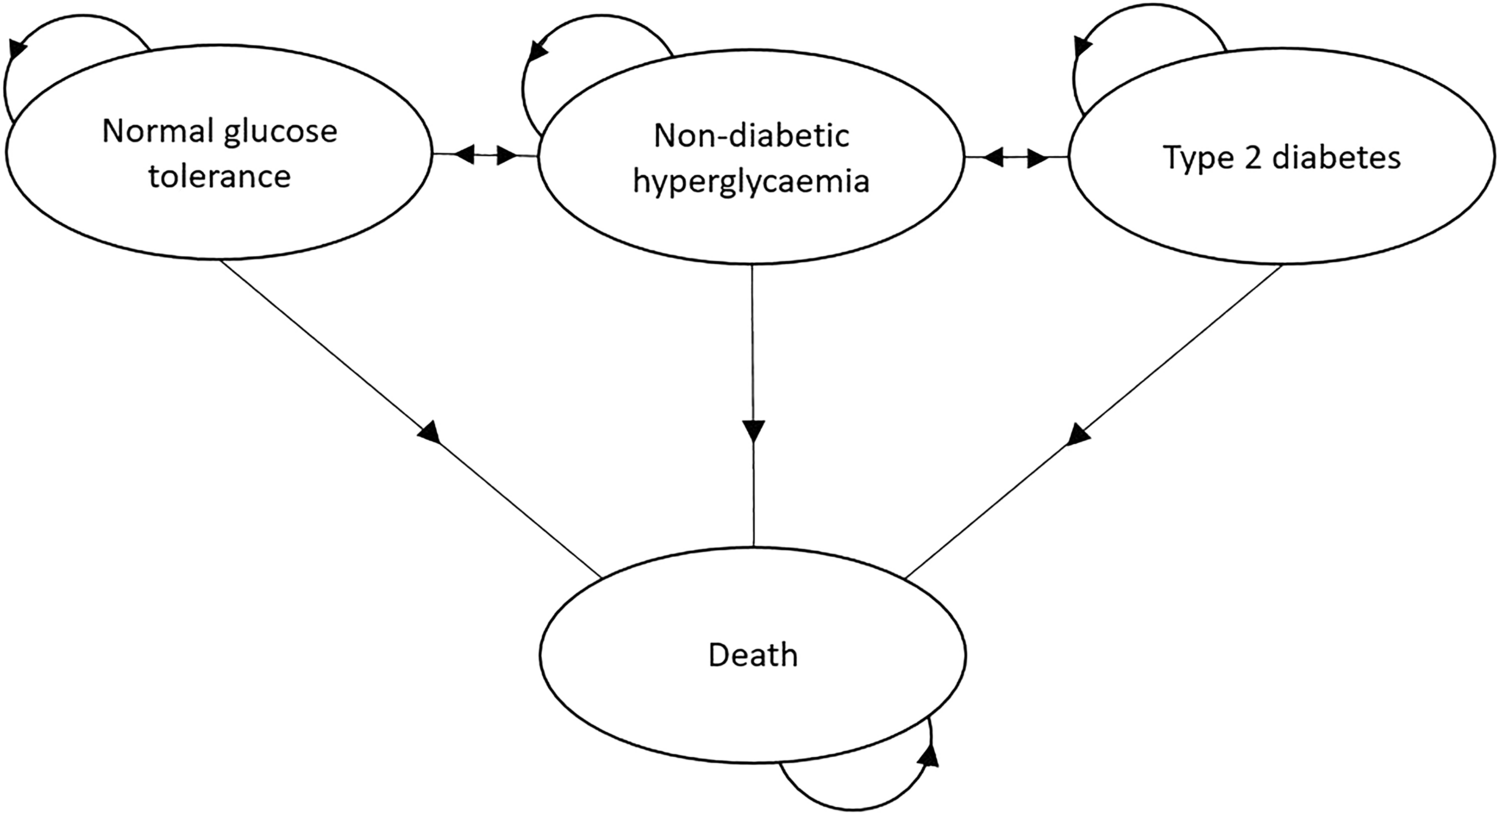
2.2 Model StructureA Markov model was used due to the chronic nature of type 2 diabetes, which involves recurring events and continuous risk over time [17]. The model comprises the following states: ‘Normal glucose tolerance’ (HbA1c <42 mmol/mol [6.0%]), ‘Non-diabetic hyperglycaemia’ (HbA1c within the range of 42–47 mmol/mol [6.0–6.4%]), ‘Type 2 diabetes’ (HbA1c >47 mmol/mol [6.4%]) and ‘Death’. These states are mutually exclusive and exhaustive. A diagram of the model and the possible transitions between each of the states is shown in Fig. 1.
Fig. 1
In the model, it is possible for individuals in the ‘Non-diabetic hyperglycaemia’ state to transition to the ‘Normal glucose tolerance’ state, remain in ‘Non-diabetic hyperglycaemia’, progress to ‘Type 2 diabetes’ or ‘Death’. Individuals in the ‘Type 2 diabetes’ state can remain in the state, return to ‘Non-diabetic hyperglycaemia’ or die (‘Death’). However, individuals in the ‘Type 2 diabetes’ state cannot directly transition to ‘Normal glucose tolerance’ and likewise, it is not possible for individuals in the ‘Normal glucose tolerance’ state to directly transition to ‘Type 2 diabetes’.
The model structure was developed by reviewing existing model structures and in collaboration with a clinical expert. This structure is also used elsewhere [18,19,20,21]. Roberts et al. [18] also state that this structure was developed following a review and in collaboration with a multi-disciplinary clinical team. It is believed that this structure captures the clinical reality of the disease.
2.3 Model ParametersThe transition probabilities from and to each of the model states are described in Table 1, in terms of the point estimates and sampling distributions used. Where possible, age-specific transition probabilities were sought for the following age groups: <40, 40–49, 50–59, 60–69, 70–79 and 80+ years, although this was not possible for all parameters.
Table 1 Transition probabilities and distributions usedThe NHS DPP-specific parameters were obtained from data used for the national evaluation of the programme. Other parameter values were obtained from peer-reviewed literature. The way these parameters were sourced and derived, as well as justifying where choices were made between sources, are described fully in the ESM (1.2. Transition Probabilities).
2.4 Costs and OutcomesTable 2 shows the costs used for each of the model states along with the sources for these values. Costs considered were from the perspective of the NHS and with a price year of 2020. Whilst there is not a state associated with type 2 diabetes-related complications in this model, the cost distribution used for the ‘Type 2 diabetes’ state was sourced from two studies which costed the healthcare resource use of a population of individuals with type 2 diabetes. As such, it is expected that they will have incorporated a range of disease severity, including those experiencing diabetes-related complications, which will then be reflected in the cost distribution used in this model. Model outcomes were in terms of quality-adjusted life-years (QALYs). To calculate these, each of the model states were assigned utility scores, which were then used to calculate QALYs depending on the time spent in that state. Table 3 shows the values used along with the sources of these. Further information on how these sources were selected is available in the ESM (1.3. Costs and 1.4. Utility Scores).
Table 2 Costs associated with each state of the model (2020 price year)Table 3 Utility scores associated with each state of the modelTo derive the cost of the NHS DPP, data collected by providers on programme session attendance up to April 2019 was used along with commercially sensitive contract data provided by NHS England to determine the average cost of each referral made to the programme. Briefly, providers were paid according to five milestones of programme attendance. Each milestone included a set number of programme sessions and providers received a percentage of the total programme cost for a milestone met, if an individual attended at least 60% of sessions within that milestone. The percentage reimbursement attributed to each milestone and the total programme cost could vary depending on the contract of that provider, as providers competitively bid to deliver the programme. The programme data collected by providers was subject to validation checks by NHS England. Implementation costs for the NHS DPP were provided to regions by NHS England as part of a wider diabetes agenda and therefore how these costs were used varied. NHS England stated that the exact amount used towards NHS DPP implementation could not be estimated, and as such, estimates for the implementation costs of the programme were sourced from the original impact assessment [11]. Further detail on the reimbursement of providers is provided in McManus et al. [22]. Analysis of the provider attendance data and information on the provider contracts showed that the average cost per referral received up until April 2019 was £118.98 (standard deviation [SD] 117.54), weighted by provider, with an additional £22.79 per referral estimated due to implementation costs of the programme [22]. This was based on the 384,611 referrals received prior to April 2019, which had attended on average 3.0 sessions (SD 4.6). The time point of April 2019 was used to allow for all referrals to theoretically have the time to complete all programme sessions based on the follow-up data available (April 2020).
As a probabilistic version of the model was implemented, point estimates were transformed into distributions using their respective means and standard errors. Beta distributions were used for transition probabilities and utility estimates, and Gamma distributions for costs. The formulas used to derive the shape parameters for each of these distributions are detailed in the ESM (1.5. Distributions).
2.5 NHS DPP EffectivenessThe effect of the NHS DPP was modelled in two ways. The first considered the utility gains obtained directly from individuals participating in the programme, which were attributed to all individuals for the first cycle of the model. Previous regression analysis using EQ-5D responses recorded at initial assessment and final programme sessions showed that for each session attended, an individual gains a 0.0042 increase in utility (95% CI 0.0025–0.0059) [22]. Provider data was used to determine the average number of sessions attended for all referrals up until April 2019 within the age categories of <40, 40–49, 50–59, 60–69, 70–79 and 80+ years, to then calculate the average utility benefit. These estimates were then applied to the starting cohort of the NHS DPP in the model according to the proportion of the cohort in each age category.
The second measure of NHS DPP effect considered the long-term effect of the programme in terms of delaying or preventing type 2 diabetes. For this, analysis conducted as part of the wider NHS DPP evaluation was used, which estimated the impact of being referred to the NHS DPP compared with not being referred, using a matched analysis. This analysis found an adjusted hazard ratio of 0.80 (95% CI 0.73–0.87) for developing type 2 diabetes within 36 months [23]. There was also no evidence of a ‘rebound’ effect, which may have been expected after an individual left the programme and returned to previous lifestyle habits. When modelling the cohort exposed to the NHS DPP, this hazard ratio was applied to the transition probability for transitioning from ‘Non-diabetic hyperglycaemia’ to ‘Type 2 diabetes’. In the base case, it was assumed that this effect was maintained for three model cycles, akin to the time horizon of effect within the observed analysis.
For both costs and outcomes, a discount rate of 3.5% was used as recommended by the NICE Reference Case [24]. A common price year of 2020 for all costs was used and where applicable, costs were inflated using the annual Office for National Statistics Consumer Price Index (All items) [25]. The price year of 2020 was used as this study evaluates the first framework of the NHS DPP which ran from 2016 to 2020, and so the most up-to-date costs relative to this time were used.
2.6 Cost-Effectiveness AnalysisA cohort of 1000 individuals was simulated, all of whom began in the ‘Non-diabetic hyperglycaemia’ state. A model cycle length of 1 year was used, and the model was run over a total of 35 cycles. To better reflect the reality of individuals referred to the NHS DPP, six age groups were considered (<40, 40–49, 50–59, 60–69, 70–79 and 80+ years) within this cohort based on the observed age composition of individuals referred to the programme prior to April 2020. As such, 5.8% of this cohort began at an age of 34 years, 12.2% started at 45 years, 21.9% started at 55 years, 26.7% started at 65 years, 24.4% started at 75 years and 9.0% started at 84 years.
The annual cycle length is consistent with the natural history of type 2 diabetes and is commonly used in other modelling studies in this disease area. A within-cycle correction [26, 27] was also applied to account for the fact that transitions could occur at any point during the cycle and not at a discrete point in each cycle.
For the primary analysis, a probabilistic analysis with 10,000 Monte Carlo simulations was run. Running a probabilistic analysis as the base case of the model is in line with current recommendations by NICE [24] and academic debate [28, 29].
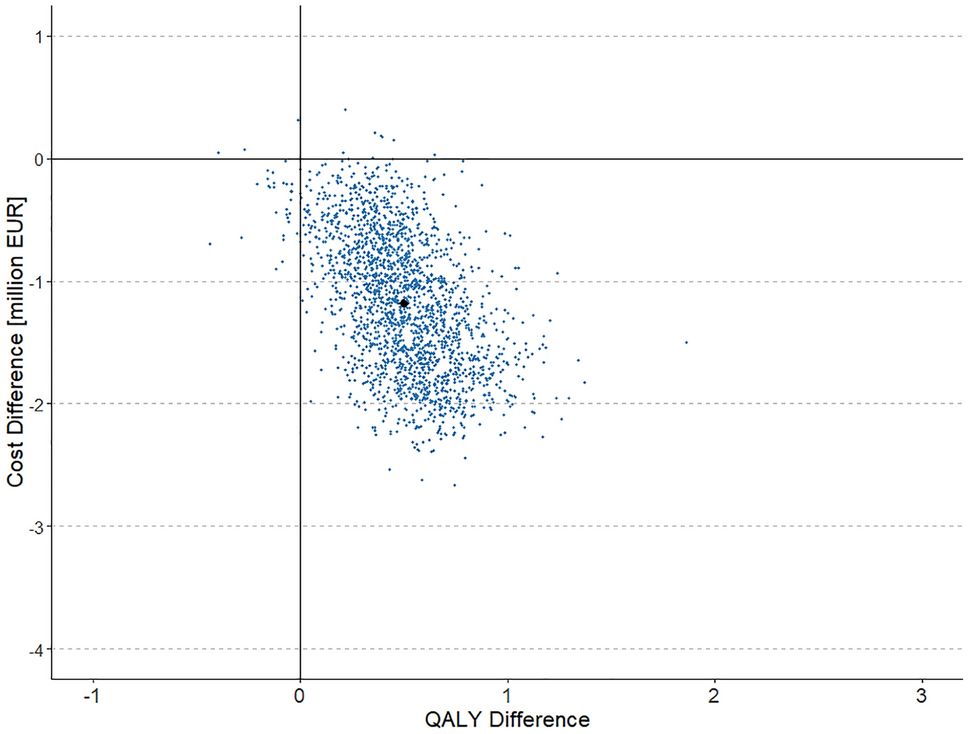
Using the 10,000 Monte Carlo simulations, the expected costs and QALYs accrued for usual care and for the NHS DPP were calculated. From this, the incremental costs and QALYs gained by the programme were estimated, averaged across the Monte Carlo simulations. The average incremental cost and QALYs associated with each individual for each of these simulations were plotted in a scatter plot to display the uncertainty around the simulation estimates.
The NHS DPP was considered cost-effective if the incremental cost per additional QALY gained was below the currently accepted willingness-to-pay threshold. For this analysis, two thresholds of £20,000 and £30,000 were considered, as these are the commonly used thresholds by NICE [24]. The NHS DPP was considered to dominate usual care if it incurred less costs and generated more QALYs over the course of the model (or be dominated if the converse was true).
The incremental net monetary benefit was also calculated, estimated as the average incremental benefit, multiplied by the willingness-to-pay threshold, minus the incremental cost of the programme. Here, a positive net monetary benefit amount would mean that the NHS DPP would be considered cost-effective, with higher values being more cost-effective than lower values. The probability of the NHS DPP being cost-effective compared with usual care was calculated at £20,000 and £30,000 per QALY by counting the proportion of simulations for which the incremental net benefit was positive.
Lastly, a cost-effectiveness acceptability curve (CEAC) was plotted. The CEAC shows the probability that the NHS DPP is cost-effective compared with usual care for a range of willingness-to-pay thresholds.
2.7 Impact of the NHS DPPThe results of the simulated cohort of 1,000 were then used along with the number of actual referrals received by the NHS DPP (526,283 referrals received by 31st March 2020) to estimate the total incremental costs and benefits incurred for the whole of the programme.
2.8 Sensitivity AnalysesFinally, the sensitivity of the analyses were explored according to several scenarios. Firstly, different levels of effectiveness of the NHS DPP were considered, in terms of the length of time for which the probability of transitioning to ‘Type 2 diabetes’ from ‘Non-diabetic hyperglycaemia’ was reduced. In the base-case analysis, a hazard ratio of 0.80 was applied to this transition probability for three cycles of the model. This effectiveness was based on what has been observed from analysis of routinely collected data. In sensitivity analyses, two different scenarios were considered for the continued effectiveness of diabetes prevention. The first scenario was based on evidence from the US Diabetes Prevention Programme (US DPP), a large clinical trial evaluating three different treatment groups: placebo, metformin and a lifestyle programme. This study found that there was still an observable effect in diabetes incidence at 10 years following the lifestyle programme (a hazard ratio of 0.66 at 10 years from 0.42 after 3 years) in comparison with placebo [30]. Calculating the equivalent proportional change for the 0.80 hazard ratio observed in the NHS DPP base case, this would be equivalent to an effect of 0.88, assumed to be maintained for 7 years, after which there was no lasting effect of the programme.
The second sensitivity analysis used subsequent analysis of the US DPP which showed that after 15 years there was still an observable difference between the lifestyle programme arm and placebo, with a hazard ratio of 0.73 [31]. As above, the equivalent proportional change was calculated and it was assumed that this effect would be observed for the subsequent 5 years, with the hazard ratio going from 0.80 (3 cycles) to 0.88 (7 cycles) to 0.91 (5 cycles), after which the risk of diabetes returned to normal.
There were also several sources for model parameters that could have been selected. As such, an alternative source for the costs associated with each of the model states was used, which was used in another published model [18]. In this modelling study, the authors assumed an annual cost of £773.00 (standard error [SE] 102.63) for normal glucose tolerance, a cost of £869.00 (SE 104.56) for non-diabetic hyperglycaemia and an annual cost of type 2 diabetes which increased linearly over 15 years from £1179.00 to £2939.00 (SE 270.00). These costs used a price year of 2015. As in the current study a Markov cohort model was implemented, it was not possible to determine how long an individual had remained in the ‘Type 2 diabetes’ state, and so instead the average of this range was used, £2059. These estimates were inflated to the 2020 price year using Shemilt et al. [32] to obtain the following annual cost estimates: £853.48 (SE 113.32) for ‘Normal glucose tolerance’, £959.47 (SE 115.45) for ‘Non-diabetic hyperglycaemia’ and £2273.37 (SE 298.11) for ‘Type 2 diabetes’.
The uncertainty surrounding the parameters of transition to ‘Type 2 diabetes’ from ‘Non-diabetic hyperglycaemia’ was also explored. In the base case, this was sourced from analysis of routinely collected primary care data and produced a probability of 0.0249. However, this produced a lower probability than what has been reported in other studies (particularly clinical trials), and therefore what has been used in other modelling studies. Therefore, the impact of using two higher rates was explored, the first reported by Herman et al. [33], who used data from the US DPP data to obtain a transition probability of 0.108, and the second used by Leal et al. [34], who reported an event rate of 80.4 per 1000 person-years for their base case (equivalent to a transition probability of 0.077). Neither of these estimates presented the different transition rates across age categories, and as such it was assumed to be the same rate across all ages modelled.
Finally, the uncertainty around utility scores was also explored. An alternative source to estimate the utility score of individuals with type 2 diabetes was used. In the base case, the utility scores were estimated from data obtained from the Health Survey for England, using responses from 491 individuals. Whilst using data from the survey enabled utility estimates for different age categories to be obtained, this sample size was relatively low and there was no information about the length of time an individual was diagnosed with diabetes or if they were suffering from any diabetes-related complications. Instead, estimates presented by Keng et al. [35] detailing the health utility score of 11,683 individuals with established diabetes (93.9% with type 2 diabetes and 6.1% with type 1 diabetes) were used in a sensitivity analysis. This population had a mean diabetes duration of 16.4 years and 14.7% were recorded as having at least one comorbid adverse event. The utility scores presented by Keng et al. [35] were not broken down by diabetes type or age category, and thus the mean utility score presented (after imputation) of 0.771 (SD 0.221) was used to derive the Beta distribution, which was used for all age categories in the model. The final sensitivity analysis considered there to be zero utility benefit from the programme session attendance. Whilst the utility benefits associated with session attendance included in the base case analysis of the model were sourced from analysis of EQ-5D data from referrals to the NHS DPP, this regression analysis was conducted only on a reduced sample of individuals who had attended both the initial assessment and final planned programme session (where the EQ-5D was recorded) and who had provided responses to the EQ-5D questionnaire. As such, there is some uncertainty surrounding these estimates and so a conservative assumption that zero benefit was derived from session attendance was made in this sensitivity analysis.
The different sensitivity analyses conducted are described in Table 4.
Table 4 Different probabilistic sensitivity analyses conducted2.9 ValidationThe mathematical programming of the model was validated by double programming a deterministic version of the model using the point estimates described, in both Microsoft Excel and R, to ensure the same results were obtained. The parameters used in the distributions were checked by plotting the distributions and ensuring that they clustered around the point estimate they were based upon. The model outputs were also compared against results from other modelling studies in the same disease area by comparing state memberships over time to ensure the same general trends were observed.
留言 (0)