
記住我

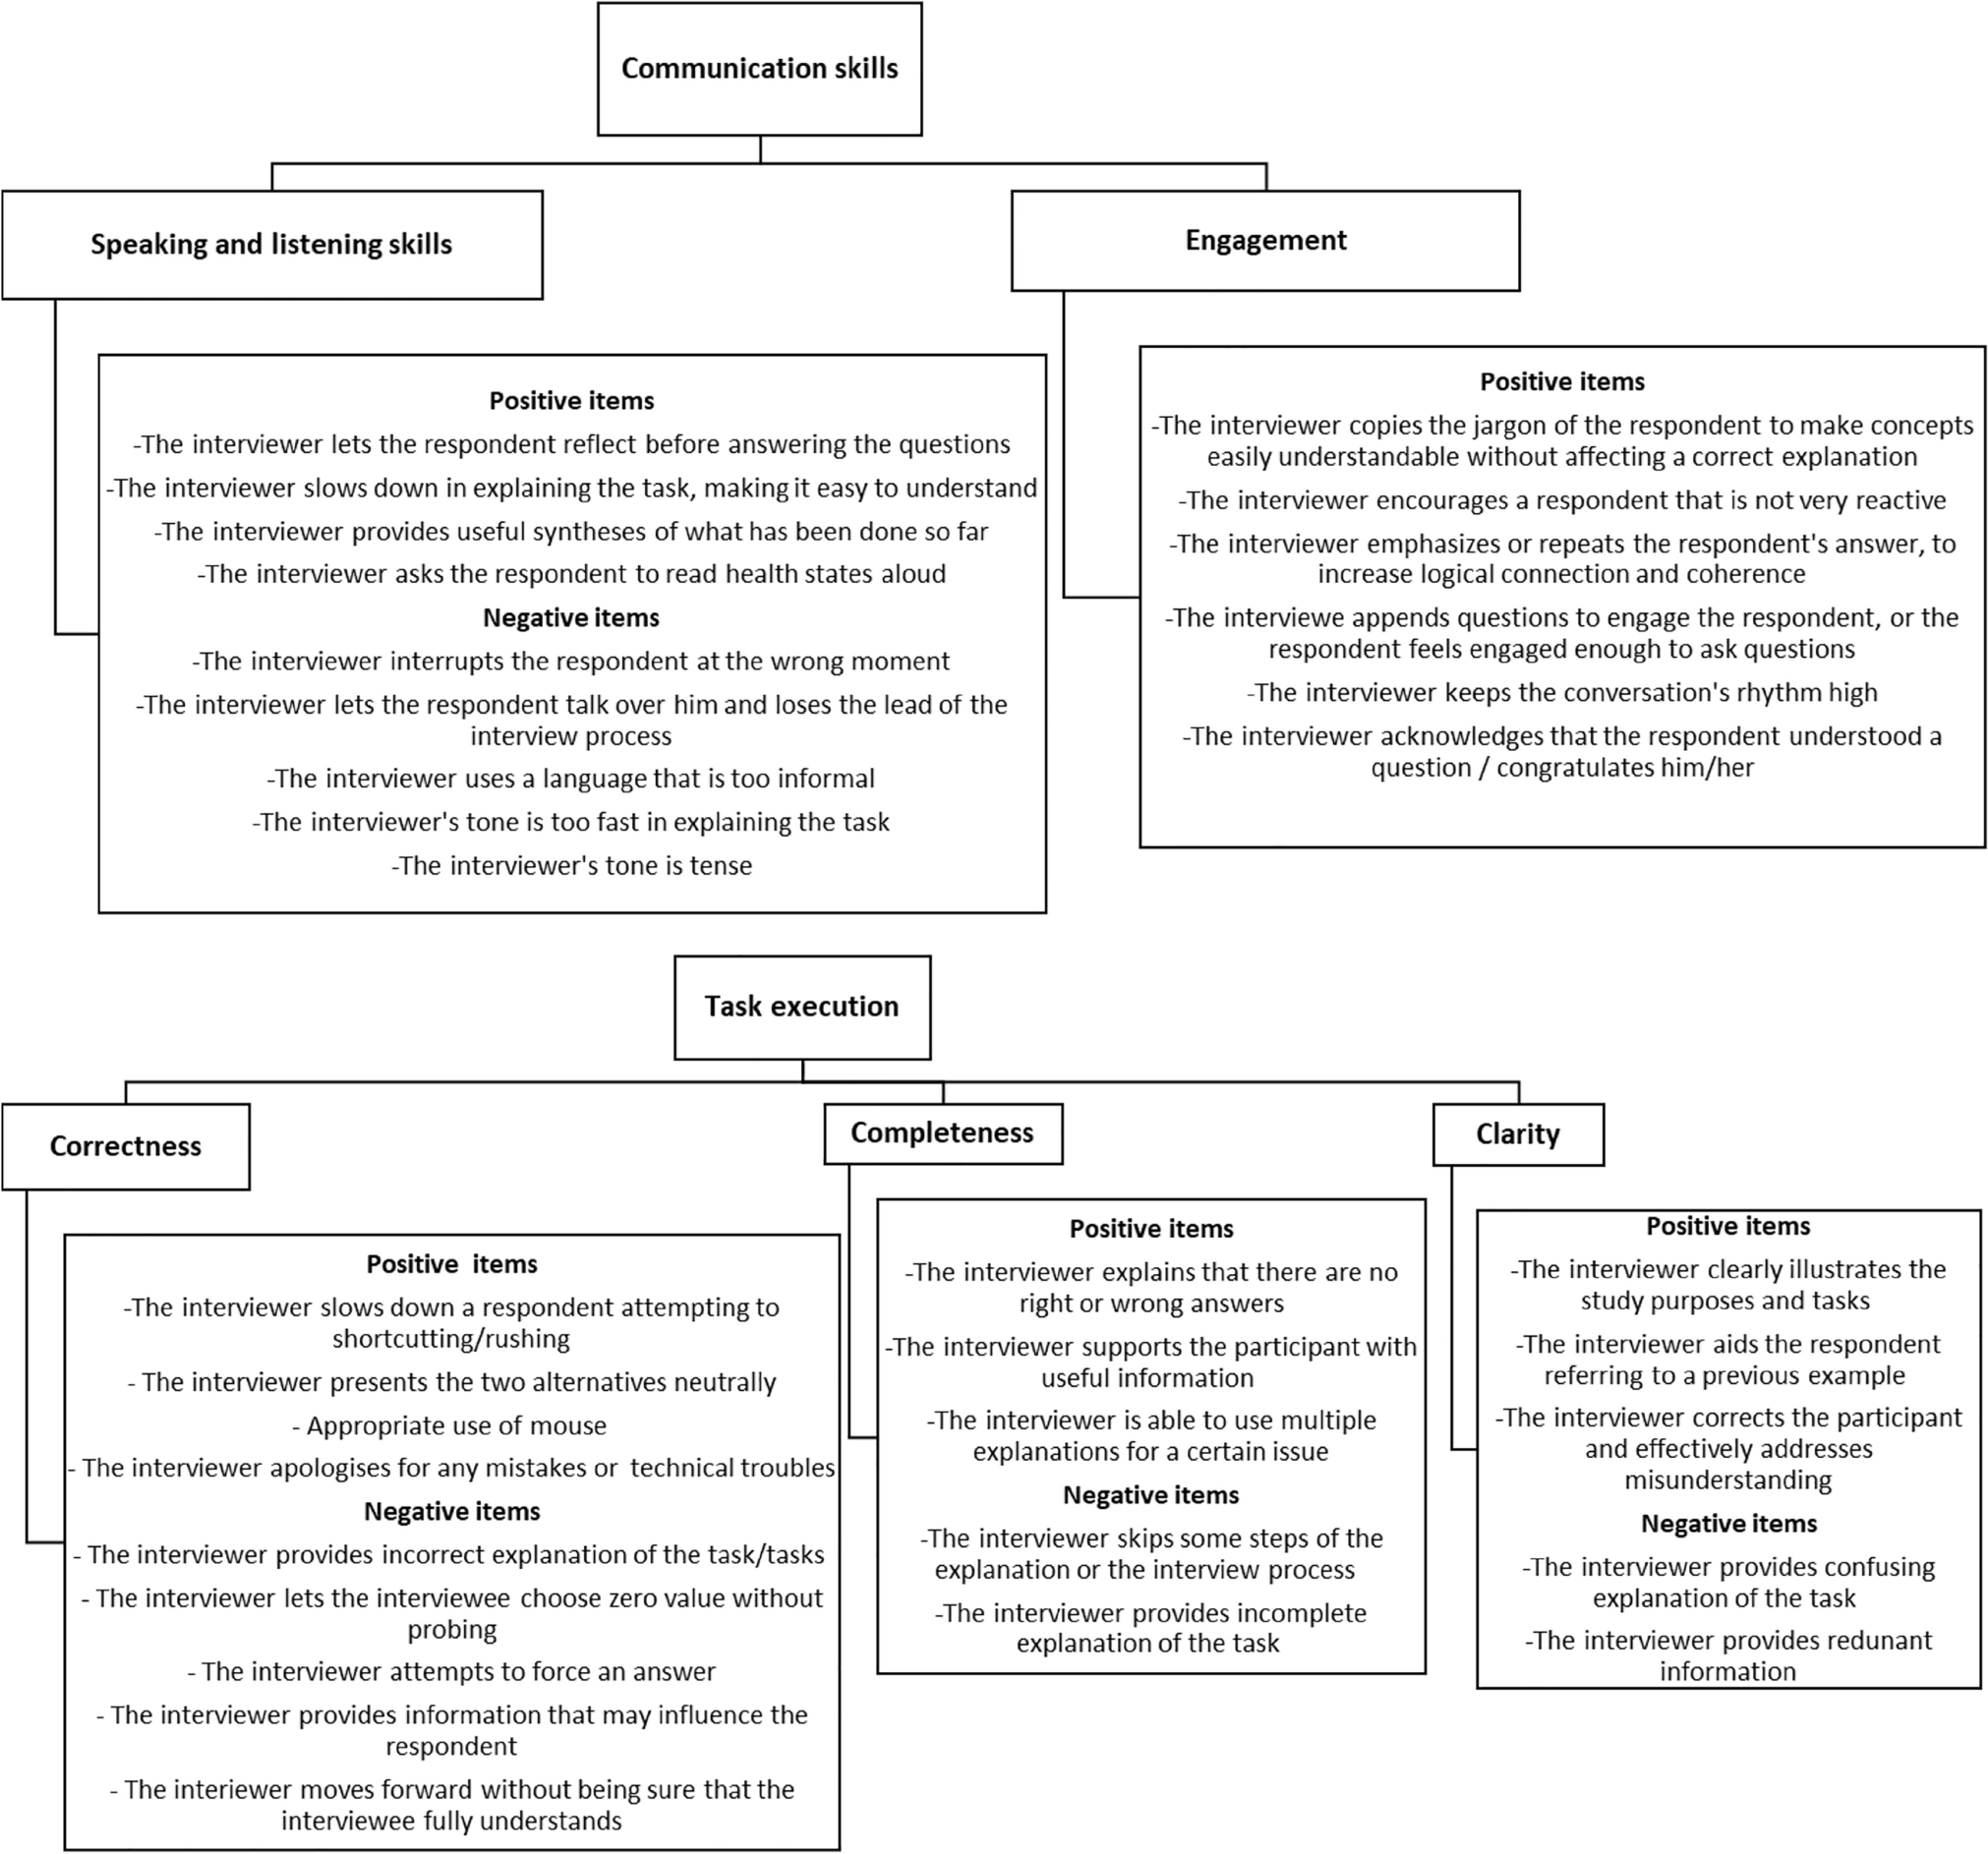

The conversational analysis identified a set of positive (n = 20) and negative (n = 14) interview patterns (Table 1). These patterns were classified into five sub-themes, which were further grouped into two main themes that referred to task execution and communication skills. The former includes positive/negative categories that refer to a correct/incorrect way to introduce and conduct the different parts and tasks of the interview, while the latter includes positive/negative categories that refer to the interviewer’s positive and negative communication practices.
Table 1 Positive and negative patternsOnline Resource Table A.3 reports themes and sub-themes associated with each of the 34 patterns, and Fig. 1 reports a graph linking each item to its corresponding theme and sub-theme. The most frequent positive patterns were related to (1) correctness of interview execution, including presenting alternatives neutrally and slowing down respondents who attempt to take shortcuts; (2) clarity, e.g., a clear explanation of the study purposes and tasks and using previous examples to enhance understanding; (3) speaking and listening skills, related to the tone of the speech and the turns between interviewer and respondent; and (4) mechanisms to attract the respondent’s attention and motivate them to perform the task well.
Fig. 1
Clusters of themes and sub-themes.
The most frequent negative patterns were related to (1) speaking and listening skills, with the interviewers being too fast in their explanation or using incorrect wording and terminologies; and (2) correctness and completeness of task execution, e.g., not making sure that the respondent understood the task or interrupting them in the wrong moment, or trying to force an answer or accepting an answer without making sure that the respondent understood the task. Table 2 presents some examples of how patterns from the conversational analysis were identified. Online Resource Table A.4 reports a list of the conversational analysis conventions used in the transcripts.
Table 2 Examples of positive and negative patternsTable 2 presents a total of six examples, including two of positive patterns (Extracts 1–2) and four of negative patterns (Extracts 3–6).
Extract 1 shows that, in two subsequent cTTO tasks, the interviewer (I) repeats several times the number of years to give up emphasizing the value, and/or s/he specifies the inverse of the trade-off for greater clarity (e.g., “give up to x years, then live only 10-x years?”). This is a way to ensure that the respondent (R) understands the task well and to increase the precision of the number of years to trade-off.
In Extract 2, the interviewer shows a positive tendency of making references to previous examples to encourage the respondent to think about the states previously evaluated and carefully weigh each level and dimension. This can be a successful way to prevent inconsistencies, e.g., when a health state is valued as worse than the 55555 state, which is the worst possible state deriving from the EQ-5D-5L descriptive system.
In Extracts 3 and 4, the interviewer tries to read the cTTO alternatives but the respondent talks over him/her and the interviewer is not able to prevent this. This signals a limited grip on the interview process.
In Extract 5 (first part), we observe that the respondent is going to select the same answer of the previous two states, where s/he had chosen to stop at 4½ years. Yet, the interviewer might be concerned about getting more diverse answers as per the QC guidelines, and so s/he ‘cheats’ and tries to force the respondent towards selecting the option of 4 years. In the second part, while the respondent is reasoning out loud before expressing his/her preference, the interviewer cuts him/her short, asking if s/he is fine with stopping at 4 years. This is likely to induce a bias towards the option suggested by the interviewer, as the respondent would probably have preferred to think more carefully about the state and s/he would have given a different answer.
Extract 6 (first part) shows a respondent that speeds up to save time, as confirmed by the fact that a decision on the years to trade-off is made right after. Furthermore, the interviewer does not attempt to slow down a respondent who is short-cutting, and in doing so, s/he forgets an important step of the interview process. Similarly, in the second part of the extract, the respondent gets to zero immediately, stating the intention to give up his/her entire lifetime, and the interviewer fails to ask some prompting questions to try to curb a hastened response trend.
Online Resource Table A.5 reports an example for each of the patterns derived from the conversational analysis exercise, with the aim of giving examples of the language, speed and tone shades that we observed in each positive or negative behavior converging to what we termed ‘patterns’. Patterns inspired from external sources [20, 21] or not verbal patterns, such as the appropriate use of mouse, are not included in the table.
3.2 Scoring the Video RecordingsThe distribution of total normalized scores as given by the two independent scorers confirms that the discrepancies among scorers were relatively small. Thus, figures in this section will show the average of the two scorers. Online Resource Table A.2 provides the Delta table of the divergence of scores between two authors (CV and GA, or MM where applicable). Figure 2 shows the distribution of positive and negative scores per interviewer across the six interviews scored for each. For most interviewers there is an improvement in positive patterns, but the size of this improvement differs across interviewers. Moreover, negative patterns decrease for most interviewers. In some cases, they increase but this is paired with an improvement in positive, meaning that the two even out, as is the case for interviewer 1. Instead, some interviewers show a rather stable trend in positive scores but a decrease in negative scores, as is the case for Interviewers 6 and 7. Interviewer 3 shows a stable increase in positive scores paired with a sharp decrease in negative scores.
Fig. 2
Total positive and negative scores across the six interviews examined for each interviewer (average of scores from two scorers)
Interestingly, for almost all interviewers ,we observed a sharp jump in the positive scores from the third interview to the fourth, namely from the last interview of Batch 1 to the first interview of Batch 2. Relatedly, for some interviewers, a consistent and decreasing trend in negative scores from the third interview (Batch 1, interview 3) to the fourth interview (Batch 2, interview 1) is observed. This might signal an improvement in positive interview practices following the verbal QC feedback that was provided to each interviewer after the second batch. The QC showed good performance of the interviewers already at baseline as there were limited to no issues in protocol compliance; however, some interviewers incurred interview-specific effects.
The standardized interview score for positive and negative outcomes is expressed on a 0–1 scale, with an average of 0.68 for positive checks and 0.49 for negative checks
Table 3 reports the average of positive and negative scores per interviewer and batch. Some interviewers, namely 3 and 7, showed both a decrease in the total score of negative items and an increase in the total scores of positive items (i.e., positive outcomes).
Table 3 Changes in overall scores from Batch 1 to Batch 2Other interviewers show mixed results, e.g., an improvement in the negative scores but a decrease in positive scores, or the other way around. A double negative outcome was only observed for Interviewer 1.
A full comparison of the results of this qualitative scoring exercise with the quantitative indicators resulting from the QC is beyond the scope of this study and remains a key avenue for further research. However, we highlight some interesting, although preliminary, results from the analysis of the main quantitative indicators of the QC, which are summarized in Table 4.
Table 4 Changes in overall scores from Batch 1 to Batch 2This table shows that interviewer 3, one of the two ‘best performers’ resulting from the qualitative scoring exercise, also shows better-than-average QC scores. Indeed, for this interviewer, we observe a duration above average for both the Worse than Death (WTD) and Better than Death (BTD) time trade-off (TTO) tasks, as well as a higher number of moves than average for both tasks.
Instead, Interviewer 1, the ‘worst performer’ of the qualitative scoring exercise, seems to perform below average for what pertains to the quantitative scores of the QC. For this interviewer, we observe a duration below average for both WTD and BTD TTO tasks and a lower number of moves than average for the TTO WTD task.
Finally, Table 5 reports those items for which there is a consistent improvement (decrease for negative and increase for positive). The only sub-theme whose items all improved from the first to the second batch was that of clarity.
Table 5 List of items improving from Batch 1 to Batch 2
留言 (0)