
記住我


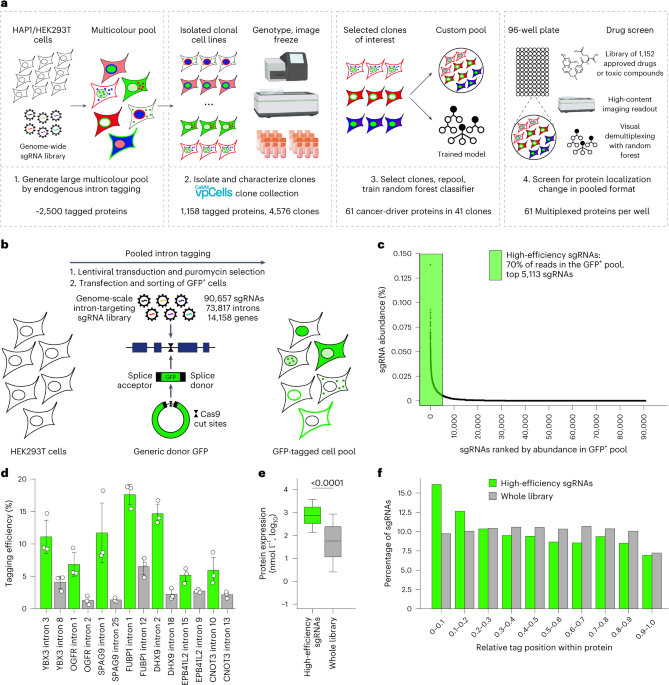
Intron-targeting sgRNA libraries were generated following a strategy we described previously19. In brief, the Ensembl BioMart data-mining tool was used to select transcripts with a Consensus Coding Sequence (CDS) ID of 19,035 human genes and to obtain chromosomal coordinates of introns for sgRNA design. For genes with multiple transcripts with a Consensus CDS ID, the transcript with the longest CDS was chosen. For each of the selected transcripts, the information on CDS start, exon frame and the exon start and end chromosomal coordinates were used to define intronic regions. To avoid selecting sgRNAs close to the exon/intron junction and disrupting splice-acceptor and splice-donor sites, only the intronic region that is at least 20 bp away from exon/intron junctions was used for sgRNA design. The GuideScan tool25 was used to select up to 20 Cas9 sgRNAs with the highest on-target scores for each intron (GuideScan database v.1.0). These guides were ranked for each intron based on a combined on- and off-target score and annotated with gene name, Ensembl transcript ID, intron number and intron frame to generate a database of 2,979,354 sgRNAs targeting 162,261 introns of 16,279 genes (available for download at vpcells.cemm.at). For the frame 0 genome-wide intron-targeting sgRNA library, the top ranked sgRNA for each intron in frame 0 was included in the library. Additionally, for genes with only two or three targetable introns, the second ranked sgRNA was also included and for genes with only one targetable intron, the third ranked sgRNA for that intron was also included in the library. Approximately 0.5% of sgRNAs in the library target regions of overlapping genes and map to introns of two primary transcripts. These sgRNAs were annotated with two introns and genes (separated by ‘|’ in their sgRNA name) and were excluded from any further analysis, because they cannot be unambiguously assigned to a single target. The frame 0 genome-wide intron-targeting sgRNA library also includes 1,000 non-targeting sgRNAs for a total number of 90,657 sgRNAs targeting 73,817 introns of 14,158 genes. The frame 1 genome-wide intron-targeting sgRNA library was generated using the same database and consists of 72,580 sgRNAs targeting 51,939 introns of 14,011 genes. Two smaller libraries were generated, targeting frame 0 and frame 1 of a total of 287 genes associated with cancer biology and consist of 2,511 and 1,763 intron-targeting sgRNAs. The genome-wide libraries have been deposited with Addgene (Human Genome-wide Intron Tagging Library, Frame 0 and Human Genome-wide Intron Tagging Library, Frame 1).
Cloning of intron-targeting sgRNA librariesLibraries were synthesized as oligonucleotide pools by Twist Biosciences and cloned into the CROPseq vector using Gibson assembly. For frame 0 libraries, the CROPseq-Guide-Puro vector was used, and for frame 1 libraries, the puromycin resistance in the vector was replaced with a blasticidin resistance before library cloning. Oligonucleotide pools were PCR amplified and the vectors were digested with BsmBI and purified. Multiple Gibson assembly reactions were performed and electroporated into Endura electrocompetent cells (Lucigen), plated on multiple bioassay dishes and plasmid DNA was isolated using multiple columns of a midiprep DNA purification kit (QIAGEN Plasmid Plus Midi kit). Library coverage was determined by counting colonies on dilution plates and was between ×200 and ×500 for the different libraries.
Minicircle productionFor the production of minicircle DNA containing a single generic sgRNA target site followed by a splice acceptor, a 20-amino acid linker sequence, the CDS of EGFP, a 20-amino acid linker sequence and a splice-donor site, the required DNA fragment was amplified from Intron-Tagging-EGFP-Donor plasmid (Addgene, #159740) and cloned into the pMC.BESPX-MCS1 parental minicircle production plasmid (System Biosciences) by EcoRV digest and Gibson assembly. Parental plasmid was transformed into ZYCY10P3S2T Escherichia coli minicircle production strain (System Biosciences MC-Easy Minicircle DNA Production kit) and a colony containing the correct parental plasmid was used for minicircle production as described by the manufacturer. In brief, bacteria were grown overnight in TB medium and on the next day, induction medium containing l-arabinose was added to induce att recombination and parental plasmid backbone degradation. Minicircle DNA was isolated from bacterial pellets using multiple columns of an endotoxin-free midiprep DNA purification kit (QIAGEN Plasmid Plus Midi kit) and the produced minicircle was analysed by restriction enzyme digest and gel electrophoresis. For generating a minicircle that is compatible with frame 1 introns and contains the CDS of mScarlet, the Intron-Tagging-EGFP-Donor plasmid (Addgene, #159740) was modified by adding 2 nucleobases after the splice acceptor and 1 nucleobase before the splice donor for in-frame splicing when targeting frame 1 introns. EGFP in that plasmid was replaced with the CDS of mScarlet-I51 before cloning the respective DNA fragment into the minicircle parental plasmid and minicircle production as described above. The parental minicircle plasmids for EGFP and mScarlet have been deposited with Addgene.
Cell cultureHEK293T (ATCC CRL-3216) cells were grown in Dulbecco’s modified Eagle’s medium (Sigma-Aldrich, D5796) supplemented with 10% fetal bovine serum, sodium pyruvate (final concentration of 1 mM) and penicillin–streptomycin. HAP1 cells (Haplogen, now Horizon Discovery, C631) were grown in Iscove’s modified Dulbecco’s medium (Sigma-Aldrich, I6529) supplemented with 10% fetal bovine serum.
TransfectionFor pooled intron-tagging experiments in HEK293T cells, 7.0 × 10⁶ cells were seeded per 15-cm dish on the day before transfection. Each 15-cm dish was transfected with 12 µg Intron-Tagging-pX330-Cas9-Blast (Addgene, #159741) and 300 ng minicircle DNA using PEI. For pooled intron-tagging experiments in HAP1 cells, 9.0 × 10⁶ cells were seeded per 15-cm dish, 6 h before transfection. Each 15-cm dish was transfected with 8 µg Intron-Tagging-pX330-Cas9-Blast (Addgene, #159741) and 300 ng minicircle DNA using PolyJet (SignaGen), as described by the manufacturer. For tagging of individual sgRNAs in an arrayed format, 5 × 10⁵ HEK293T cells were seeded in a six-well plate on the day before transfection. Cells were co-transfected using PEI with 750 ng CROPseq-Guide-Puro for intron-targeting sgRNA expression, 750 ng Intron-Tagging-pX330-Cas9-mCherry and 60 ng minicircle DNA.
Pooled protein taggingFor lentivirus production, HEK293T cells were co-transfected using PEI with sgRNA library, sPAX2 and pMD2.G. The medium was changed 12 h after transduction and virus-containing supernatant was collected after 48 h. For genome-wide tagging experiments in HEK293T or HAP1, cells were transduced with virus of the frame 0 genome-wide intron-targeting sgRNA library in CROPseq-Guide-Puro vector at a coverage of >500× to ensure library representation and at a multiplicity of infection of 0.1 to ensure single integration in most cells. After puromycin selection for 3 days, cells were expanded in puromycin-free medium for an additional 2 days before being transfected with Intron-Tagging-pX330-Cas9-Blast (Addgene, #159741) and GFP minicircle. GFP-positive cells were enriched 4 days after transfection by flow cytometry using a Sony SH800 sorter (Sony Cell Sorter Software v.2.1.6) and ultra-yield sorting settings for very high throughput at the expense of purity to obtain a cell population with ~30% GFP-positive cells. This cell population was sorted again after an additional 7 days using the standard sorting settings to obtain a pure GFP-positive cell population. For comparing editing efficiencies between cells transduced with the library and positive and negative controls, cells were only sorted 11 days after transfection, without enriching for GFP-positive cells 4 days after transfection. For genome-wide tagging experiments in HEK293T cells, a total of 1.5 × 10⁸ cells were transfected and approximately 1.0 × 10⁶ GFP-positive cells were sorted.
Construction of plasmids for fluorescent marker and visual barcode overexpressionExpression constructs for lentiviral integration and overexpression of fluorescent proteins fused to different localization signals were cloned using Gibson assembly in a vector for mammalian expression (Addgene, #52962)52. A list of all cloned plasmids for fluorescent protein overexpression are listed in Supplementary Table 9 and have been deposited with Addgene. For cloning, the vector was digested with AgeI and EcoRI, the vector backbone was gel purified and the fluorescent proteins mAmetrine53, miRFP670 (ref. 54), miRFP670nano55 and mTagBFP2 (ref. 56) were synthesized as gene fragments (Genewiz) and localization signals for nuclear localization57, cytoplasmic localization58, ER localization59 and mitochondrial localization were added via PCR before using the fragments for Gibson assembly using HiFi DNA assembly mix (NEB) as described by the manufacturer. Lentivirus containing these plasmids were produced as described above.
Multicolour cell pool generationFor the generation of multicolour cell pools, a second round of intron tagging was performed by transducing a pool of GFP-positive cells with virus of a frame 1 genome-wide intron-targeting sgRNA library in the CROPseq-Guide-Blast vector. After blasticidin selection for 5 days, cells were transfected with Intron-Tagging-pX330-Cas9-Blast (Addgene, #159741) and frame 1 mScarlet minicircle. GFP/mScarlet double-positive cells were sorted as described above. For expression of additional fluorescent markers, double-positive cell pools were transduced with lentivirus containing the expression cassettes for NLS-miRFP, membrane-mAmetrine and one (or none) of the five possible mTagBFP2 visual barcodes.
sgRNA abundance in cell poolsTo determine the sgRNA abundance in cell pools, genomic DNA was isolated with the DNA blood and tissue kit (QIAGEN). The sgRNA containing genomic region was amplified and Illumina adapters were added by PCR (see Supplementary Table 9 for primer sequences) and sequencing libraries were submitted for next generation sequencing (Amplicon-EZ, Genewiz). To quantify sgRNAs in the pools, sgRNA sequences were extracted from sequencing reads using Cutadapt and mapped to the sgRNA libraries and counted using MAGeCK.
Isolation, imaging and genotyping of clonal cell linesFor the generation of a clonal cell line collection, multicolour cell pools were seeded in 384-well plates at a density of 0.7 cells per well and expanded for 7 days. Then, 70–150 clonal cell lines per 384-well plate were trypsinized and cell suspensions were transferred to 96-well imaging plates (PerkinElmer PhenoPlate) and corresponding cell culture plates. Clones on the cell culture plate were expanded for 2 days and frozen by trypsinizing cells and mixing with freezing medium for a final DMSO concentration of 10% before transferring cell suspensions to cryotubes in 96-well racks and storage in liquid nitrogen. Clones on the imaging plates were imaged after 24 h and 48 h with an Opera Phenix high-content confocal imaging system (PerkinElmer) using the ×63 water immersion objective and imaging 6–10 FOVs per well. To identify the tagged protein in each clonal cell line that was imaged, the intron-targeting sgRNA was determined by highly multiplexed amplicon sequencing. For that, cells on the imaging plates were lysed after the last imaging step and cell lysate was used for amplification of the sgRNA containing region by PCR. PCR was conducted in 384-well plates using 24 barcoded forward primers and 16 barcoded reverse primers using a unique primer combination for each well for processing four 96-well plates together on one 384-well plate. PCR products from wells of a 384-well plate were pooled and submitted for paired-end sequencing (Amplicon-EZ, Genewiz). Sequencing reads were demultiplexed and assigned to each well using Cutadapt and mapped to sgRNA libraries using MAGeCK to obtain sgRNA read counts for each well. For assigning the identity of the GFP-tagged protein in each clone, the detected sgRNA mapping to the frame 0 libraries was used and for assigning the identity of the mScarlet-tagged protein, the detected sgRNA mapping to the frame 1 libraries was used. Only clones where an unambiguous assignment was possible were included in the clone collection. For wells with excluded clones there was either no sgRNA being detectable above background in any of the two frames or multiple sgRNAs for the same frame were detected. The criterion for a single unambiguous sgRNA in each frame was a read count more than four times that of the second most abundant sgRNA detected in a particular well. Based on our analysis of previous cell pools by integration site mapping19, a small percentage of clones may harbour additional or aberrant integrations and therefore not be correctly annotated based on sgRNA sequencing.
Comparison of localization annotationsThe comparison between subcellular localization annotations based on images of our clone collection and HPA was conducted as described previously18 for the comparison of N- or C-terminally tagged proteins with HPA. In brief, we manually annotated the protein localization of each protein present in our collection using 12 possible subcellular localizations (Supplementary Table 4). Proteins localizing to multiple compartments were annotated with up to two subcellular localizations. HPA localization data were downloaded from the HPA website and the ‘main locations’ and ‘additional locations’ were used for further analysis. To compare our annotations with the more diverse annotations in the HPA dataset, a set of consensus annotation labels were defined to make a comparison between the two sets of annotation labels possible. Exact matches were proteins with identical consensus annotations between the two datasets and partial matches were proteins annotated with two or three localizations in one dataset and only one or two of them matching with the other dataset.
Properties of sgRNA target proteins and tag positionsA publicly available HEK293T protein expression dataset was used to obtain protein expression values for sgRNA target proteins18. For calculating the hydrophobicity scores at the tag sites of proteins, the Ensembl BioMart data-mining tool was used to obtain amino acid sequences of exons flanking the sgRNA target introns and the Kyte–Doolittle scale22 was used to calculate the hydrophobicity score for a six-amino acid window comprising three amino acids before the tag site and three amino acids after the tag site. For calculating the AlphaFold confidence score, the Ensembl BioMart data-mining tool was used to obtain CDS positions of exons flanking the sgRNA target sites and to obtain UniProt IDs of the respective transcripts. The AlphaFold per-residue confidence scores (pLDDT) for the respective proteins were extracted from mmCIF files that were obtained from the AlphaFold DB website23 (AlphaFold database UP000005640_9606_HUMAN_v4) and the average of the pLDDT scores of the residue immediately before and after the tag site was calculated. All scores for sgRNAs in the genome-wide frame 0 library are included in Supplementary Table 3.
Assembly of a cell pool for pooled screening applicationsTo generate a cell pool in which every clone can be identified by computer vision, 41 HAP1 clones were selected from the clone collection and thawed individually, before being mixed together in equal proportions using a Sony SH800 cell sorter. The cell pool was expanded for 4 days and frozen in multiple aliquots of 1 × 10⁶ cells per cryotube that were thawed again for screening applications. Clones were also seeded in separate wells of a 96-well imaging plate to generate training data for building a computational model that can identify clones based on localization patterns and intensities in all channels. Each clone was seeded in two wells that were imaged 24 h and 48 h after seeding with an Opera Phenix high-content confocal imaging system (PerkinElmer) using a ×40 water immersion objective.
Compound libraryA total of 1,059 screening compounds were provided by the Molecular Discovery Platform at CeMM. A total of 439 compounds in that library were approved drugs or well-annotated chemical probes and 620 compounds were antiproliferative, drug-like screening compounds with an unknown mechanism of action. Commercially available compounds were used without further purification. For compound Z384372236 we have evidence that an oxidation product acts as the active XPO1 inhibitor. Compounds dissolved in DMSO were provided in 12 compound plates at a final screening concentration of 10 μM for the majority of compounds (Supplementary Table 8).
Pooled screening conditionsFor screening of the multicolour cell pool of 41 HAP1 clones, cells were seeded in 12 96-well imaging plates (PerkinElmer PhenoPlate) at a concentration of 2,500 cells per well. At 56 h after seeding, 100 FOVs (approximately one-third of the entire well area; each FOV has a resolution of 1,080 × 1,080 pixels) were imaged per well with an Opera Phenix high-content confocal imaging system (PerkinElmer) using a ×40 water immersion objective. For the treatment of cells with compounds, medium was added to compound plates for pre-diluting compound stocks, before transferring pre-diluted compounds to imaging plates for a final compound concentration of 10 µM and 0.1% DMSO for the majority of compounds. At 6 h after treatment, the same FOVs in compound-treated wells were imaged again as described above.
Calculation of the expected number of cells per well in pooled screenThe well diameter of a PerkinElmer PhenoPlate 96-well plate is 6.4 mm, corresponding to a well area of 32.17 mm2. The size of a single FOV at ×40 magnification is 0.1027 mm2 (1 pixel = 0.2967 µm). Therefore, 100 FOVs cover approximately 0.32 of the area of the entire well. Imaging after 56 h and using an estimated doubling time of HAP1 cells of 14 h, an entire well and 100 FOVs should contain 40,000 and 12,800 cells, respectively.
Computational processingImaging datasets were analysed using Python v.3.9.15 at the CeMM high-performance computing cluster, using Slurm Workload Manager v.21.08.8. The code and detailed descriptions of the conda environments with package versions are deposited at https://github.com/reinisj/intron_tagging. Before analysis, flatfield correction was performed on the generated imaging data using Harmony software v.6 (PerkinElmer)60.
Segmentation of cells and nuclei, 1:1 mapping and filtering to high-quality cellsCell masks were generated based on the mAmetrine-labelled membrane channel with the ‘cyto’ model of cellpose27 v.0.6.1, setting the diameter to 80 pixels. Segmentation of nuclei was performed with nucleAIzer26 (nucleaizer-backend 0.2.1) on the miRFP670-labelled nuclear channel employing the mask_rcnn_general model61 with default_image_size parameter set to 2,048 and a diameter of 60. Using custom scripts in Python, masks of cells and nuclei were combined by 1:1 mapping, and additional filtering was performed to obtain high-quality cells. Nuclei larger than 750 pixels were assigned to cells larger than 1,500 pixels, if their overlap was at least 0.66 of the total area of the nucleus. Only cells with a single assigned nucleus were considered further. To remove artefacts and most apoptotic cells, cells were filtered based on their N:C ratio (defined as the area of the nucleus divided by the entire cell), using the minimal threshold of 0.20 and maximal threshold of 0.65. For each cell, the number of immediate neighbours was determined by expanding its cell mask by 5 pixels and detecting the overlapping cells. To remove additional apoptotic cells, stricter filtering criteria were performed for mapped cells without any neighbours and nucleus and cell area below 2,000 and 5,000, respectively. Descriptors of solidity and eccentricity were calculated for the cell and nuclei objects using the measure.regionprops module of scikit-image62, v.0.19.1. Mapped cells with cell solidity above 0.95 and the sum of cell and nuclear eccentricity above 1.4 were discarded. Finally, mapped cells with nuclei within 2 pixels of the FOV edge were removed. For the remaining high-quality cells, three object masks were saved: (1) entire cell, (2) nucleus and (3) cytoplasm, defined by subtracting the nucleus from the entire cell.
Feature extraction, random forest modelsFor each of the three objects associated with a high-quality cell, 501 descriptor variables (Supplementary Table 5) were extracted with CellProfiler v.4.2.1 (ref. 28), using all five fluorescent channels as input for each FOV. A random forest model was trained on 1,455 intensity-based features, not including 48 features describing area and shape. The scikit-learn library63 (v.1.1.3) implementation of random forest was used, with default hyperparameters. The dataset used for training consisted of four measurements (each clone seeded in two plates with a different layout, imaged at two time points). This corresponds to 12 combinations where the train and validation sets are different (Fig. 3d,e). The final model was trained on the entire dataset comprising all four measurements.
Dimensionality reduction of CellProfiler featuresUsing the vpCells atlas dataset (3,469,778 cells), we first reduced the set of 274 CellProfiler features per single channel to 90 non-redundant variables by calculating Pearson’s correlation between all pairs and iteratively discarding features with correlation above 0.9 to others (Supplementary Table 5). Second, a two-dimensional representation was obtained by running the UMAP algorithm64 on all cells, using the Python implementation v.0.1.1 (ref. 65) with default hyperparameters. Finally, we calculated the mean UMAP dimensions for each protein across all its cells.
Detection of clones in pool before and after perturbationFor each of the two time points imaged in the pooled screen (pre-treatment and t = 6 h post-treatment), a slightly different strategy was applied. For the pre-treatment measurement, a single random forest model trained on unperturbed clones using the full range of 1,455 features was employed. For the post-treatment measurement, where the phenotype of clones is poised to change, an ensemble of models was used. The first component was to use the predictions from the earlier time point to restrict the set of possible clone labels to those present within a radius of 350 pixels (104 μm) of the target cell (Extended Data Fig. 6f,g). For each target cell and clone class, a clone weight (w) score was calculated, aggregating the number and distances of cells of the given predicted clone class within the neighbourhood of the cell:
$$_},}}=\mathop\limits_^_},}}}_}\right)}^$$
where c is the target cell, l is the clone class (label), di is the distance of a cell of the class in the previous time point within the considered radius. The second component were four random forest models trained on unperturbed clones but using different subsets of channels: (1 and 2) all channels but GFP/mScarlet, 1,134 features; (3) BFP and structural channels, 828 features; and (4) BFP barcodes only, 261 features (Supplementary Table 5). The final score for each target cell was calculated as follows:
$$_},}}=_},}} \sum _}_}$$
where sc,l is the final score, w is the spatial clone weight and prf is the output probability of a channel subset-trained random forest model.
Detection of hits in pooled screenHit calling was performed using the selected subset of 90 CellProfiler features. We defined a hit calling setting as the unique combination of compound treatment, sgRNA and clone. For each hit calling setting, perturbed cells were compared against unperturbed cells of the same clone and sgRNA (merged dataset DMSO controls wells from all plates) across all 90 features using two-sided Welch’s unequal variances t-test implemented in the scipy library66 v.1.9.3. Adjusted P values were obtained by Bonferroni multiple testing correction. As a measure of effect size, z-scores were calculated. For each setting, an ‘aggregating score’ was calculated by counting the number of features with adjusted P value below 0.05, absolute value of z-score above 1.5 and at least 50 treated and 100 control cells available. Settings with aggregating score of 5 or higher were considered hit candidates and inspected manually, as long as they did not involve an autofluorescent compound (n = 30) (Supplementary Table 8).
Processing of images for visual inspection using quantile normalization and CLAHEFor visual inspection and the vpCells database, flat-field-corrected 16-bit TIFF images were quantile normalized and saved as eight-bit JPEG images. The quantile normalization was applied separately to each image and channel and consisted of two steps. First, intensity values for lower (minq = 0.05) and upper (maxq = 0.9975) quantile thresholds were calculated. Pixel values above the upper or below the lower threshold were set to the threshold. Second, the adjusted image was linearly rescaled to [0,1] range. For stitched images containing multiple FOVs, contrast limited adaptive histogram equalization67 was applied before quantile normalization, using the opencv library in Python v.4.7.0. For extraction of CellProfiler features, the flatfield-corrected 16-bit TIFF files were used directly without any of the steps described in this paragraph.
Western blotCell pellets were resuspended lysed for 30 min at 4 °C in RIPA buffer containing 1× Complete, EDTA-free protease inhibitor cocktail (Sigma-Aldrich) and 1× Phosphatase inhibitor (Thermo Scientific). After centrifugation for 10 min at 4 °C and 18,000g, the supernatant was collected and protein content was measured using a bovine serum albumin assay (Sigma). Equal amounts of protein were mixed with 4× Laemmli Sample buffer (1.0 M Tris, pH 6.8, 40% glycerol, 8% SDS, 0.2% bromophenol blue and 20% β-mercaptoethanol) and incubated for 10 min at 95 °C. Samples were loaded on an acrylamide gel together with a protein ladder (precision plus protein dual colour standards, Bio-Rad 1610394). After gel electrophoresis, proteins were transferred to an Immobilion-FL PVDF Membrane (Millipore Sigma). After blocking in TBST + 5% nonfat dry milk, the membrane was cut and incubated overnight at 4 °C with the respective primary antibodies (XPO1 antibody, Novus Biologicals, NB100-79802, 1:2,000 dilution; β-actin antibody, Abcam, ab8224, 1:1,000 dilution) in 2% milk in TBST. The next day, membranes were washed three times with TBST and then incubated for 1 h at room temperature with respective secondary antibodies in 2% milk in TBST. After washing three times with TBST, membranes were developed using Clarity Max western ECL substrate (Bio-Rad) and imaged on a Bio-Rad ChemiDoc MP.
Statistics and reproducibilityThe pooled drug screen was performed in a single experiment. Validation experiments in arrayed format were carried out with replicates and their numbers are indicated in the corresponding figures or their legends. Statistical tests were performed with GraphPad Prism v.9.0 unless described otherwise. Data distribution was assumed to be normal but this was not formally tested. No statistical methods were used to predetermine sample sizes but our sample sizes are similar to those reported in previous publications10,18. No data were excluded from the analyses. The experiments were not randomized. Data collection and analysis were not performed blind to the conditions of the experiments.
Reporting summaryFurther information on research design is available in the Nature Portfolio Reporting Summary linked to this article.
留言 (0)