
記住我


All cells were cultured in a 1:1 mixture of Ham’s F10 and DMEM (Gibco), supplemented with 1% penicillin–streptomycin and 10% FBS (Capricorn Scientific) at 37 °C and 5% CO2 in a humidified incubator. siRNA transfections were performed 2 days before each experiment using Lipofectamine RNAiMax (Invitrogen) according to the manufacturer’s protocol. The following siRNAs were purchased from Horizon Discovery: siSPRTN: 5′-CACGAUGAGGUGGAUGAGUAU-3′ (ref. 74); siDDB1: 5′-UGAUAAUGGUGUUGUGUUU-3′; siCSA: 5′-CAGACAAUCUUAUUACACA-3′; siCSB: 5′-GCAUGUGUCUUACGAGAUA-3′; siUVSSA: 5′-GCUCGUGGAUCCAGCGCUU-3′; siUSP7: 5′-GCAUAGUGAUAAACCUGU AUU-3′; and siCtrl: 5′-UGGUUUACAUGUCGACUAA-3′.
The RPE1 CSB–mScarlet-I KI cell line was generated using the same strategy as previously described34. The GFP–DNMT1 construct was a gift from H. Leonhardt75 (Ludwig-Maximilians-Universität München), which was subcloned into a lentiviral vector and transduced into hTert-RPE1 cells. GFP-positive cells selected using 10 μg ml–1 blasticidin (Invivogen) and high expressing cells were sorted by FACS. To generate hTert-RPE1 KO cells, 100 pmol crRNA (Integrated DNA Technologies (IDT); Supplementary Table 2) was annealed with 100 pmol traRNA (IDT) in duplex buffer (IDT) by denaturing the oligonucleotides at 95 °C for 5 min and incubating at room temperature for 10 min. Subsequently, 6.5 µg Alt-R S.p. Cas9 nuclease V3 (IDT) was added to enable ribonucleoprotein (RNP) complexes to form. The RNP complexes were transfected with Lipofectamine CRISPRMAX Cas9 transfection reagent (Invitrogen) according to the manufacturer’s instructions. Clones were screened by PCR with MyTaq (Bioline) (Supplementary Table 2) and KOs were confirmed by TIDE analysis and immunoblotting. The SPRTN clone is heterozygous as the protein is essential for cell proliferation76.
Homozygous GFP–RPB1 KI MRC-5 human lung fibroblasts (SV40-immortalized) and the isogenic CSA, CSB, XPA and XPC KOs in this cell line have been previously described33,29. UVSSA KO cells were generated using a dual, doxycycline-inducible CRISPR–Cas9 vector system (iKRUNC, crRNA sequence: 5′-AGACACGAATGCTCGGAGTC-3′), and UVSSA KO in a single cell clone was verified by TIDE analysis and sequencing of a subcloned PCR fragment of the genomic targeting locus (forward primer: 5′-CATTCTCCTGCCTCAATCTC-3′; reverse primer: 5′-CCTGTGCCTGGCATCTCTG-3′). After obtaining this UVSSA KO clone, the RPB1 locus was targeted with GFP as previously described33.
HeLa cells (WT, RPB1(K1268R) and CSB KO) were provided by the T. Ogi Laboratory23. The U2OS WT and USP7 KO cells were shared by the Verrijzer Laboratory56. The CSB KO cells were generated by transfecting U2OS cells with Cas9 protein and the sgRNA targeting CSB sequence 5′-CTTCTCCACGTCAACGAGCT-3′ (IDT) using CRISPRMax Lipofectamine (Invitrogen). A CSB KO clonal cell line was isolated and verified by PCR genotyping, sequencing and immunoblotting.
HCT116 CSB–mScarlet-I KI cells have been previously described34,46. The ATPase mutant CSB HCT116 cell line was established through Nucleofection using 4D Nucleofector (Lonza, V4XC-1024) with purified Cas9 protein, traRNA, crRNA targeting 5′-CAAGAAGGCAATTATCTGGA-3′ and ssODN 5′- CCAGCAGGCAGGAGGAATTCTGGGAGATGAAATGGG ATTGGGCAGGACGATCCAGATAATTGCCTTCTTGGCAGGTCTGAGCTACAGCA-3′ (all ordered from IDT) following the manufacturer’s recommended protocol. Cells were grown in medium containing 2 nM of the DNA-PK inhibitor NU7441 (Selleckchem) and 10 μM of the Polθ inhibitor ART558 (MedChemExpress) for 2 days and subsequently grown in regular medium. Cell populations were then clonally expanded, and clones were screened by PCR and sequencing. For generating cells with mutations in the UBD of CSB, HCT116 cells were co-transfected with LentiCRISPR-V2 puro plasmid encoding a sgRNA (5′-AGAACACGATGACCTTCTGG-3′) targeting the UBD of CSB in exon 21, and with a designed ssODN (IDT) of 80 nucleotides containing the L1427G and L1428G mutations, as well as a modified PAM sequence, which does not affect the amino acid sequence (5′-AGTGTGGGCCTGGAAAGCGATGAAGTTTCTCATCTCGACCCCACCGTCATCGTGTTCTGTGGTGGGCAGCAGGGCAGAAG-3′). Cells were co-transfected using the jetPEI (PolyPlus) protocol according to the manufacturer’s instructions. Two days after transfection, cells were selected with 2 μg ml–1 puromycin, followed by single clone isolation, which were screened by PCR and sequencing. CS-A (CS3BE sv40), CS-B (CS1AN sv40) and UVSS-A (TA-24 sv40) cells have been previously described24.
The WTC-11 human iPS cell line (GM25256) containing eGFP–POLR2A (AICS096-074, Allen Cell Collection, Coriell Institute) was cultured in StemFlex medium (ThermoFisher Scientific, A3349401) on 0.08 mg ml–1 Geltrex, LDEV-Free, hESC-qualified, reduced growth factor basement membrane matrix (ThermoFisher Scientific, A1413301)-coated plates. Cells were kept at 37 °C, 5% CO2 and 3% O2, and were passaged in clumps by incubating with 0.5 mM EDTA.
CSB KO human iPS cell lines were obtained through RNP nucleofection using a Human Stem Cell Nucleofector kit 2 (Lonza, VPH-5022). Single cells were obtained through incubation in StemPro Accutase Cell Dissociation reagent (ThermoFisher Scientific) and nucleofected with RNPs containing Alt-R S.P. HiFi Cas9 nuclease V3 (IDT), Alt-R CRISPR–Cas9 tracrRNA, ATTO 550 (IDT) and target-specific Alt-R CRISPR–Cas9 crRNA (5′-CAAGAAGGCAATTATCTGGA-3′). Nucleofected cells were seeded on a plate in StemFlex medium with RevitaCell supplement (ThermoFisher Scientific). After 24 h, cells were subjected to FACS for ATTO 550, and positive cells were seeded 100–200 cells per cm2 in StemFlex medium with RevitaCell supplement and grown until picking of single-cell colonies. The presence of insertions and deletions was verified by PCR and Sanger sequencing of the targeted site.
Stable rtTA/NGN2 eGFP–POLR2A human iPS cell lines were generated by lentiviral transduction as previously described60. In brief, transduced cells were selected for 7 days with puromycin (Sigma) and G418 (Sigma). After selection, cells are maintained in Stemflex supplemented with puromycin (0.5 µg ml–1) and G418 (50 µg ml–1) and routinely passaged as single cells using Accutase until stored in liquid nitrogen. Human iPS cells were differentiated into excitatory cortical neurons through the overexpression of neurogenin-2 (NGN2) following the addition of doxycycline59. rtTA/NGN2-integrated human iPS cells were plated on coverslips pre-coated with 50 µg ml–1 poly-l-ornithine (Sigma), followed by coating with a 75 µl droplet of 80 µg ml–1 Matrigel (Corning). Next, 40,000 cells were seeded in a droplet of 75 µl seeding medium containing StemFlex medium with RevitaCell supplement and 4 µg ml–1 doxycycline (Sigma). After cell attachment, the well was filled with seeding medium. After 24 h, the medium was changed to DMEM/F12 (Gibco) supplemented with 1% N2 supplement (Gibco), 1% MEM non-essential amino acid solution (Gibco), 1% penicillin–streptomycin (Sigma Aldrich), 4 µg ml–1 doxycycline, 10 ng ml–1 human recombinant NT3 (StemCell Technologies), 10 ng ml–1 brain-derived neurotrophic factor (Prospec) and 0.2 µg ml–1 mouse laminin (Sigma). From day 3 onwards, cells were cultured in neurobasal medium (Gibco, 21103-049) containing 1% B27 supplement (Gibco), 1% Glutamax (Gibco), 1% penicillin–streptomycin, 4 µg ml–1 doxycycline, 10 ng ml–1 NT3, 10 ng ml–1 brain-derived neurotrophic factor and 2 µM cytosine β-d-arabinofuranoside (Sigma). All cultures were kept at 37 °C, 5% CO2 and 3% O2 throughout differentiation. FRAP experiments were performed between day 8 and day 12 of differentiation. Cytosine β-d-arabinofuranoside was removed from cultures at least 24 h before the FRAP experiments.
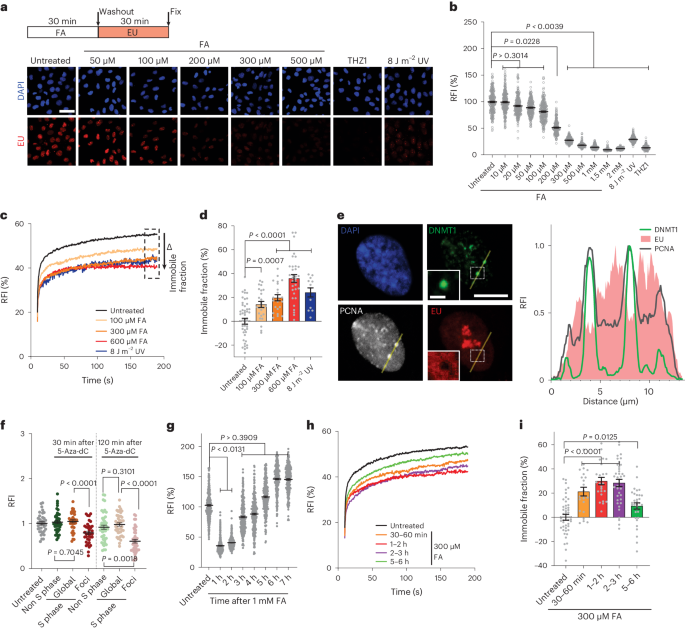
Treatment with DNA-damaging agents and inhibitorsFor FA treatment, a fresh vial of 16% (w/v) methanol-free FA (Pierce, 28906) was opened for every experiment. After a pulse of 30 min or 1 h (only when used for survival assays) at the indicated doses, cells were washed 3 times with DMEM/F10 (1:1) medium with 10% FBS to wash away and quench the FA. The cells were subsequently incubated as described above until collection or imaging. To generate DNMT1 DPCs for transcription analysis, cells at 50–70% confluency were incubated for 30 min with 50 μM 5-Aza-dC (Sigma, A3656) and subsequently cultured in standard culture medium until transcription was assayed as described below. For survival assays, 5-Aza-dC was added to the medium at the indicated concentrations and left on the cells until fixation. For UV irradiation, cells were washed with PBS and placed under a 254 nm germicidal UV-C lamp (Philips), whereby the duration of irradiation was controlled with an air-pressured shutter connected to a timer to expose cells to the indicated UV dose. For analysis of Pol I and Pol II transcription, cells were treated with 50 ng ml–1 actinomycin D (Sigma) or 1 μM flavopiridol (Sigma) for 1 h before transcription analysis. Cells were treated with the VCP inhibitor NMS873 (10 µM, Selleck Chemicals) directly together with FA treatment. Cells were pre-treated for 30 min with the NEDD8 E1 activating enzyme inhibitor MLN4924 (20 µM, Boston Biochem) or for 1 h with 50 µM MG132 (Enzo) or the CDK7 inhibitor THZ1 (1 µM for recovery of RNA synthesis and CSB FRAP and 2 µM for RPB1 FRAP and TCR-UDS). Cells were pre-treated with the SUMO inhibitor ML792 (2 μM, SelleckChem) for 30 min before FA before FRAP experiments and 2 h before fractionation. Cells were arrested in G1 through treatment with 1 µM of the CDK4 and CDK6 inhibitor palbociclib for 24 h before assays.
C. elegans strains and methodsC. elegans were cultured according to standard methods on nematode growth medium agar plates seeded with Escherichia coli OP50. C. elegans strains used were WT (Bristol N2), xpa-1(ok698)77, csa-1(tm5232)50, csb-1(emc79) and uvs-1(emc80). Animals with complete removal of csb-1 (designated emc79) or uvs-1 (designated emc80) were generated by injection of WT animals with Alt-R S.p. Cas9 nuclease V3 (IDT) and sgRNAs targeting csb-1 (5′-TGAAAAAATACCTAAGTACC-3′ and 5′-AAAAATGAATCAATGAATAA-3′) or uvs-1 (5′-CAAATAAAATGTTGAAAAGA-3′ and 5′-CAGTTTTCTCATTTTTAATA-3′). Mutant animals were selected and verified by genotyping PCR and sequencing (Extended Data Fig. 3e,f). RNAi bacteria to deplete alh-1 and adh-5 were obtained from the C. elegans RNAi feeding library78. Control RNAi was the vector L4440 (Addgene, plasmid 1654; a gift from A. Fire). RNAi depletion was achieved by culturing animals for three generations on RNAi bacteria before the start of each experiment. For each RNAi growth experiment, young adults grown on RNAi bacteria were allowed to lay eggs on five 6 cm RNAi plates for 4 h. Four days later, developmental growth was scored by counting the number of eggs, different larval stages and adult animals on the plate. For each FA survival experiment, staged young adults were allowed to lay eggs for 24 h on four 6 cm plates containing the indicated dose of FA. After 24 h, survival was scored by counting dead and living offspring. UV survival assays were performed according to the L1 larvae UV survival assay as previously described79. In brief, E. coli OP50, transformed with RNAi, was spread on LB agar plates, and young adult worms were allowed to lay eggs for 4 h. Four days later, the developmental stages of the offspring were counted.
Clonogenic survival assayFor survival assays, 300 cells (RPE1 and MRC-5), 500 cells (HeLa, HCT116, CS1AN, CS3BE and TA24 cells) or 600 cells (U2OS) were seeded per well in triplicate in a 6-well plate. The following day, cells were treated with DNA-damaging agents. For FA, the cells were treated for 1 h and subsequently washed 3 times in culture medium. For 5′-Aza-dC (Sigma), the cells were treated with the indicated doses, which was left on the cells until fixation. For cisplatin, the cells were treated for 24 h and subsequently thoroughly washed with culture medium. After allowing the cells to grow in colonies for 7–10 days, the plates were fixed and stained using Coomassie blue (50% methanol, 7% acetic acid and 0.1% Coomassie blue (all Sigma)) and colony numbers were counted using GelCount (Oxford Optronix). The relative colony number was plotted from at least two independent experiments, each performed in triplicate. Levels were normalized to mock-treated, set to 100 and plotted with s.e.m. values.
To assess cell viability in non-replicating cells Alamar Blue (Invitrogen) survival assays were used, which uses a resazurin-based solution that functions as a cell health indicator by using the reducing power of living cells to quantitatively measure viability. RPE1 cells were seeded to confluency in triplicate in 96-well plates. The next day, cells were arrested in G1 with 1 µM palbociclib (SelleckChem), which remained present during the entire experiment. At 48 h after palbociclib treatment, cells were treated with FA at the indicated doses for 1 h and then washed 3 times with regular culture medium. To determine viability of the cells 96 h after FA treatment, metabolic activity was measured using Alamar Blue, which was added for 2 h, and the fluorescence was measured at 570 nm using a SpectraMax iD3 reader (Molecular devices). Data were normalized to mock-treated conditions.
Cell lysis and immunoblottingCells were directly lysed in SDS–PAGE sample buffer (125 mM Tris pH 6.8, 2% SDS, 0.005% bromophenol blue, 21% glycerol and 4% β-mercaptoethanol). For chromatin-bound Pol II and SUMOylation and chromatin associated proteins, cells grown in a 6-well plate were lysed in fractionation buffer with 30 mM HEPES pH 7.5, 130 mM NaCl, 1 mM MgCl2, 0.5% Triton X-100 with 50 µM MG132, complete EDTA-free protease inhibitors (Roche), phosphatase inhibitor cocktail 2 (Sigma) and N-ethylmaleimide (Sigma) for 30 min on ice. Chromatin was pelleted at 15,000g for 10 min at 4 °C and washed once with fractionation buffer. Finally, the chromatin was digested with 50 U benzonase (Millipore) for 30 min at 4 °C before adding SDS–PAGE sample buffer followed by 5 min of incubation at 95 °C. Protein samples were separated on 4–15% Mini-Protean TGX precast protein gels (Bio-Rad) in 25 mM Tris, 192 mM glycine and 0.1% SDS buffer. Proteins were transferred onto polyvinylidene difluoride membranes (0.45 µm, Merck Millipore) at 4 °C overnight at 30 V in transfer buffer (25 mM Tris, 192 mM glycine and 10% ethanol or 25 mM Tris and 192 mM glycine for chromatin fractionations). Membranes were blocked with 3% BSA (Sigma) in PBS and probed with primary antibodies in 1% BSA in PBS. Subsequently, membranes were extensively washed with PBS with 0.05% Tween and incubated with secondary antibodies coupled to IRDyes (LI-COR) to visualize proteins using an Odyssey CLx infrared scanner (LI-COR). Image Studio Lite (v.5.2.5) was used for western blot acquisition and analysis.
The following primary antibodies were used: rabbit anti-BRG1 (Abcam, ab110641; 1:2,000); rabbit anti-CSA (Abcam, ab240096; 1:1,000); rabbit anti-CSB (Antibodies Online, ABIN2855858; 1:1,000); rabbit anti-DDB1 (Novus Biologicals, NBP2-75465; 1:1,000); rabbit anti-RPB1 pSer2 (Abcam, ab5095; 1:1,000) or rat anti-RPB1-pSer2 (Chromotek, 3E10; 1:1,000); rat anti-RPB1-phospho-Ser5 (Chromotek, 3E8; 1:1,000); mouse anti-SSRP1 (Biolegend, 609701; 1:10,000); rabbit anti-SPRTN (Invitrogen, PA5-46262; 1:500); mouse anti-SUMO2/3 (Proteintech, 67154-1-1g; 1:1,500); mouse anti-tubulin (Sigma-Aldrich, T5168, 1:5,000); rabbit anti-USP7 (Bethyl, A300-033A; 1:1,000); rabbit anti-VCP (Bethyl, A300-589A; 1:1,000); rabbit anti-XPA (Genetex, GTX103168; 1:1,000); rabbit anti-XPB (Abcam, ab190698; 1:1,000); and rabbit anti-XPC (Bethyl, A301-112A; 1:2,000). The following secondary antibodies were used: goat anti-rabbit conjugated to IRdye (Sigma, SAB4600215 (770) or SAB4600200 (680); both 1:10,000); goat anti-mouse conjugated to IRdye (Sigma, SAB4600214 (770) or SAB4600199 (680); both 1:10,000); and goat anti-rat conjugated to IRdye770 (Sigma, SAB4600479; 1:10,000).
FRAP analysisCSB, RPB1 and DDB2 FRAP analyses were performed as previously described29,33,34,80. In brief, for RPB1 and DDB2 FRAP, a Leica TCS SP5 microscope (LAS AF software, v.2.7.4.10100, Leica) with a HCX PL APO CS ×63, 1.40 NA oil-immersion lens or, for CSB FRAP, a Leica TCS SP8 microscope (LAS X software, v.3.5.6.21594, Leica) with a HC PL APO CS2 ×63, 1.40 NA oil-immersion lens was used. Cells were maintained at 37 °C and at 5% CO2 during imaging. Two narrow strips, one inside and another outside the nucleus, of 512 × 32 pixels (RPB1 and DDB2) or 512 × 16 pixels (CSB) were imaged every 400 ms at 400 Hz using a 488 nm laser (RPB1), every 800 ms at 400 Hz using a 488 nm laser (neuronal RPB1), every 400 ms at 561-nm laser (CSB) or every 22 ms at 1,400 Hz (DDB2) using a 488 nm laser. A total of 25 (RPB1), 200 (DDB2) or 5 (CSB) frames were measured to reach steady-state levels before photobleaching (1 frame 100% laser power for RPB1, 2 frames for CSB and 7 frames for DDB2). After photobleaching, the recovery of fluorescence was measured using 450 (RPB1) 300 (neuronal RPB1), 30 (CSB) or 1,500 (DDB2) frames. Relative fluorescence intensity (RFI) was corrected for the background signal quantified outside the nucleus and normalized to the average pre-bleach fluorescence intensities. Immobile fractions were calculated according to the following formula:
$$}\; }=1-\frac}\; },}- < }\; } > )}}\; },} > - < }\; } > )}$$
whereby I recovery, FA refers to the average recovery of fluorescence of frames 414–450 (RPB1) or frames 16–30 (CSB). This was normalized to the average recovery of all untreated cells (<I recovery, NT>) and the average first measurement after bleaching (<I bleach>).
Pol II IPElongating Pol II pSer2 was immunoprecipitated as previously described34. In brief, cells on 3 confluent 15 cm dishes for IP followed by immunoblotting or 10 confluent 15 cm dishes for SILAC interaction proteomics were treated with FA or UV as indicated. After collection by trypsinization, cells were collected in cold PBS and centrifuged for 5 min at 438g at 4 °C. After 2 cold PBS washes, cell pellets were stored at −80 °C until IP.
For IP, cell pellets were thawed on ice and lysed in buffer B1 (30 mM HEPES pH 7.6, 1 mM MgCl2, 150 mM NaCl and 0.5% NP-40 with 1× complete EDTA-free protease inhibitor cocktail (Roche)) and rotated for 20 min at 4 °C. Chromatin was pelleted by centrifuging at 10,000g for 5 min at 4 °C. After a wash in buffer B1, the chromatin was digested in buffer B1 containing 500 U benzonase (Millipore) and incubated with 2 µg RPB1 pSer2 antibody (Abcam, ab5095) for 1 h at 4 °C. After 1 h, the NaCl concentration was increased to 300 mM to remove weak interactors and to inactivate benzonase and incubated for an additional 30 min. After spinning at 16,800g for 10 min at 4 °C, the soluble supernatant containing the antibody-bound fraction was incubated with 25 µl slurry salmon sperm protein A agarose beads (Millipore) for 2 h while rotating at 4 °C. Unbound proteins were removed by washing the beads 5 times in buffer B2 (30 mM HEPES pH 7.6, 150 mM NaCl, 1 mM EDTA and 0.5% NP-40 with 0.2× complete EDTA-free protease inhibitor cocktail). Bound elongating Pol II complexes were eluted off the beads in SDS–PAGE sample buffer and separated on 4–15% Mini-Protean TGX precast protein gels (Bio-Rad). Samples were transferred to polyvinylidene difluoride membranes for immunoblotting or fixed and stained for mass spectrometry using Imperial protein stain (Pierce) according to the manufacturer’s protocol.
SILAC–mass spectrometryFor SILAC, cells were grown for 2 weeks (>10 cell doublings) in arginine/lysine-free SILAC DMEM (ThermoFisher) supplemented with 10% dialysed FCS (Gibco), 1% penicillin–streptomycin, 200 µg ml–1 proline (Sigma) and either 73 μg ml–1 light [12C6]-lysine and 42 μg ml–1 [12C6,14N4]-arginine (Sigma) or heavy [13C6]-lysine and [13C6,15N4]-arginine (Cambridge Isotope Laboratories). Pol II was immunoprecipitated from the cells as described above.
Mass spectrometry analysisSDS–PAGE gel lanes were cut into slices and subjected to in-gel reduction with dithiothreitol (Sigma, D8255), alkylation with iodoacetamide (Sigma, I6125) and digestion with trypsin (sequencing grade; Promega) as previously described34. Nanoflow liquid chromatography–tandem mass spectrometry was performed on an EASY-nLC 1200 coupled to a Lumos Tribid Orbitrap mass spectrometer (ThermoFisher Scientific) operating in positive mode. Peptide mixtures were trapped on a 2 cm × 100 μm Pepmap C18 column (Thermo Fisher, 164564) and then separated on an in-house packed 50 cm × 75 μm capillary column with 1.9-μm Reprosil-Pur C18 beads (Dr. Maisch) at a flow rate of 250 nl min–1 using a linear gradient of 0–32% acetonitrile (in 0.1% formic acid) over 120 min. The eluate was directly sprayed into the electrospray ionization source of the mass spectrometer. Spectra were acquired in continuum mode, and fragmentation of the peptides was performed in data-dependent mode by HCD.
Mass spectrometry data were analysed using MaxQuant software (v.1.6.3.3). The false discovery rate of both peptide-spectrum match and protein was set to 0.01 and the minimum ratio count was set to 1. The Andromeda search engine was used to search the tandem mass spectrometry spectra against the UniProt database (taxonomy: Homo sapiens, release 2018), concatenated with the reversed sequences of all proteins. A maximum of two missed cleavages was allowed. In case the identified peptides of two proteins were the same or the identified peptides of one protein included all peptides of another protein, these proteins were combined using MaxQuant and reported as one protein group. Before further analysis, known contaminants and reverse hits were removed. GO term enrichment analysis, which included genes with an average SILAC log2 ratio of >1.2, was performed using the g:Profiler website81 to identify the top 10 biological processes and reactions after FA treatment.
Recovery of RNA synthesisCells were grown on coverslips for 48 h before treatment with DNA-damaging agents as indicated. Transcription levels were measured by pulse labelling with 100 µM EU (Jena Bioscience) in regular culture medium, and cells were grown at 37 °C for 30 min before fixation with 3.6% FA (Sigma) in PBS for 10 min at room temperature. After permeabilization with 0.1% Triton X-100 in PBS for 10 min, Click-it-chemistry-based azide coupling was performed by incubating for 1 h with 60 µM Atto594 azide (Attotec) in 50 mM Tris buffer (pH 8) with 4 mM CuSO4 (Sigma) and 10 mM freshly prepared ascorbic acid (Sigma). Coverslips were washed with 0.1% Triton X-100 in PBS and with PBS only. For 5-Aza-dC-treated cells, coverslips were incubated with mouse anti-PCNA (Abcam, ab29, 1:200) and rabbit anti-DNMT1 (CST, 5032, 1:200) in 1% BSA–PBS for 1 h at room temperature. The coverslips were washed with PBS 3 times before staining with secondary antibodies conjugated with Alexa488 or Alexa633 (Invitrogen, 1:1,000) in 1% BSA–PBS for 30 min at room temperature.
Nuclei were visualized using 100 ng ml–1 4,6-diamidino-2-phenylindole (DAPI; Brunschwieg Chemie). Coverslips were mounted with Aqua-Poly/Mount (Polysciences). Cells were imaged using a Zeiss LSM 700 Axio Imager Z2 upright microscope equipped with a ×40 Plan-apochromat 1.3 NA oil-immersion lens (Carl Zeiss Micro Imaging) using Carl Zeiss LSM software (v.14.0.0.0). The integrated density of the EU signal in the nuclei was quantified using ImageJ/Fiji software (v.1.52p) with a macro identifying the surface of each nucleus based on the DAPI signal, after which the mean fluorescence of the EU signal in the nucleus was measured. The mean fluorescence intensity was corrected for the background signal. With these values, the integrated density was calculated and plotted as single-cell points with the average and s.e.m.
For 5-Aza-dC-treated cells, the lines in ImageJ/Fiji were drawn across DNMT1 foci at a width of 5 pixels and the average of the 5 pixels is plotted. For quantifying transcription levels in foci and the surrounding nucleoplasm, the nucleus was segmented based on the DAPI signal and DNMT1-DPC foci and nucleoli were identified using Yen’s thresholding82. The nucleoli were subtracted from the foci area to avoid any overlap before obtaining the damage mask. To determine the global EU signal of the nucleoplasm, the foci and nucleoli were subtracted from the nucleus mask. The resulting masks were used to determine the mean fluorescence of the EU signal of the area of interest, foci or global, respectively. For global EU intensity measurement in control cells, the nucleoli were again excluded from the nuclear area. The macro used for segmenting foci to measure transcription in DNMT1 foci and in the nucleoplasm is available at GitHub (https://github.com/Marteijnlab/DPC-transcription-stress.git).
TCR-UDSThe assay was performed as previously described55. In brief, XPC-deficient RPE1 cells, grown on glass coverslips, were arrested in G1 with the CDK inhibitor 1 µM palbociclib for 24 h. After a 30 min of treatment as indicated, cells were washed 3 times with medium before nascent DNA was labelled for 7 h with 20 µM EdU in Ham’s F10 medium supplemented with 1 µM palbociclib, 10% FCS, 1% penicillin–streptomycin and 1 µM floxouridine (Sigma) at 37 °C. After labelling, unincorporated EdU was removed by cold chasing the cells in Ham’s F10 supplemented with 1 µM palbociclib, 10% FCS and 1% penicillin–streptomycin with 10 µM thymidine (Sigma). Cells were fixed with 3.6% FA and 0.5% Triton-X 100 in PBS for 15 min at room temperature and permeabilized with 0.5% Triton for 20 min followed by blocking in 3% BSA at 4 °C overnight. After blocking, cells were washed in PBS, and endogenous peroxidase activity was quenched by incubating cells in 3% H2O2 (Sigma) in PBS for 30 min. Subsequently, cells were washed in PBS with 0.5% BSA and 0.15% glycine for 1 h and the Click-it chemistry reaction was performed using 200 µM PEG3–biotin–azide (Jena Bioscience), 1× Click-it reaction buffer, 4 mM CuSO4 solution and 10× reaction buffer additive (C10337, Thermo Fisher kit) for 1 h. The UDS signal was amplified using HRP–streptavidin (Thermo Fisher, B40932) for 1 h and the signal was visualized using Alexa-Fluor 488-nm-conjugated tyramide (B40932 kit) for 10 min, after which the reaction was stopped using HRP-Reaction stop reagent (from the B40932 kit) for 3 min, and cell nuclei were stained using DAPI (100 ng ml–1 in PBS) for 15 min. Coverslips were mounted on glass slides using AquaPoly/Mount.
Quantitative flow cytometryFor quantitative flow cytometry, cells were seeded in a 6-well plate 2 days before treatment. Cells were washed in PBS and exposed to 1 mM FA in culture medium for 30 min at 37 °C. For the GFP–RPB1 levels, new protein synthesis was inhibited with 100 µM cycloheximide (Sigma) by pre-treating for 2 h before FA treatment and keeping it in the medium throughout the FA treatment and recovery period afterwards. The proteasome inhibitor MG132 (50 μM) was added together with the FA and remained present in the culture medium throughout the incubation period. Cells were then collected by trypsinization, centrifuged for 3 min at 281g and resuspended in 500 µl PBS containing 1% FA. Cells were analysed on a LSRFortessa X-20 Cell Analyzer (BD) equipped with FACSDiva software (BD). Cellular GFP–RPB1 or CSB–mScarlet-I protein levels were quantified after exclusion of dead cells by granularity (SSC-A) and size (FSC-A) using a 488 nm laser and 530/30 filter for GFP–RPB1 and using a 561 nm laser and 610/20 filter for CSB–mScarlet-I. Flow cytometry data were analysed using FlowJo software (v.10.8.1) from BD Biosciences. Fluorescence intensity was corrected and normalized to mock-treated fluorescence.
Flavopiridol qPCR analysisMRC-5 cells were grown in 6-well plates and treated for 2 h with 1 μM flavopiridol (Sigma) before 30 min of FA pulse (1 mM). Cells were washed 3 times with culturing medium before RNA was isolated. Cells were lysed on the plate and RNA was isolated using a RNeasy mini kit (Qiagen, 74104) following the manufacturer’s instructions. Genomic DNA was digested on the column with RNase free DNase (Qiagen, 79254). RNA concentrations were determined on a Nanodrop, and 1 μg RNA was used to make cDNA using an iScript cDNA synthesis kit (Bio-Rad, 170-8891). RT–qPCR was performed using 15 ng cDNA in triplicate with 3 µl DNA, 1 µl 5 μM primer mix and 6 µl 2× PowerUp SYBR Green master mix (Thermo Fisher, A25778) per reaction in 384-well plates on a CFX384 Touch Real-Time PCR system (Bio-Rad). Primers used are listed in Supplementary Table 3. DNA was amplified using the following program: 95 °C for 5 min, 40 cycles of 15 s at 95 °C and 50 s at 60 °C followed by a dissociation curve (from 65 °C to 95 °C with an increment of 0.5 °C for 5 s). Values were calculated using the 2-ΔCt method, whereby each condition was normalized to the 0 min sample associated with the treatment.
Nascent RNA-seqMRC-5 cells, grown to 80% confluency, were incubated with 1 mM of EU for 10 min followed by RNA isolation. Nascent RNA was isolated using a Click-iT Nascent RNA Capture kit (Thermo, C10365) per the manufacturer’s instructions at the maximum recommended input quantities. The beads with EU–RNA were then resuspended in the fragment, prime and elute buffer supplied with the KAPA RNA HyperPrep kit (Roche, KK8540). The mixture was heated to 94 °C for 6 min, and library preparation was completed according to the manufacturer’s instructions. The libraries were amplified with 15 PCR cycles, followed by clean-up. The quality and quantity of the library were assessed using a High Sensitivity D1000 assay on a TapeStation system (Agilent). Equal input quantities were then sequenced on a NovaSeq 6000 system (Agilent). EU sequencing reads were preprocessed using FastQC (v.0.11.9), FastQScreen (v.0.14.0) and Trimmomatic (v.0.35)83. The remaining reads were then aligned to the human ribosomal DNA, mitochondrial sequences (UCSC, hg38), and the human reference genome (GRCm38) using Tophat2 (v.2.0.9)84, with default settings (except for the -g 1 option).
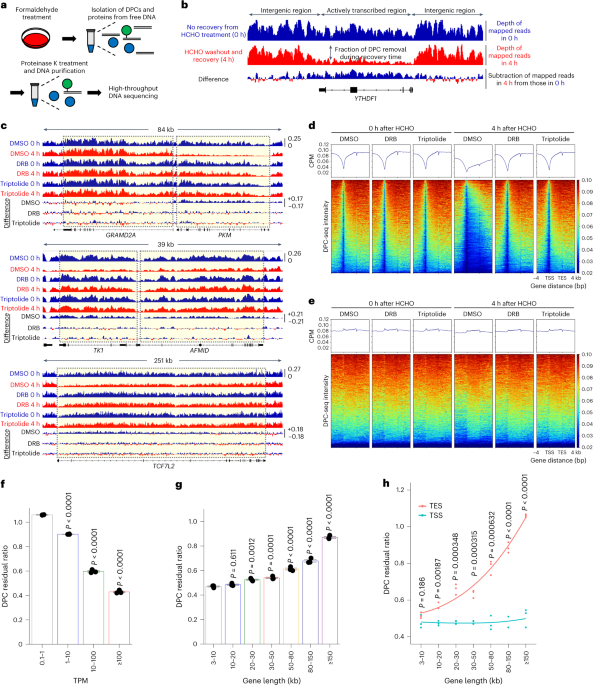
DPC removal assayThis protocol is described in more detail at Protocol Exchange42. MRC-5 cells were seeded on 6-well plates (DPC-qPCR) or 10 cm dishes (DPC-seq) and mock treated or exposed to 1 mM FA for 30 min. THZ (1 μM; SelleckChem) was added 1.5 h before FA treatment for the indicated samples. Cells were wash 2 times with PBS and lysed in 900 μl 2% SDS solution with 10 mM Tris-HCl (pH 7.5). Samples were stored at −20 °C after snap-freezing in liquid nitrogen until further processing. After thawing at 55 °C, DNA was sheared by passing the lysates through a 23-gauge needle 5 times and subsequent sonication at room temperature with high amplitude and 30 cycles of 30 s on and 30 s off (Bioruptor Plus, Diagenode, B01020001). Next, samples were incubated at 55 °C for 10 min. An equal volume (900 μl) of precipitation buffer (400 mM KCl and 20 mM Tris-HCl, pH 7.5) was added and samples were incubated at 4 °C for 6 min to complete precipitation. After centrifugation at 20,000g for 5 min at 4 °C, the supernatants were collected. The resulting pellets were washed at 55 °C for 10 min with 1 ml of wash buffer (200 mM KCl and 20 mM Tris-HCl, pH 7.5), incubated on ice for 6 min and centrifuged at 20,000g for 5 min at 4 °C. This washing procedure was repeated twice. All supernatants were combined for free DNA measurement. DPC-associated pellets were resuspended in 400 μl resuspension buffer (0.2 mg ml–1 proteinase K and 0.2 mg ml–1 RNAse A in 100 mM KCI, 20 mM Tris-HCl and 10 mM EDTA) by vortexing. The samples were then incubated at 50 °C. After 3 h of incubation, samples were chilled on ice for 6 min and centrifuged at 20,000g for 10 min at 4 °C to remove debris. The supernatant, which contains the DPC-associated DNA, was collected and purified using a gel extraction kit (Qiagen, 20051). DPC levels were determined by RT–qPCR and DNA sequencing.
RT–qPCR was performed on the eluted DNA in triplicate using 5 µl DNA, 1 µl primer mix and 7 µl 2× PowerUp SYBR Green master mix (Thermo Fisher, A25778) per reaction in 384-well plates on a CFX384 Touch Real-Time PCR system (Bio-Rad). Primers used are listed in Supplementary Table 4. DNA was amplified using the following program: 50 °C for 2 min, 95 °C for 2 min, 45 cycles of 15 s at 95 °C and 1 min at 58 °C followed by a dissociation curve (95 °C for 10 s and heating from 65 °C to 95 °C with an increment of 0.5 °C for 5 s each). Data collection was enabled at each increment of the dissociation curve. DPC-associated DNA levels were normalized to free DNA levels using the 2-ΔΔCt method, after which the FA-treated samples were normalized to the non-treated samples. Subsequently, all samples were normalized to the FA 0 h sample.
For DPC-seq, 50 ng DNA was used for the Twist Library Preparation EF kit 2.0. The fragmentation step was omitted and 7 PCR cycles were performed. Sequencing was done using a S1 flowcell on a Novaseq6000 with 2 × 150 cycles. All sequencing data were preprocessed using fastp (v.0.23.4) with its default options85. Data were aligned to the GENCODE GRCh38 release 44 reference genome86. RNA-seq data alignment used STAR (v.2.7.11a) with the alignment options ‘–runMode alignReads–outSAMunmapped Within–outSAMattributes Standard’87. DNA data were aligned using bwa (v.0.7.17-r1188) with the alignment option ‘mem’.
The genome was partitioned into bins of 1,000 bases each, and read counts for the bins were computed from every sequencing sample using featureCounts (v.2.0.6) with the counting options ‘-O–fraction -s 0 -p–countReadPairs -B–primary–ignoreDup -Qz30’88. All additional data processing was performed on the binned datasets. Replicates (where applicable) were combined by computing the average total reads for the combined sample sets, scaling bins in each sample to this average, then averaging the corresponding bins between the samples. Filtering of data was performed by discarding bins from all datasets (DNA and RNA) whenever a filter criterion was met by any bin in any of the datasets. The DNA outlier bins were discarded using the IQR method, computing quartiles and removing bins below Q1 – 1.5 × IQR and above Q3 + 1.5 × IQR. Q1 – 1.5 × IQR was below zero, so no low-end bins were discarded in this manner. Additionally, DNA bins with a TPM of less than 0.08 were discarded as they provided limited opportunity for repair and increased the noise in the data. After this filtering, 73.4% of bins remained. For comparisons between the 0 h and 4 h samples (after replicate combining), the RNA-seq bins with zero reads (indicating no transcription) were selected to use as a reference for data normalization. DNA bins corresponding to these zero transcription RNA bins were summed and a ratio was computed between samples. The ratio was then used to scale 0 h sample bins to the 4 h level. For the purposes of statistical analysis and plotting of the data, a final RNA TPM threshold filter was applied, removing all bins corresponding to RNA bins with TPM less than or equal to the threshold. Thresholds are specified with each graph or set of statistics. If no threshold is specified, then all bins with RNA TPM equal to zero were excluded.
Statistics and reproducibilityExperimental data were analysed and processed in Excel (2016) and plotted using GraphPad Prism 9.4.0 (GraphPad Software) using unpaired two-tailed t-tests. The number of experiments, sample size and statistic tests are reported in the respective figure legends. Clonogenic survival assays, recovery of RNA synthesis, TC-UDS, FRAP experiments, DPC–qPCR, RT–qPCR and flow cytometry assays were performed three times unless specified in the legends. IP and western blotting characterizing cell lines were performed two times.
No statistical method was used to predetermine sample size. No data were excluded from the analyses. The experiments were not randomized. The investigators were not blinded to allocation during experiments and outcome assessment.
Reporting summaryFurther information on research design is available in the Nature Portfolio Reporting Summary linked to this article.
留言 (0)