Animals
The experimental protocol was approved by the Animal Care and Usage Committee of Ankara University (protocol no. 2022-12-101). Female Balb/C mice at 4–6 weeks and male mice at 8–10 weeks of age were purchased from the Research Animal Laboratory Unit. All mice were hosted with free access to food and water and kept in a 12 h light/dark cycle.
Collection of zygotes and in vitro embryo culture
To collect zygotes, intraperitoneally 5 IU pregnant mare’s serum gonadotropin (PMSG) (Intervet, Türkiye), and 48 h later 5 IU human chorionic gonadotropin (hCG) (Sigma-Aldrich, USA)-injected female mice were kept with mature male mice at a rate of one female:one male overnight for mating. The presence of vaginal plug verified the fertilization and zygotes were obtained from the oviducts of sacrificed pregnant female mice at 20 h following hCG injection. The cumulus cells surrounding the zygotes were removed using hyaluronidase (Vitrolife, Sweden) solution at a concentration of 5 IU/mL. Embryos were immediately placed in morpholinepropanesulfonic acid (MOPS)-buffered medium (G-MOPS) (Vitrolife, Sweden) after collection and then transferred to embryo culture medium (G-TL; Vitrolife, Sweden) as 30 μL volumes of culture drops in 35 mm culture dishes (Corning, USA) that were overlaid by approximately 3 mL of paraffin oil (OVOIL; Vitrolife, Sweden). Zygotes (0 h) were randomly cultured in the related culture media to the blastocyst stage (96 h) at 37 °C in 6% CO2.
For the in vivo control group, pregnant females were allocated for 96 h, and after sacrificing, blastocysts were collected from the uterus. Three hundred embryos were evaluated for each group. All experiments were performed in at least three replicates.
Experiment groups
The groups were designed as follows:
1.
In vivo control group: Blastocysts developed in vivo were collected from mice.
2.
In vitro control group: Embryos were cultured in a medium without antioxidants.
3.
NAC group: Embryos were cultured in 10 µM of NAC-containing culture medium (Truong et al. 2016)
4.
ALC group: Embryos were cultured in 10 µM of ALC-containing culture medium (Truong et al. 2016)
5.
ALA group: Embryos were cultured in 5 µM of ALA-containing culture medium (Truong et al. 2016)
6.
MitoQ group: Embryos were cultured in 50 nM of MitoQ-containing culture medium (Al-Zubaidi et al. 2021)
7.
The mixture AO group: Embryos were cultured in a medium containing a combination of 10 µM of NAC, 10 µM of ALC, and 5 µM of ALA.
Immunofluorescence (IF) staining
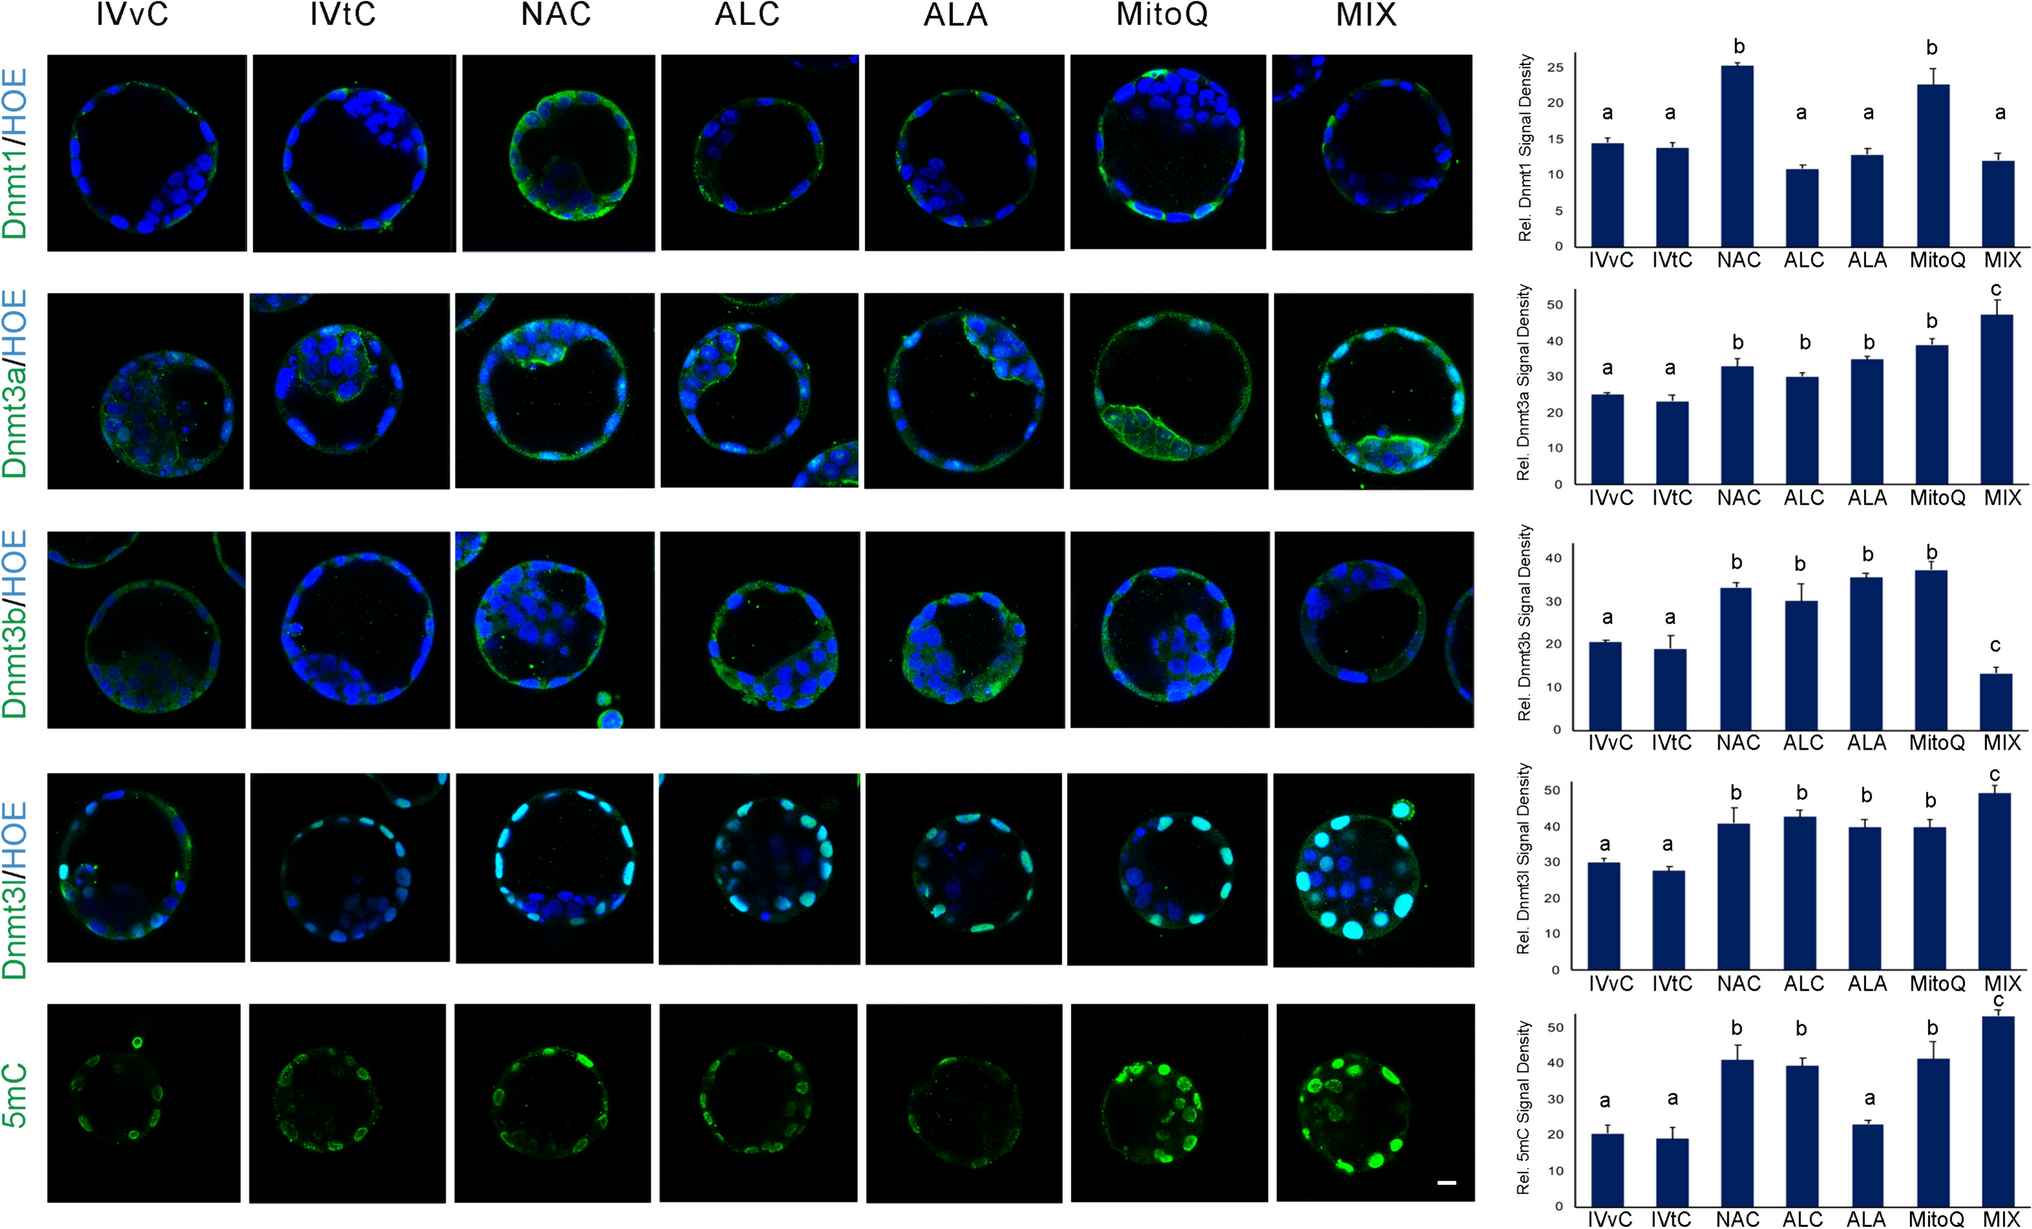
Blastocysts were fixed and then permeabilized with 4% paraformaldehyde (Sigma-Aldrich, USA) solution and 1% Tween-20 (Sigma-Aldrich, USA) at room temperature (RT), respectively. After blocking in 20% normal goat serum-containing solution (Vector Laboratory, USA), IF was applied to detect the relative signal intensities and cellular distribution profiles of the Dnmt1, Dnmt3a, Dnmt3b, Dnmt3L, Cdx2, and Nanog proteins in the blastocysts. Briefly, blastocysts were incubated overnight at +4 °C with the primary antibodies against Dnmt1 (1:100; ab87654, Abcam; UK), Dnmt3a (1:100; ab188470, Abcam, UK), Dnmt3b (1:100; 48,488, Cell Signaling, USA), Dnmt3L (1:100; ab3493, Abcam, UK), 5mC (1:200; 28,692, Cell Signaling, USA), Cdx2 (1:100; ab76541, Abcam, UK), or Nanog (1:100; 8822, Cell Signaling, USA). After a triple wash with 1× phosphate buffered saline solution including 2% bovine serum albumin (BSA) for 10 min each (PBS–BSA; Sigma-Aldrich, USA), blastocysts were incubated with anti-rabbit IgG Alexa 488-conjugated secondary antibody (Invitrogen, USA) for 1 h at RT followed by triple washes with 1× PBS–BSA solution for 10 min each. The omission of primary antibodies served as a negative control. All staining steps were performed using mini-well trays (Thermo Fisher Scientific, USA) in a humidified chamber. Stained blastocysts were gently transferred onto glass-bottomed 35 mm Petri dishes in a 4 μL drop of PBS-based mounting medium containing 1 μg/mL Hoechst 33,342 (Thermo Fisher Scientific, USA) for DNA labeling. The top was covered with a droplet of paraffin oil (Ovoil, Vitrolife, Sweden). All fluorescently tagged specimens were examined and imaged using a Zeiss LSM-880 Airyscan system (Zeiss, Germany) with a 40× Zeiss C-Apo water immersion objective (1.2 NA). Alexa-488 was excited using the 488 nm laser and a band pass of green-fluorescent emission was 493–634 nm. Hoechst 33,342 was excited with 405 nm laser and emission was collected with a band pass of 438–458 nm. Images were captured with the Zeiss ZEN Black software. All laser power, pinhole, and gain parameters were set based on the negative control and were kept the same for each experiment.
ROS level assay
Reactive oxygen species levels in blastocysts were determined with 2′,7′–dichlorofluorescein diacetate (DCFDA) Cellular ROS Assay Kit/Reactive Oxygen Species Assay Kit (ab113851, Abcam, UK). Live blastocysts were washed twice with 1× buffer (ab113851, Abcam, UK). After washing, the blastocyts were stained with 20 μM DCFDA at 37 ℃ for 45 min in the dark. Blastocysts were washed with 1× buffer twice. Then, blastocysts were placed in a 20 μL drop of 1× buffer covered with Ovoil (10,029, Vitrolife, Sweden). ROS levels were analyzed with a Zeiss LSM-880 Airyscan system.
Terminal deoxynucleotidyl transferase dUTP nick end labeling (TUNEL) assay
The TUNEL assay was performed using the In Situ Cell Death Detection Kit (Sigma-Aldrich, USA) according to the manufacturer’s instructions. Following fixation of blastocysts in 4% paraformaldehyde and then permeabilization with 1% Tween-20 (Sigma-Aldrich, USA) at RT, embryos were washed three times in PBS. Embryos were incubated with TUNEL reaction mixture for 1 h at 37 ℃ in the dark. For the negative control, the enzyme solution was omitted. Blastocysts were gently transferred onto glass-bottomed 35 mm dishes in a 4 μL drop of PBS-based mounting medium containing 1 μg/mL Hoechst 33,342 (Thermo Fisher Scientific, USA). The top was covered with a droplet of paraffin oil. All fluorescently tagged blastocysts were examined and imaged using a Zeiss LSM-880 Airyscan system. The total number of nuclei and number of TUNEL-labeled nuclei were determined under microscope for each embryo. The ratio of TUNEL-positive cells to the total number of cells was defined as the apoptosis index. TUNEL staining for each group was performed at least three times.
Western blotting (WB)
Semi-quantitative analysis of Dnmt1, Dnmt3a, Dnmt3b, and Dnmt3l was performed with western blotting (WB). For each group, embryos (n = 200) were placed in a lysis buffer (1% sodium dodecyl-sulfate, 1 mmol/L sodium ortho-vanadate, 10 mmol/L Tris pH 7.4) supplemented with 1× protease inhibitor cocktail (Amresco, USA). The protein concentration was measured using the bicinchoninic acid (BCA) method. Fifty micrograms of protein from each group were loaded on each lane of 10% SDS–polyacrylamide gel electrophoresis (PAGE) gel, which was used for protein electrophoresis Following electro-transfer to a polyvinylidene difluoride (PVDF) membrane (Roche, UK) overnight at +4 ℃, the membrane was blocked with 5% (w/v) BSA prepared in TBS-T (20 mmol/L Tris/HCl and 150 mmol/L NaCl plus 0.05% Tween-20 at pH 7.4) at RT for 1 h. Membranes were incubated with primary antibodies specific to Dnmts or β-actin (Abcam, USA) (1:1000 in 5% (w/v) BSA-containing TBS-T) for 2 h at RT. Following a triple-wash in TBS-T for 15 min each, membranes were incubated with IRDye 800CW Goat anti-Rabbit IgG Secondary Antibody (1:2000 in TBS-T) (Licor Biosciences, USA) at RT for 1 h on a shaker. Protein band intensities were measured using a Li-Cor Odyssey CLx infrared detection system (LICOR Biosciences) following the manufacturer’s instructions.
Ratiometric image analysis
Ratiometric analysis was performed using ImageJ software (v.3.91, National Institutes of Health, Bethesda, Maryland, USA). Briefly, Dnmts (green) and DNA (blue) channels of confocal images were separated, and the green one, which were later used for signal measurement, were converted to 32 bit images. Images obtained from Li-Cor Odyssey CLx infrared detection system were converted to 32 bit images. Total signal intensities, as gray values from each pixel, were measured from all embryos for microscopic images, and from the region of interest for WB images using the Image Calculation function in ImageJ software (Al-Zubaidi et al. 2021; Uysal et al. 2021). The background signals were used for thresholding.
Statistical analysis
All experiments were repeated at least in three times. One-way analysis of variance (ANOVA) followed by Dunn’s post hoc test was performed by using SigmaStat for Windows, version 3.5 (Jandel Scientific Corp). For all tests, P < 0.05 was considered statistically significant.


留言 (0)