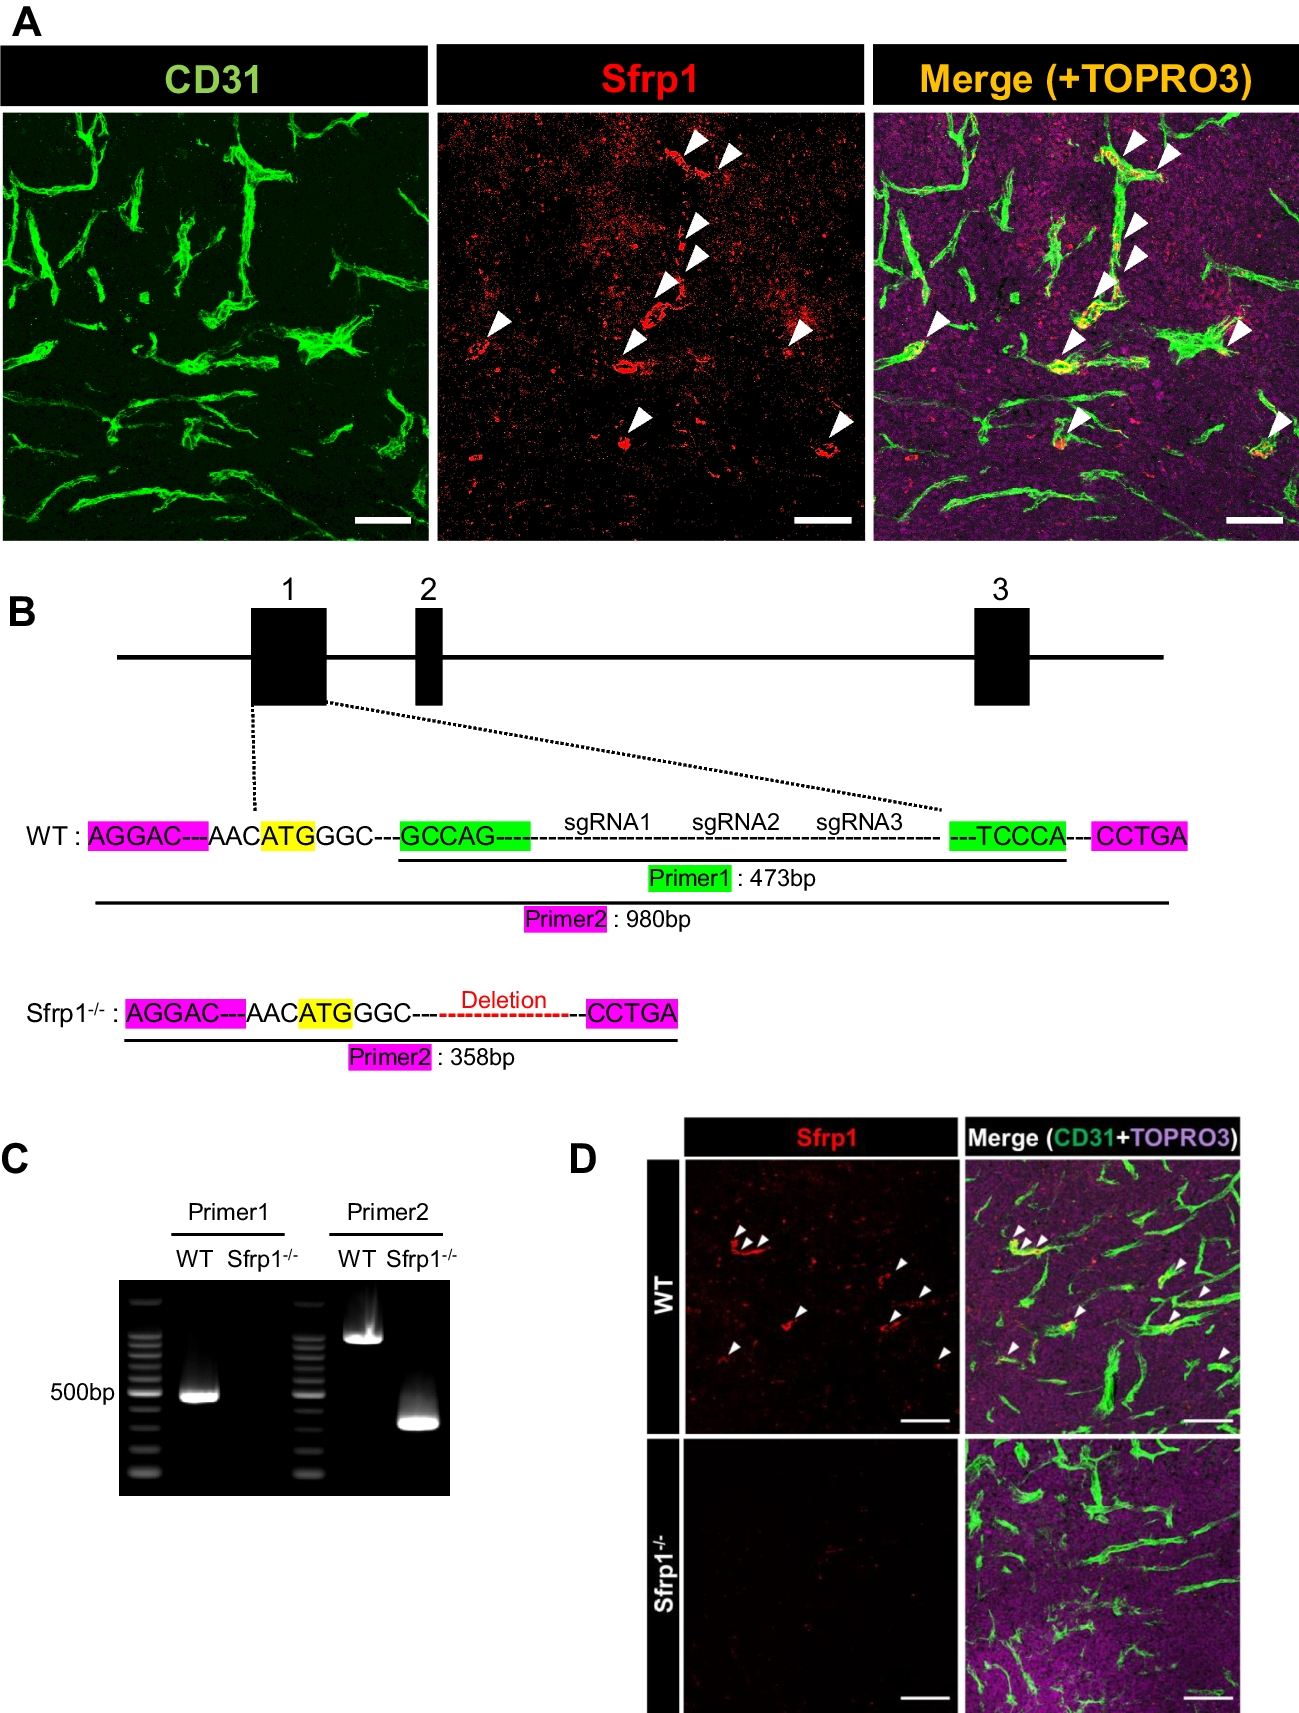
Generation of Sfrp1−/− mice using CRISPR-Cas9 technology
C57BL/6N mice were purchased from Japan SLC (Shizuoka, Japan) and Sankyo Labo Service Corporation (Toyama, Japan). Sfrp1 knockout mice were generated using the CRISPR-Cas9 genome editing system (Hashimoto et al. 2016). C57BL/6N female mice were superovulated by intraperitoneal injection of pregnant gonadotropin, and after 48 h, human chorionic gonadotropin. One-cell-stage zygotes were collected from the oviduct ampulla in M2 medium, followed by injection of a combination of single guide (sgRNA) and Cas9 mRNA through electroporation. These were then implanted into the oviducts of pseudopregnant females. The sgRNA target sequences for Sfrp1 are as follows: gRNA1, 5′-ACA TCG GCT CGT ATC AGA GC-3′; gRNA2, 5′-CTG AGG CTG TGC CAC AAC GT-3′; and gRNA3, 5′-CAA ATG TGA CAA GTT CCC CG-3′. The animals were housed in environmentally controlled rooms of animal experimentation facilities at Osaka and Fukui Universities. All experiments were carried out according to the Osaka and Fukui University Committee for Animals guidelines and approved by the Osaka and Fukui University Institutional Review Boards.
Genotype identification
Sfrp1−/− mutation was identified via Sanger sequencing. Polymerase chain reaction and Sanger sequencing were performed using the following primers: forward primer1, 5′-GCC AGC GAG TAC GAC TAC GTG AG-3′; reverse primer1, 5′-CCA AGG TAA GGG TAT GCC TTC CCA-3′ and forward primer2, 5′-AGG ACC CCA TCG ATC GGA GAC-3′; reverse primer2, 5′-CCA GTC TGG CGT TTT CCA TAC CTG-3′.
Cell lines, plasmid construction, and transfection
Cell lines, including Lewis lung carcinoma (LLC) and MC38, were purchased from the Riken BRC Cell Bank (Tsukuba, Japan). Both cell lines were cultured in Dulbecco’s modified Eagle’s medium (Sigma, St. Louis, MO) containing 10% fetal bovine serum (FBS; Gibco, Grand Island, NY) and 1% penicillin/streptomycin (100 U/mL, PS; Life Technologies, Tokyo, Japan). Full-length Sfrp1 cDNA was isolated from total mouse RNA using PCR-based cloning methods, as described previously (Hayashi et al. 2019). Primers used for cloning were as follows: sense, 5′-TCT ATC CGA ATT CAG CAA CAT GGG CGT CGG GCG-3′ and anti-sense, 5′-TCT ATC CGT CGA CTC ACT TAA AAA CAG ACT GGA-3′. The PCR product containing the EcoRI/SalI fragment was inserted into the pIRES-EGFP vector (Clontech, Mountain View, CA). LLC cells were transfected with pCMV-mSfrp1-IRES2-EGFP containing mouse Sfrp1 or a mock vector as a control. According to the manufacturer’s instructions, all cells were stably transfected using Lipofectamine 2000 (Invitrogen, Carlsbad, CA). GFP+ cells were selected based on antibiotic resistance to G418 (Geneticin; Gibco) by addition to the culture medium and sorted using flow cytometry (FACSAria, BD, San Jose, CA).
Tumor transplantation model
LLC or MC38 cells (1 × 10⁶ cells per mouse in 100 µL phosphate-buffered saline [PBS]) were inoculated subcutaneously into wild-type (WT; C57BL/6) or Sfrp1−/− mice (8–9 wk of age). Tumor volumes were measured using calipers every 2–3 d and calculated as follows: length × width × width × 0.52.
Immunostaining analysis
Tumors were fixed using 4% paraformaldehyde in PBS, treated with 15% sucrose in PBS, followed by 30% sucrose in PBS, and embedded in an optimal cutting temperature compound (Sakura Finetek, Tokyo, Japan). Frozen blocks were sectioned into slices measuring 20 or 40 µm. The following primary antibodies (Abs) were used: rat anti-mouse CD31 Ab (BD Bioscience, Franklin Lakes, NY), hamster anti-mouse CD31 Ab (Merck Millipore, Darmstadt, Germany), rabbit anti-mouse Sfrp1 Ab (Sigma), and αSMA-Cy3 (Merck Millipore). Alexa Fluor 488-conjugated anti-rat IgG (Invitrogen), Alexa Fluor 488-conjugated anti-hamster IgG (Jackson ImmunoResearch Laboratories, West Grove, PA), and Alexa Fluor 546-conjugated anti-rabbit IgG (Invitrogen) were used as secondary Abs. Cell nuclei were visualized using TO-PRO-3 (Invitrogen). The sections were examined using a STELLARIS (Leica, Wetzlar, Germany) instrument. More than four images were captured from the vascular area of each sample and analyzed using ImageJ software for quantitative measurements.
Cell preparation and flow cytometric analysis
Flow cytometry and cell isolation were performed as described previously (Hu et al. 2021). Fluorescently labeled anti-CD44, -CD133 mAbs (BioLegend) were used. The stained cells were sorted using FACSAria (BD Biosciences) or Sonysh800 (Sony, Tokyo, Japan) and analyzed using FlowJo software (Tree Star Software, San Carlos, CA).
Quantitative reverse transcription PCR (qRT-PCR)
Total RNA was extracted from cells using RNeasy-plus mini kits (Qiagen, Hilden, Germany) and reverse-transcribed using the PrimeScript RT reagent kit (Takara, Tokyo, Japan). Real-time PCR was performed using TB Green Premix Ex Taq II (Takara) on an Mx3000p QPCR system (Agilent, Santa Clara, CA). The primers used for PCR are as follows: mouse Sfrp1, sense 5′-CAG CTT TTG AAC TGG CCA CC-3′, anti-sense 5′- CCT TGC CTG GCA TCC TTG TA-3′; mouse Oct4, sense 5′- TGT TCA GCC AGA CCA CCA TC-3′, anti-sense 5′-GCT TCC TCC ACC CAC TTC TC-3′; mouse Abcg2, sense 5′- CTC ACC TTA CTG GCT TCC GG -3′, anti-sense 5′-ATC CGC AGG GTT GTT GTA GG-3′; mouse Sox2, sense 5′-ACA ACT CCA TGA CCA GCT CG-3′, anti-sense 5′-ACT TGA CCA CAG AGC CCA TG-3′; mouse Bmi1, sense 5′-GAC TCT GGG AGT GAC AAG GC-3′, anti-sense 5′-GTG AGG GAA CTG TGG GTG AG-3′; mouse Ssea1, sense 5′-ACA TCA CCG AGA AGC TGT GG-3′, anti-sense 5′-GCA CGA AGC GCT CAT AGT TG-3′; mouse Ccnd1, sense 5′-CCC TGG AGC CCT TGA AGA AG-3′, anti-sense 5′-AGA TGC ACA ACT TCT CGG CA-3′; mouse Axin2, sense 5′-CCT GAC CAA ACA GAC GAC GA-3′, anti-sense 5′-GCT TCT GCC TCG ATC TCC TC-3′; mouse Lef1, sense 5′-GGC ATG AGG TGG TC AGA CAA-3′, anti-sense 5′-TTG TTG TAC AGG CCT CCG TC-3′; mouse GAPDH, sense 5′-TGG CAA AGT GGA GAT TGT TGC C-3′, anti-sense 5′-AAG ATG GTG ATG GGC TTC CCG-3′. The results were normalized to those of GAPDH using the comparative threshold cycle method.
Statistics analysis
The data are presented as the mean ± SEM. GraphPad Prism9 software was used for statistical analysis. Data were analyzed using a t-test. The level of statistical significance was set at p < 0.05 (*p < 0.05, **p < 0.01).


留言 (0)