
記住我
Human motion is characterized by astounding dexterity, capable to achieve a broad range of movements by controlling many actuators. Such dexterity in complex movements could arise from a modular and hierarchical control of movements, where spinal and supra-spinal neural modules drive the co-activation of group of muscles to execute simple sub-movements [1] that are then combined to perform more complex movements [2–4]. Although this modularity has been observed at the neural level [5–9], its external manifestation has been mainly appreciated by observing the synergistic organisation of muscle-skeletal activation. In the case of muscle activity measured with electromyography (EMG), the coactivation patterns of a group of muscles have been defined as muscle synergies, while the simultaneous execution of a set of angular joints has been mainly defined as postural synergies [10]. Among many important types of movements analyzed in terms of modularity in motor control, like standing or gait [11, 12], human reaching has been extensively investigated [13, 14]. Also, hand synergies have been investigated under both the paradigms of muscle [15] and postural synergies [10].
According to these findings on synergic motor control, we would expect that muscle synergies of the entire upper limb would coordinate with hand postural synergies during natural movements combining reaching, grasping and object manipulation. In particular, as discussed by Santello et al [7], there is a coherent interrelation between hand synergistic behavior found in contact forces or kinematics and hand muscle synergies, reflecting neural architecture at the level of the central nervous system. The biomechanics of the hand, and of the upper limb in general, plays a fundamental role in constraining joints in limited ranges and coactivating joints together. The findings obtained from forces and joint angles in terms of synergistic control reflects modular neural models of motor control. Experimental results confirm these considerations, by assessing that kinematic synergies have their origin in synergistic muscle activation [16, 17]. Thus, we expect to predict hand posture from the muscle activity of the entire upper limb, since this myoelectric activity would provide additional information correlating with the act of pre-shaping the hand while approaching an object. This could have an important impact on myoelectric prosthetic control, as it would reinforce the command of device pre-shaping, normally obtained just from the residual forearm muscles in the trans-radial stump, when concurrently executing reaching.
Although many studies explored either muscle or postural synergies, few of them compared these two types of motor synergies during the same movements [18]. Furthermore, the simultaneous synergistic organization of shoulder, elbow, wrist, and fingers during reaching, grasping and object manipulation has been poorly investigated. Among the studies investigating reach-to-grasp motor control, some recorded EMG both from arm and extrinsic hand muscles in the forearm [19], eventually computing muscle synergies from both these two body segments [20, 21], or they investigated postural synergies between joints of the entire upper limb [22]. However, to the best of our knowledge, no studies were conducted about the simultaneous investigation of upper-limb synergies from the shoulder to the hand, both at the muscular and kinematic level, during the execution of daily-life movements to reach, grasp and manipulate objects as a continuous sequence of movements. We thus aim to extend the work of Ajiboye and Weir [18] on the hand and seek for correlation and proportional prediction between activation coefficients of arm muscle and postural synergistic [18].
We expect that, given the complexity of control required for a fast and harmonious movement to reach and grasp an object, all the muscles actuating the joints of the entire upper limb should be maximally coordinated and coactivated, and thus most of the involved joints would show highly correlated excursions. The consequence of this hypothesis would be that synergy computed on muscles of the entire upper limb would provide a better estimation of hand postures, with respect to synergy compute from the forearm only. To test this hypothesis, we concurrently recorded the activity of forearm, arm, shoulder and elbow muscles during hand movements and the kinematics of the hand.
This evidence would be particularly useful for myoelectric control of hand prostheses. In fact, muscle synergy theory has been already adapted as a framework for proportional myoelectric control [23]. In this context, synergy computation results in the dimensionality reduction of many input EMG signals, by obtaining few time-varying continuous signals used to control the actuators of a robotic prosthesis [24]. However, such an approach implies that each synergy must represent one of the two rotational directions (clockwise and anti-clockwise) of a DC electric motor actuating a single degree of freedom (DoF) [23]. In this way, the number of synergies scales with the double of the number of DoF to control, jeopardizing the original aim of dimensionality reduction for a high number of controlled DoF. We here propose instead to regress hand postural synergies from muscle synergies, and then reconstructing the wrist and finger angles from the regressed postural synergies for prosthetic control.
Thus, in this study, we aim to assess whether arm muscle activity can be useful for the estimation of hand gestures, and we hypothesise that the main reason for a correlation between arm muscles and hand posture is to be found in synergistic motor control. To do so, we identify muscle synergies responsible of actuating joints from the shoulder to the hand, and we look for correlation and regression with hand kinematic synergies in their time-varying behavior (given by synergistic activation coefficients). For the first time, we specifically look for a correlation and a regression between arm muscle synergies, actuating joints from the shoulder to the elbow, and hand postural synergies, obtained from wrist and finger joints, thus distal from the elbow. We also evaluate correlation and regression between forearm muscles and hand kinematics, and the combination of both arm and forearm muscles for hand posture estimation. Finally, we propose hand myoelectric control as a future application of this findings, by discussing how our framework fits in that scenario.
2.1. SubjectsTen healthy participants, six males and four females, (age, 30.3 ± 4.0 years; weight, 69.5 ± 15.4 kg; height, 172.4 ± 8.0 cm) voluntarily took part to the experiments after having signed an informed consent. The Italian Institute of Research Ethics Committee [CER Liguria Ref. 11 554 of 18 October 2021] approved the study protocol and procedures, assessing that all the requirements of the Declaration of Helsinki were followed.
2.2. MeasurementsWe recorded both hand movement kinematics and myoelectric activity with the experimental setup shown in figure 1.
Figure 1. Experimental setup. (a) Motion capture system and 23 reflective markers placement. (b) Muscles targeted with 16 bipolar and HD-sEMG. Two 8-x-4-channel electrode grids were used to record HD-sEMG, respectively over flexors and extensors forearm muscle groups.
Download figure:
Standard image High-resolution imageHand movement kinematics consisted in the motion capture recording of 16 reflective markers placed on arm, forearm, and hand, as in figure 1(a), by targeting the subject movements with 10 infra-red cameras (Nexus, Vicon, Denver, USA). Specifically, we placed a marker on the lateral bone prominence of the elbow (RELB), one in the middle of the forearm (RFRM), one on radius and one on ulna bone (SR and SU). The other markers were placed on the hand (figure 1(a)).
Motion capture recordings were sampled at 100 Hz and an analogic-to-digital (A/D) converter on 10-bit grayscale data was used. The DoFs targeted with motion capture were forearm pronation-supination, wrist flexion-extension, ulnar-radial deviation of the wrist, flexion-extension of the five fingers, abduction of thumb, index and little finger, and thumb adduction. We selected abduction and adduction only for the fingers where it was considered most important, i.e. thumb, index and little finger, to reduce the total number of features to be considered for the analysis. This selection was made after a preliminary manual inspection of pilot data appositely collected, by evaluating the range of motion of all the DoFs of the fingers.
Myoelectric activity was measured by recording EMG signals with two different approaches, in terms of acquiring systems and channel montages (figure 1). The first approach consisted in using 10 bipolar EMG sensors from respectively upper trapezius, anterior deltoid, middle deltoid, posterior deltoid, long head of biceps, short head of biceps, lateral head of triceps, medial head of triceps, brachioradialis and pronator teres muscles [25]. Each of these bipolar surface EMG measurements was recorded with a sensor amplifying, band-pass filtering (10–500 Hz) and digitalizing the signal locally to then send the data via wireless communication to a central station (Wave Plus, Cometa Systems, Bareggio, Italy). These signals were discretized at a sampling frequency of 2 kHz and A/D converted on 16 bits. The central station was synchronized with the motion capture system. The Wave Plus station from Cometa was connected via USB to the PC running the Vicon Nexus acquisition software. This software already accounts for the synchronization of the data coming from the Wave Plus station with the kinematics data measured through the Vicon system.
The other EMG recording approach was via high-density surface EMG (HD-sEMG) with a portable 64-channel amplifier (Sessantaquattro, OT Bioelettronica, Torino, Italy) to which two patches containing a 32-channel electrode grid each were connected (figure 1(b)). The portable system was attached to the forearm of the subject proximally 5 cm below the olecranon. The first patch (namely electrodes 1–32) was placed on flexor muscles of the fingers, while the second patch (namely electrodes 33–64) was placed on the extensor muscles of the fingers. The position of the patches was chosen as to cover the entire circumference of the forearm. Electrode grids were configured in 8 × 4 electrodes, with an interelectrode distance of 10 mm. The first grid was placed over flexor extrinsic hand muscles, in the mid of the ventral side of the forearm, while the second grid was placed over extensor extrinsic hand muscles on the dorsal side of the forearm, in the first proximal third of the forearm. Ulna palpation was used as a reference, as well as muscle palpation during required repeated contraction actuating the muscles of interest, according to [26]. The signal was sampled at 2 kHz and A/D converted on 24 bits. The HD-sEMG recording was synchronized with the Vicon motion capture system. Data acquisition was driven by two computers (Windows operating system). One ran the Vicon software, while the other ran a GUI implemented in Matlab (Mathworks) to acquire HD-sEMG data. A real-time target machine (Speedgoat) was used to synchronize all the connected devices.
2.3. Experimental protocolParticipants sat in a comfortable posture in front of a table on which different objects were placed at the beginning of each task. Each task consisted in 10 repetitions of movements, starting from a rest position with the elbow bent at 90° and the wrist aligned with the forearm. The six tasks consisted in:
Frontal reaching with spherical grasp, bringing the spherical object close to the mouth (like eating some fruit), then placing back the object on the table and come back to rest (EatFruit);Frontal reaching without grasp and come back to rest (FroRea);Frontal reaching to grasp a cylindrical glass, acting to pour water from the glass, then placing back the glass on the table and come back to rest (Pour);Frontal reaching to grasp a cylindrical object and come back to rest (ReaCyl);Frontal reaching to grasp a spherical object and come back to rest (ReaSph);Frontal reaching to grasp the cap of a bottle with a tripod pinch, screwing the cap to open and then close the bottle, and come back to rest (Screw).The tasks were chosen to investigate how the same synergies could simultaneously explain (a) reaching without grasp (FroRea), (b) differences in the type of grasp (ReaCyl vs ReaSph), and (c) differences among two different reach-to-grasp movements (with complex movements like EatFruit, Pour and Screw)
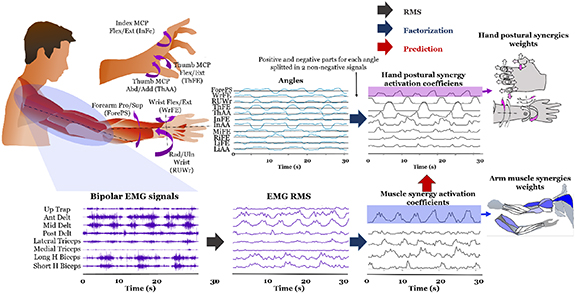
2.4. Computational procedures and rationaleThe overall computational procedure for this study is described in figure 2. As explained in detail in the following section, synergy extraction by non-negative matrix factorization (NMF) implies the identification of a spatial time-invariant pattern, the synergistic weights, and time-varying synergistic activation coefficients. Each activation coefficient is a signal in time representing how a synergy is modulated by the central nervous system in time, and it presents the same time support of the original factorized signals (either EMG root mean square (RMS) or hand joint angles). The synergistic weights are seen as the synergies themselves, which represent a time-invariant synergistic pattern prescribed by the central nervous system and modulated by supra-spinal descending signals [4].
Figure 2. Overall computational procedure which includes signal pre-processing, muscle synergy identification and prediction between muscle and postural synergy activation coefficients. An example of representation for synergy weights of both types is provided with a graphical functional representation on the right part of the figure.
Download figure:
Standard image High-resolution imageFor each muscle synergy identified for different muscle grouping, we looked for a correlation between muscle and hand postural synergistic activation coefficients in the time domain. We then predicted hand postural synergies by regression of muscle synergies. Muscle synergies were extracted from arm (more proximal than the elbow) and forearm muscles, separately. For calculation of postural synergies, the negative values of angles were rectified and used as additional input to the NMF algorithm.
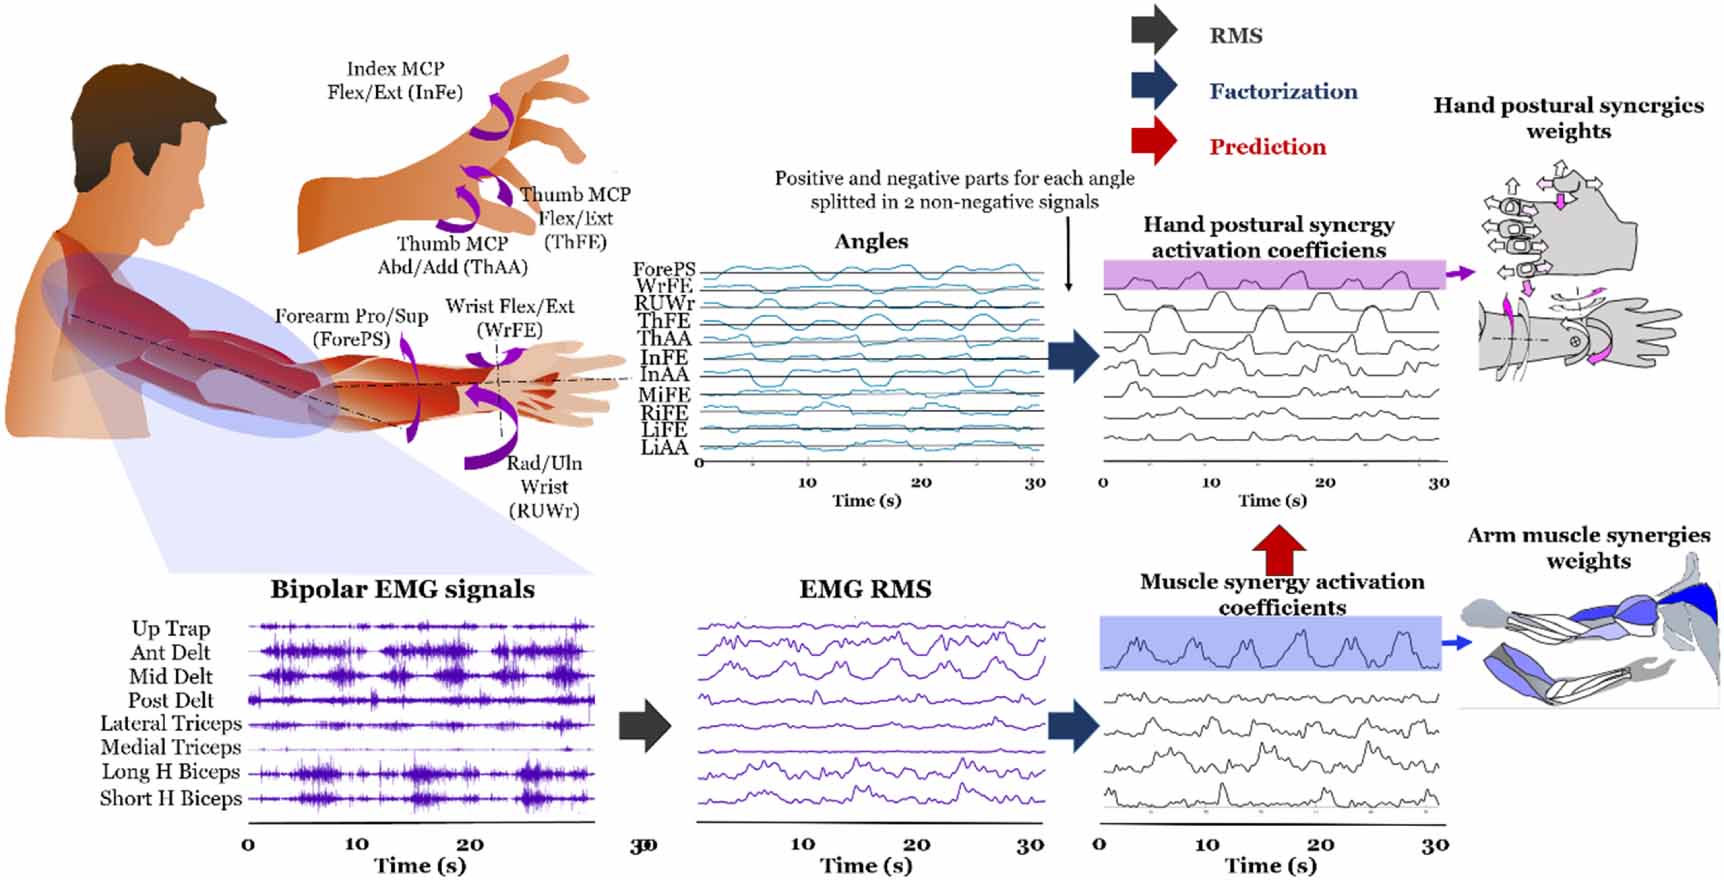
We tested whether we could predict time-varying hand postural synergies from the time-varying activation coefficients of either arm or forearm muscle synergies. As represented in figure 3, the main goal was to describe M hand DoFs with a lower N number of control signals, constituted by the predicted hand postural activation coefficients by regression from muscle synergies activation coefficients.
Figure 3. Future application of the presented framework. By combining muscle synergies activation coefficients of arm and forearm we want to infer hand postural synergy activation coefficients. An example of time-invariant synergy weights in an anatomical graphic way is represented respectively in panel (a) for muscle synergies (coloured muscles of the arm and forearm) and (b) for postural synergies (coloured arrows indicating joint movements). Colorbars indicate the color code for anatomical representations. (c) Main advantage of the framework: M hand DoFs can be described with a lower number N of signals by regression from muscle synergies activation coefficients extracted from upper-limb muscles.
Download figure:
Standard image High-resolution imageFinally, we investigated shared synergistic behavior among subjects and calculated synergy prototypes in space and time, representative of all the subjects, by clustering muscle synergies as described in the following section. The reason for performing this analysis is twofold. First, we aimed to assess synergy variability across subjects. Second, we aimed to investigate the feasibility of a synergy-based myoelectric prosthesis control. For example, in the context of multi-DoFs system, in which the low-level control (i.e. the reference control signals provided to the actuators of each DoF of the prosthesis) is driven by the synergies. In this context, a control architecture based on data from many subjects, may provide a more robust and reliable control.
2.5. Signal processingEMG signals were band-pass filtered between 20 and 500 Hz [27]. The HD-sEMG signals were reconfigured, for each signal, as single-differential recordings, by subtracting each 8-channel row of a grid to the following, to obtain 3 × 8 single-differential HD-sEMG channels per grid. This was done to attenuate crosstalk and common noise [28], and to be consistent with the bipolar recording of the other single-channels recordings from sensors over arm and forearm muscles.
The RMS value of the EMG signals was computed with non-overlapping 100 ms windows [29], and with low pass filtering the RMS signals at 2 Hz. The resulting sampling frequency of the filtered RMS signals was then 10 Hz.
Angles from the anatomical joints targeted with motion capture (described in section 2.2) were computed from the 3D marker positions, which consisted in a numerical matrix with dimension number-of-samples x number-of-measured variables, where the number of measured variables was the number of markers per the three coordinates (x,y,z) of each marker. The Vicon Nexus software was utilized to extract anatomical joint angles from markers' trajectories. For this purpose, two Vicon models, namely Plug-in-Gait and RHand bodybuilder, were employed. A reduced version of the Plug-in-Gait model was used to calculate the joint angles for the whole upper arm, while the RHand bodybuilder model was utilized for the finger joints. These Vicon models define the rigid body segments linking two consecutive markers on the body. Then, a standard inverse kinematics approach was applied through the Vicon Nexus software to obtain the anatomical joint angles for the whole upper arm based on the markers' trajectories. Angles were down-sampled to 10 Hz and low-pass filtered to 2 Hz to be consistent with the myoelectric signal processing.
2.6. Signal extraction and number of synergiesThe 2 Hz down sampled signals (both myoelectric and kinematic) obtained for each repetition and task, were concatenated to identify synergistic organization by NMF across all tasks. Each signal was then normalized by its absolute maximum across all tasks [13]. Hand angles signals were divided in two signals, respectively the positive part and the rectified negative part, to have non-negative quantities to factorize by NMF. So, for each DoF, the two directions of movement were encoded by two separated non-negative signals. In other words, we split the positive and the negative part of each angle to create two angle signals for each original angle. Once the 'negative' part was separated from the 'positive', each part was considered between 0 and a positive maximum, to be compliant with NMF. By doing so, we simply established that for each DoF there are two excursion angles instead of one, e.g. one for flexion and one for extension, each ranging from 0 to a positive value.
As mentioned in Sec. Measurement, the angles selected to be factorized by NMF were flexion and extension of the wrist, pronation and supination of the forearm, ulnar and radial deviation of the wrist, flexion and extension of the five fingers (10 non-negative signals), adduction and abduction of the thumb, and abduction of index and little fingers, for a total of 20 non-negative signals.
NMF of such concatenated signals allowed to compute: (a) arm muscle synergies from the eight bipolar EMG signals more proximal than the elbow; (b) forearm muscle synergies from the two bipolar EMG signals on the forearm plus the two single-differential HD-sEMG grids (3 × 8 signals); and (c) hand postural synergies from the angles of the hand.
The NMF factorization decomposed each input, shaped as a non-negative matrix X, with I rows representing the number of variables and T columns representing their temporal samples, as follows [30]:

where W is the time-invariant I × S matrix of the synergies, and H is the time-varying S × T matrix of the activation coefficients, with S being the number of identified synergies (S ⩽ I). How each input variable contributes to a synergy is defined in matrix W for each column, while the temporal trend of each synergy during the execution of the six tasks is described by the rows of matrix H.
The NMF algorithm was iterated 100 times, but stopped when a termination tolerance equal to 1 × 10⁻⁴ was reached for the residual error between X and W × H. Each of these iterations was repeated 10 times [13] and matrices W and H were each time initialized with different random values. To quantify the reconstruction of the original input matrix X, for the different types of input, by the product of W and H, the coefficient of determination (R2) was computed as in [31]. For each number of synergies, the greatest R2 among the 10 NMF repetitions was considered as representative R2, to obtain a R2 curve in function of the number of identified synergies [31].
For each input (e.g. EMG or kinematic data), we run the NMF imposing a number of synergies ranging from 1 to a maximum number of 10, following a pilot processing of the data, where for all types of synergies a dimensionality lower than 10 was sufficient for good reconstruction. The final number of identified synergies was determined by finding the number of synergies corresponding to the change in slope of the R2 curve [13]. To quantify this, the mean squared error (MSE) was computed for a line fitting the part of the R2 curve from each number of synergies between 1 and 9, to the maximum number evaluated, i.e. 10 [13]. The number of synergies was determined for the minimum MSE value exceeding 10 × 10−4 [13].
2.7. Cross-correlation between muscle and hand postural synergistic activation coefficientsCross-correlation, normalized between −1 and 1, was computed for each subject between each pair of activation coefficients of a muscle synergy and a hand postural synergy, separately for arm or forearm muscle synergies. So, given two activation coefficient matrices Hmusc and Hang, with size S1 × T, and S2 × T, for each j ∈ [1,S1] and k ∈ [1,S2], the cross-correlation function is defined as
where m is the discrete time support and n is called displacement or lag.
The value of the peak of the cross-correlation function was taken as measure of correlation between each pair. By progressively considering the most correlating pair, we defined in descending order the most correlating pairs of synergies between arm/forearm synergies and hand postural synergies.
2.8. Clustering of synergies and shared spatio-temporal pattern across subjectsThe time-invariant weights describing the synergies were clustered across all participants by hierarchical clustering [32], separately for muscle synergies and postural synergies. To do so, synergies of all subjects were concatenated together, separately for arm muscle, forearm muscle and hand postural synergies. Thus, for each identified cluster, we expected to have one or more synergies of different subjects. To determine the number of clusters, we took the highest integer lower than the mean number of synergies identified across subjects, respectively for muscle and postural synergies. After computing the clusters, we adjusted each cluster by a criterion forcing to have no more than one synergy of the same subject per cluster [12]. To implement this criterion, for each cluster we first computed the similarity of each synergy with all the other synergies of that cluster. Then, among synergies of the same subject found into the same cluster, we kept only the one presenting the highest similarity with the other synergies of the cluster. Spare synergies excluded by the clusters were relocated with the following approach: (a) check for each cluster whether some subject is not represented with one synergy (b) if so, check if among the spare synergies there is one synergy with highest similarity with the elements of the cluster, then insert this synergy in the cluster. With this approach, the final number of clustered synergies could change with respect to the identified number of synergies following single subject analysis. The centroid of each cluster was computed by averaging the synergies into that cluster. Each cluster prototype represents the shared information across similar synergies of all subjects (all-subjects synergies). All-subjects synergies centroids were then used to reconstruct the activation coefficients for each subject. Importantly, while for single-subject synergies, the number of synergies could differ for each subject, for all-subjects synergies, by imposing the same set of synergies to each subject, we obtained the same number of synergies and thus of activation coefficient for each subject. Mathematically, this operation can be computed by having the matrix of the centroids (the all-subject synergies) as the W matrix mentioned above to describe the NMF computation, and then multiplying the inverse of W for the input matrix X, where X is the original data of each subject (RMS for muscle synergies, angles for postural synergies). So, for each subject we obtained a new matrix H of the activation coefficients.
As done for the time-invariant all-subjects synergies, averaged across all subjects for each cluster to get the cluster centroids, we calculated an averaged estimation of the time-varying all-subjects synergistic activation coefficients across subjects. This was done by segmenting the reconstructed activation coefficients of each subject by the onset and offset of each of the 10 repetitions of each task, obtained by with simple thresholding of the kinematics data. Then, the 10 repetition segments for each participant, each task and each synergy, were resampled by the mean number of samples of the onset-offset intervals for that task across the 10 subjects. By doing so, instead of resampling all the segments of every task for the same fixed number of samples, we obtained a different time support for each task proportional to the duration of that task.
Finally, we computed the cross-correlation between the new all-subjects synergistic activation coefficients for muscles versus postures. To do so, we computed the cross-correlation between all-subjects muscle and hand postural synergistic activation coefficients, separately for arm and forearm muscle synergies, for all the possible pairings of synergies for each task. Then, the mean across tasks of cross-correlation peak value was taken to form the most correlating pairings between all-subjects synergies in descending order, like done for subject-specific synergies, described in section 2.7.
2.9. Hand postural synergy regression from muscle synergiesWe evaluated the regression of hand postural synergies from muscle synergies extracted respectively from arm and forearm muscles, and from their combination. Also, we compared this analysis with the regression of hand joint angles directly from the RMS values used by NMF to compute the muscle synergies. Again, the RMS values for regressing hand joint angles were considered for arm and forearm muscles separately, and for their combination.
We compared the regression obtained with linear regressor (LR), k-nearest neighbor (KNR), random forest (RFR), and support vector machine (SVR) [33]. Train and test dataset were divided with a ratio of respectively 80% 20% of the whole data. Regression was performed separately on the data of each subject. The performance both for training and test of each model was evaluated in terms of the coefficient of reconstruction R2, as defined for computing synergy reconstruction of the original data.
2.10. Statistical analysisA paired t-test was conducted to establish significant difference between (a) numerosity of arm muscle, forearm muscle and hand postural synergies, (b) reconstruction of hand postural quantities (postural synergy activation coefficients or joint angles) from arm, forearm and arm + forearm muscle synergies, (c) prediction of hand posture from muscle synergies or with original signals (EMG RMS signals to predict hand joint angles). The significance level was set to 0.05.
3.1. Number of identified synergiesThe number synergies identified for the 10 subjects was respectively 4, 3, 4, 4, 4, 5, 5, 5, 4, 5 (4.3 ± 0.6) for arm muscle synergies, 6, 5, 5, 5, 6, 4, 5, 6, 5, 6 (5.3 ± 0.6) for forearm muscle synergies, and 7, 7, 7, 6, 6, 7, 6, 6, 7, 7 (6.6 ± 0.5) for hand postural synergies. Thus, the dimensionality of hand postural synergies identified is significantly higher than the one of respectively arm (p = 4.6 × 10⁻⁸) and forearm muscle synergies (p = 6.6 × 10⁻⁵). Also, the dimensionality of arm muscle synergies was significantly lower than the one of forearm muscle synergies (p = 1.9 × 10⁻³). The value of R2 for the number of synergies identified with the change in slope criterion described in section 2.6 of methods was respectively 0.93 ± 0.03 for arm muscle synergies, 0.82 ± 0.02 for forearm muscle synergies, and 0.79 ± 0.04 for hand postural synergies, across subjects.
3.2. Correlation among different types of synergies per subjectFigure 4 reports the values of cross-correlation peaks between muscle and hand postural synergistic activation coefficients for each subject, respectively for arm muscle synergies and for forearm muscle synergies, separately paired with postural synergies.
Figure 4. Mean and standard deviation of cross-correlation (XC) peaks between muscle and hand postural synergistic activation coefficients for each subject, respectively for arm muscle synergies and for forearm muscle synergies.
Download figure:
Standard image High-resolution imageFigure 5 shows, for a randomly chosen subject (# 3), the time-invariant weights and the time-varying activation coefficients for pairs between arm muscle synergies and hand postural synergies. The pairs are sorted in descendent order by their cross-correlation (XC) peak value, from top to bottom. As described in figure 3, time-invariant weights are represented graphically with bar graphs, and with anatomical maps for muscle synergies and with angle directions for postural synergies, to enable an easier functional interpretation. Time-varying activation coefficients are represented as the mean and the standard deviation (shadow area) of the 10 repetitions for each task. The values of cross-correlation between the synergy pairs are also reported.
Figure 5. Pairs of arm muscle synergies (in blue) and hand postural synergies (in purple) of subject #3, paired in descending order by their cross-correlation peak value, from top to bottom for subject #3 (each row in the figure is a synergy pair). Synergy weights are shown with a graphical functional representation (darker colors represent higher activation in arm and hand representations) and synergy activation coefficients are shown averaged across the 10 repetitions executed for each task. See figure 3 for legends and graphical interpretation of the synergies.
Download figure:
Standard image High-resolution imageThe first pair of synergies (XC = 0.80) suggests a correlation between the posterior deltoid and the act of shaping the hand by abducting the thumb, extending the index finger, and flexing the little finger, while supinating. The hand postural synergies for all the tasks have a peak at the middle of the reaching repetition, except for the frontal reaching without grasp (FroRea). It presents its maximal activity for cylindrical grasp (ReaCyl). Also, it is present in the act of grasping a glass before pouring the water in it (Pour), in the phase of opening the hand to grasp and to release (depression at the very center of the task, in the act of pouring). Finally, it is present during spherical grasps in EatFruit and ReaSph. The act of the posterior deltoid has mainly a stabilisation function. This is true also for reaching followed by screwing a bottle cap (Screw), in the phase of opening the hand to grasp and to release the bottle cap (depression at the very center of the task, when screwing the cap).
The second synergy pair (XC = 0.71) is clearly associated to closing the hand while grasping (postural synergy) and it positively correlates with muscle activity of the triceps which extend the elbow in the act of stretching the arm for reaching the object.
The third synergy pair (XC = 0.65) is maximal in temporal activity for Pour and it matches in the functional interpretation of the corresponding postural synergy which pronates the wrist. In fact, pronation is also largely used for spherical grasping, used in EatFruit and ReaSph, which present peaks for this synergy in the act of grasp the spherical object. Also, the postural synergy includes thumb flexion and wrist ulnar deviation, confirmed in the peak of postural coefficients during Screw, which needs these movements in the act of screwing the bottle cap. Interestingly, the most activated arm muscles in this action are the long head of the biceps and the upper trapezius, supposedly to stabilize the pronation movement.
Finally, the fourth synergy pair (XC = 0.60) may suggest that the short head of the biceps brachii stabilize the elbow, meanwhile ulnar deviation is executed during grasping. Interestingly, in the only reaching not followed by a grasp (FroRea) the postural synergy is maximally expressed at the beginning and at the end of the movement for the considered subject.
Figure 6 shows the comparison between forearm muscle synergies and hand postural synergies paired and ordered with the same criterion of figure 5, for the same subject (#3). The first pair of synergies (XC = 0.76) expresses hand opening, as indicated by the time-invariant activation of the extensors of the forearm (radial part) and finger extension of all angles. The time-varying coefficients indicate that this pair of synergies consists in the pre-shaping for a cylindrical grasp (mainly activated in ReaCyl and Pour) and in the act of releasing the object (2 activation peaks are present in these tasks).
Figure 6. Pairs of forearm muscle synergies (in blue) and hand postural synergies (in purple) paired in descending order by their cross-correlation peak value, from top to bottom, for subject #3 (each row in the figure is a synergy pair). Forearm EMG channel for each muscle synergy represents brachioradialis and pronator (first 2 channels on the top, the single differential of flexor forearm muscles (first 3 rows) and the single differential of extensor forearm muscles (second 3 rows). Synergy weights are shown with a graphical functional representation (darker colors represent higher activation in arm and hand representations) and synergy activation coefficients are shown averaged across the 10 repetitions executed for each task. See figure 3 for legends and graphical interpretation of the synergies.
Download figure:
Standard image High-resolution imageThe second pair of synergies (XC = 0.69) represents wrist pronation with activation of the pronator, the brachioradialis and of extensors of the forearm.
The third pair of synergies (XC = 0.67) represents the phase of opening the hand before starting a new repetition of any reaching (as can be deducted by observing the activation coefficients), with a concurrent activation of the flexor muscles.
The fourth pair of synergies (XC = 0.59) represents wrist supination and thumb adduction for grasping an object, and the radial part of the extensor muscles is more activated.
The fifth pair of synergies (XC = 0.55) is maximally active during object grasping, as it includes fingers flexion and activation of the ulnar part of the extensor muscles.
3.3. Spatiotemporal evaluation of all-subjects synergiesTo find shared common synergistic spatiotemporal patterns across subjects, synergies of all subjects were clustered by forcing to have only one synergy per subject into a cluster (see Methods). With this method, we found respectively four cluster for arm muscle synergies, four clusters for forearm muscle synergies and six clusters for postural hand synergies. Figures 7 and 8 show the cluster centroids for the three types of identified synergies, respectively for arm and forearm muscles. Centroids are represented both functionally and with bar graphs to show variability among elements in the cluster. In order to analyze and interpret the time-varying component of synergies, the 10 repetitions per task were segmented and resampled for each subject for each all-subjects synergy from the reconstructed activation coefficients starting from the all-subjects weights (for more details see Methods). Then, by averaging all these segments across subjects, we obtained one segment for each all-subjects synergy and for each task.
Figure 7. All-subjects arm muscle synergies and average activation coefficients. The all-subjects average cycles per task are colored in cyan, while the shaded areas and correspondent continuous lines are the averaged repetitions for each subject per task. See Methods for computational details and figure 3 for legends and graphical interpretation of the synergies.
Download figure:
Standard image High-resolution imageFigure 8. All-subjects forearm muscle synergies and average activation coefficients. The all-subjects average cycles per task are colored in cyan, while the shaded areas and correspondent continuous lines are the averaged repetitions for each subject per task. See Methods for computational details and figure 3 for legends and graphical interpretation of the synergies.
Download figure:
Standard image High-resolution imageRemarkably, for 3 out of 4 clusters for arm muscle synergies, the centroids are representative of all the 10 subjects, while the fourth centroid excludes only one subject. For forearm muscle synergy centroids, 2 out of 4 include all subjects, while the other 2 only 7. For hand postural synergies, 4 out of 6 centroids include all subjects, while the other 2 respectively 6 and 8 subjects.
The average cosine similarity between the synergy weights of each cluster and the synergy weights of the relative centroid are respectively 0.81, 0.84, 0.95, 0.81, 0.98, 0.88 for the 6 all-subjects hand postural synergies, 0.95, 0.89, 0.95, 0.94 for the arm muscle synergies, and 0.90, 0.88, 0.87, 0.86 for the forearm muscle synergies.
By looking at arm all-subjects synergies (figure 7), the first synergy seems to activate both lateral and medial heads of triceps. This synergy can be functionally interpreted as extension of the elbow and high triceps activation and its time-varying behavior perfectly matches this functionality, since a bell curve is observed for each extension in the task. For EatFruit and ReaSph the bell curves are 2, while for all the others there is just 1, with Screw presenting a unique pattern in between, due to the complexity of the task. The second synergy involves mainly upper trapezius and long head of biceps brachii in its time-invariant representation. Its time-varying behavior presents a peak in correspondence to the grasp execution for all the task, although with different patterns. In fact, the peaks look higher for grasps concurrent with pronation like EatFruit, Pour and ReaSph. This is compatible with the interpretation for the single subject in section 3.2, where long hand biceps in synergy with upper trapezius are supposed to stabilize the arm during pronation. The third synergy activates the middle-posterior deltoid and looks timely activated during reaching and coming back, while presents a depression during grasping. Moreover, for EatFruit, this third synergy is responsible of positioning the arm in the act of 'eating' the fruit. Finally, the fourth synergy activates the short head of biceps brachii and indeed it is timely activated to flex the elbow at the beginning of the reaching and to bring back the arm after the grasp.
Observing forearm muscle synergies (figure 8), the first synergy activates more the ulnar part of the extensor forearm muscles. This synergy clearly activates during pronation, mainly in EatFruit, Pour, ReaSph and Screw (in the act of screwing the bottle cap). In terms of their time-invariant activations, the second synergy involves the radial part of the extensor forearm muscles and brachioradialis, the third mainly coactivates brachioradialis and pronator teres, while the fourth presents a major activity for the flexor forearm muscle group. However, for these last three forearm muscle synergies, a clear pattern across all subjects does not emerge. We provide an interpretation of this in Discussion.
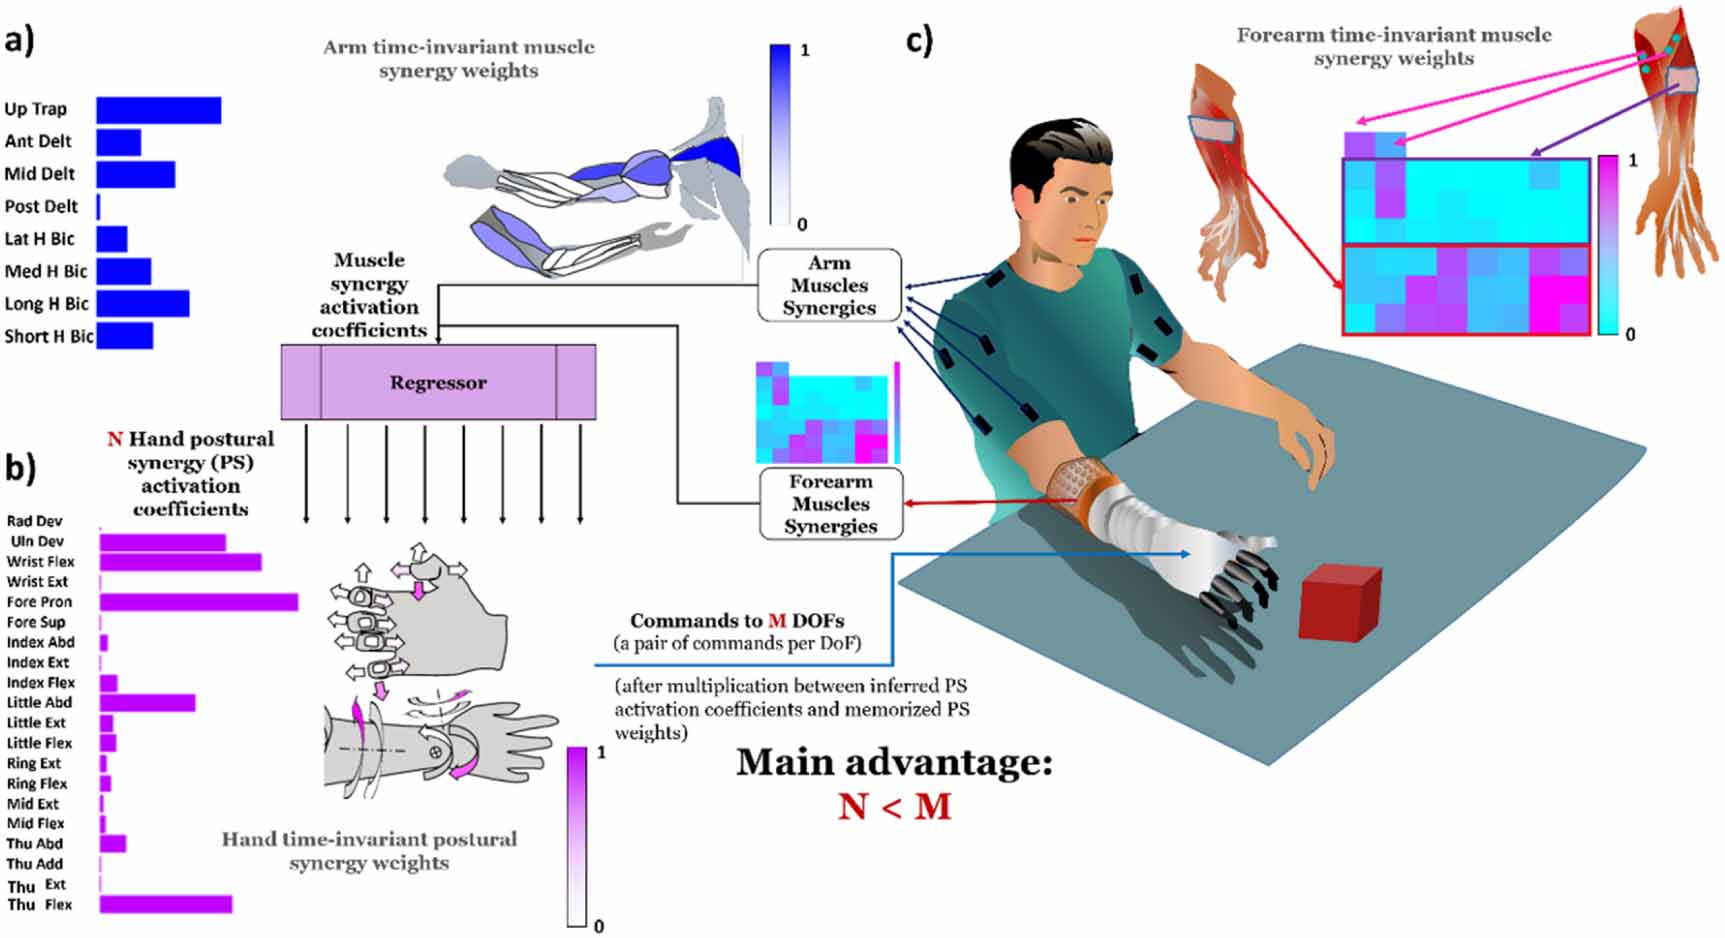
Finally, for the hand postural synergies (figure 9), we identified (proceeding top to bottom) functional interpretation respectively for (a) thumb-little flexion while index extends, (b) supination and radial deviation of the wrist, (c) hand closing, (d) thumb extension-abduction, (e) hand-opening and (f) wrist pronation and ulnar deviation. Interestingly, by applying unsupervised techniques to natural reaching-grasping tasks, we identified six actions, which are largely used for control of robotic hand prostheses.
Figure 9. All-subjects hand postural synergies and average activation coefficients. The all-subjects average cycles per task are colored in cyan, while the shaded areas and correspondent continuous lines are the averaged repetitions for each subject per task. See Methods for computational details and figure 3 for legends and graphical interpretation of the synergies.
Download figure:
Standard image High-resolution imageThe first postural synergy, which from its time-invariant part looks the pre-shaping of a tripod pinch, is largely activated as a bell curve for all grasps (so for FroRea is flat).
This explains the two bell curves for EatFruit, because it is mainly activated before to close the grasp around the object and when releasing. The larger activity is for ReaCyl, where the cylindrical grasp could mainly interest the flexion of the thumb and of the little finger, by prevalently extending the index, and Screw, where exactly a tripod pinch is performed. The second synergy is the one executing wrist supination, maximally high at the centre of EatFruit when the forearm is supinated in the act to eat the fruit, and it is also activated at the beginning and at the end of each reaching movement. It presents a deep depression at the center of Pour where pronation, i.e. the opposite movement of supination, is performed. The third synergy mainly encodes a spherical grasp, although is also high for the tripod grasp in Screw, which resembles more the pre-shaping of a spherical grasp than a cylindric one. The fourth synergy reveals a finger movement, thumb adduction-extension, very active at the very beginning of a reaching cycle and when completing the movement to bring back the arm. The fifth synergy is clearly for hand opening both in its time-invariant and time-varying representation, while the sixth is confirmed to be the wrist pronation postural synergy.
In table 1 the cross-correlation peaks with hand postural synergy repetitions, respectively for arm and forearm all-subjects muscle synergy repetitions is reported, by sorting the most correlated pairs in descending order. The cross-correlation peak value reported in the table (XC) is the average across the cross-correlation peak values for the respective pairs of all-subjects repetition segments for each task.
Table 1. Values of cross correlation (XC) with hand postural synergies (PS) respectively for arm and forearm muscle synergies (MS) in terms of their activation coefficients (time-varying) for the all-subject synergies. The # of each synergy indicating each muscle-postural synergy pair is correspondent to the order in figures 7–9. The value of XC for postural synergies excluded by the pairing due to termination of corresponding muscle synergies, are reported with grey-shaded cells, paired with muscle synergies already paired with other postural synergies above.
# Arm MS# Hand PSXC# Forearm MS# Hand PSXC320.98220.9526
留言 (0)