
記住我


CUR (> 98.0% purity) was obtained from Solarbio (China). 4-Hydroxyphenylboronic acid pinacol ester (PBAP), N,N’-carbonyldiimidazole (CDI), and sodium hyaluronate (HA) were acquired from Macklin (China). The reverse transcription kit was purchased from Accurate Biology (Hunan, China). The RNAeasy™ Animal RNA Extraction Kit and Reactive Oxygen Species Assay Kit were provided by Beyotime (China). The SYBR Prime qPCR Set and Cell Counting Kit-8 (CCK-8) were procured from Bioground (China). Hematoxylin and eosin (H&E) staining kits and tartrate-resistant acid phosphatase staining kits (TRAP Stain Kit) were purchased from Solarbio (China). Cyanine 5.5 (Cy5.5) and lipopolysaccharide (LPS) were sourced from Sigma-Aldrich (USA). Live/Dead BacLight Bacterial Viability Kits were provided by Bestbio (China). All other reagents used were of analytical grade.
Preparation of PBAP-modified HA (HA-CDI-PBAP)The preparation of HA-PBAP was carried out with reference to previous reports and improved [18]. First, 4 mM of PBAP and 8 mM of CDI were dissolved in 5 mL of dichloromethane, respectively. These solutions were then combined in a 50 mL round-bottom flask and stirred at 40 °C in an oil bath for 1 hour. The reaction product was washed three times with ultrapure water, followed by an extraction with saline on the fourth wash. Subsequent rotary evaporation yielded pure PBAP-CDI. 6 mM of PBAP-CDI and 1 mM of HA were added to 20 mL of DMSO, and then 7.2 mM of DMAP was added, and ultrasonication was performed to dissolve the reaction, and the reaction was stirred overnight at 40 ℃ in an oil bath, and then dialyzed and lyophilized to obtain the HA-CDI-PBAP. The chemical structure of the material was characterized by Fourier-transform infrared spectroscopy (FT-IR) and proton nuclear magnetic resonance (1H-NMR).
Preparation of CUR nanoparticles (HA@CUR NPs)CUR (6 mg) was dissolved in 2 mL of dimethyl sulfoxide (DMSO) and mixed with 60 mg of HA-CDI-PBAP under sonication for a co-dissolution process. The resulting solution was then transferred into a dialysis bag (molecular weight cutoff: 3500 kDa) for dialysis. During dialysis, the aqueous solution outside the dialysis bag was replaced every 2 h for a total duration of 6 h. Subsequently, the HA@CUR NPs were obtained through freeze-drying and stored at -20 °C in the dark. Note: Synthesis of HA-Cy5.5 NPs: 100 mg of PBAP-CDI-HA and 251 mg of 1-[3-dimethylaminopropyl]-3-ethylcarbodiimide (EDC) and 151 mg of N-hydroxysuccinimide (NHS) were activated for 8 h in 10 mL DMSO at room temperature. 5 mg Cy5.5-NH2 was dissolved in the above solution, supplemented with DMSO as appropriate, reacted for a further 24 h, dialyzed and lyophilized. 5 mg Cy5.5-NH2 was dissolved in the above solution, supplemented with DMSO as appropriate, reacted for a further 24 h, then HA-Cy5.5 nanoparticles can be obtained after dialysis and lyophilization.
A UV-visible spectroscopy scan was employed to establish a standard curve of different concentrations of CUR. This curve was then used to determine the encapsulation efficiency and drug loading content of the NPs.
Encapsulation efficiency of CUR (%) = Mass of CUR in NPs / Initial mass of CUR used × 100%.
Drug loading content of CUR (%) = Mass of CUR in NPs / Total mass of NPs × 100%.
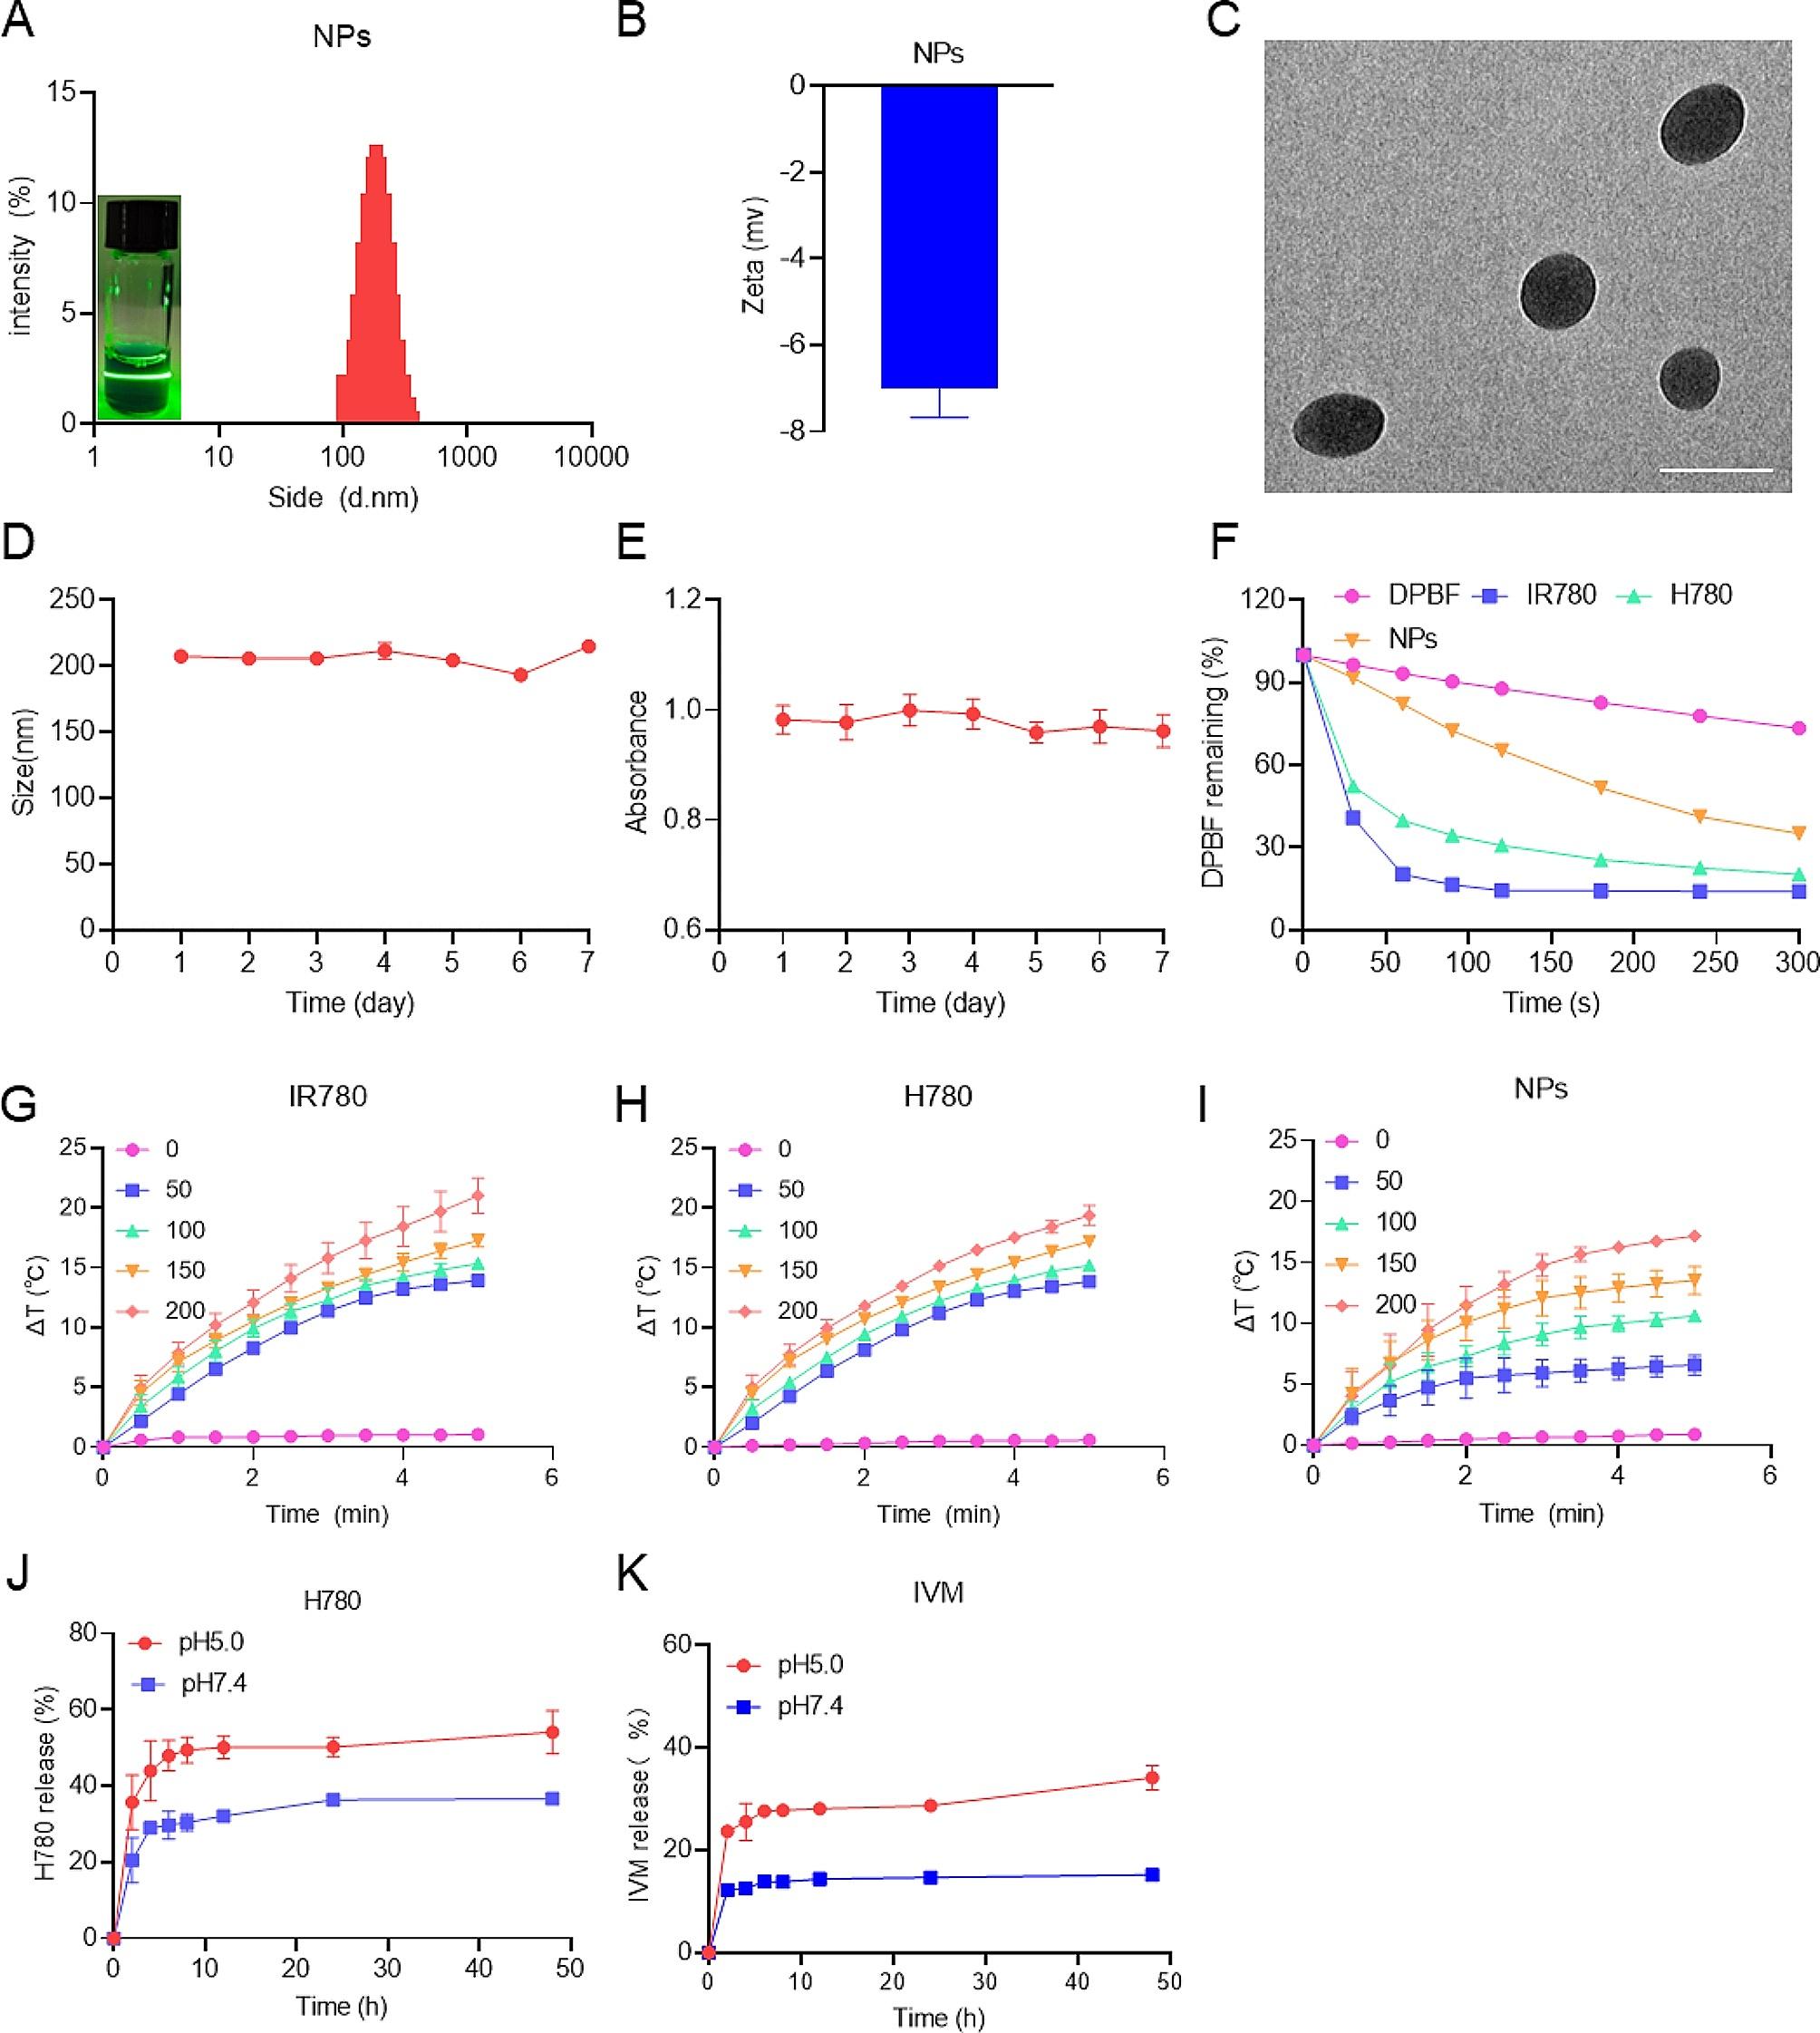
Characterization of HA@CUR NPsDynamic light scattering (DLS) measurements of the size distribution and zeta potential of HA@CUR NPs in aqueous solution were conducted on a Nano ZS90 instrument. The stability of HA@CUR NPs was monitored by measuring the size and polydispersity index (PDI) of the nanoparticle solutions stored at 37 ℃ at fixed time intervals.
The morphology and size of the HA@CUR NPs were examined using transmission electron microscopy (TEM).
The interactions between the drug and carrier materials within the NPs were further analyzed by FTIR.
X-ray diffraction (XRD) patterns of free CUR, blank NPs, and HA@CUR NPs were acquired using an X-ray diffractometer (PANalytical X’Pert Powder, Panalytical B.V., Netherlands) operating with Cu Kα radiation. The scattering angles ranged from 3 to 50 degrees.
Study of ROS responsivenessIn vitro ROS-Responsive drug release assayThe ROS-responsive release of the drug from NPs was evaluated using a dialysis method. To begin, 1 mL of HA@CUR NPs solution (concentration: 650 µg/mL) was placed into a dialysis bag with a molecular weight cutoff of 3500 Da. This bag was then submerged in 30 mL of phosphate-buffered saline (PBS) at different H2O2 concentration (0, 10, 100, 1000 µM) at a pH level of 7.4, and the release was performed at 37 °C with gentle agitation in an incubator. At specific time intervals (0.5, 1, 2, 4, 8, 12, 24, and 48 h), a 3.0 mL aliquot of the dialysate was withdrawn from the exterior of the bag and immediately replenished with an equal volume of fresh release medium to maintain a constant volume. The absorbance was determined using a UV-visible spectrophotometer. Using a standard curve, the concentration of CUR present in the samples was calculated, which allowed for the quantification of the released drug. The cumulative percentage release of CUR was computed as reported previously [14, 19] and presented as the mean ± standard deviation (SD). The cumulative release curve was plotted based on these measurements for graphical representation.
ROS-responsive morphological changesThe ROS-responsive process was determined by observing the morphological changes of HA@CUR NPs under different conditions using TEM.
Cytotoxicity studiesRAW 264.7 cells were seeded at a density of 2,000 cells per well in a 96-well plate, to which 100 µL of Dulbecco’s Modified Eagle’s Medium (DMEM) complete culture medium was added. The plate was then incubated overnight at 37 °C with 5% CO2. After 12 h, the medium was replaced with 100 µL of medium containing different concentrations of HA@CUR NPs or CUR, and incubated for 24 h in a 37 ℃, 5% CO2 incubator. Subsequently, the original culture medium was discarded and the cells were rinsed thrice with Phosphate-Buffered Saline (PBS), then 100 µL of fresh serum-free medium along with 10 µL of Cell Counting Kit-8 (CCK8) solution were added to each well. The plate was incubated for an additional 3 h at 37 °C in 5% CO2. Finally, the absorbance was measured at 450 nm with a multifunctional enzyme marker.
$$\eqalign}\,}\,\left( } \right)\,}\, & \cr & \,}\,}\,}\,}\,} \cr & }\,}\,}\,}\, \times \,100\% \cr}$$
Here, OD_experiment represents the optical density values post-treatment with either different concentrations of HA@CUR NPs or CUR. OD_blank denotes the optical density of wells containing only the CCK8 reagent without cells, serving as the blank control. OD_control refers to the optical density of untreated cell wells with no added therapeutic agents.
Hemolysis assay of nanoparticlesBlood was collected from the hearts of SD rats and stored in vacuum blood collection tubes at 4 °C. Fresh blood was diluted with 0.9% NaCl solution at a volume ratio of 4:5, followed by a water bath at 37 °C for 30 min. HA@CUR NPs and CUR (each group was set at 1.25, 2.5, 5, 10 and 20 µg/mL) were mixed with diluted blood (at a ratio of 1 ml:20 µL) and incubated in a 37 °C water bath for 1 h. After incubation, the mixture was centrifuged at room temperature at 3000 rpm for 10 min, and then photographs were taken to record the result. The supernatant was collected and transferred to a 96-well plate to measure the optical density (OD) at 545 nm. Normal saline (0.9% NaCl) and deionized water served as negative and positive controls, respectively, for calculating the hemolysis percentage.
The hemolysis rate (%) was calculated as follows:
$$\eqalign}\,}\,\left( } \right)\,}\, & \cr & \left( }} \right)} \cr & }\,\left( }} \right)\,}\,} \cr}$$
If the hemolysis rate exceeded 5%, the material was deemed to exhibit hemolytic effects.
In vitro cell affinity assayAccording previous report [20], RAW 264.7, HGFs, and Caco2 cells were inoculated in 6-well plates at a density of 1 × 10⁵ cells per well. After 12 h of incubation, cells were collected and stained with PE-labelled anti-CD44 (103,007, Biolegend), and the expression of CD44 receptor in the three cells was detected using flow cytometry. The cells were then cultured at a density of 1 × 10⁵ cells per well in 6-well plates for HA targeting evaluation. 10 µg HA-Cy5.5 NPs, 10 µg HA-Cy5.5 NPs + 20 µg HA, 10 µg HA-Cy5.5 NPs + 5 µL CD44 antibody were added to the six-well plates, respectively, and incubated for 2 h. Cells were washed three times and collected for flow cytometry analysis. For comparison, non-activated RAW 264.7 cells were used as a control, and then 10 µg HA-Cy5.5 NPs, 10 µg HA-Cy5.5 NPs + 20 µg HA, 10 HA-Cy5.5 NPs + 5 µL CD44 antibody were added to 6-well plates, incubated for 2 h, and then the cells were washed three times and collected for FCM analysis.
In vitro cellular uptakeThe uptake of HA-Cy5.5 NPs (prepared as described previously) was observed by fluorescence microscopy to verify the targeting of HA. RAW 264.7 cells were inoculated in 6-well plates at a density of 104 cells/well, and 2 mL of DMEM complete medium was added to each well and incubated overnight at 37 ℃ in a 5% CO2 incubator. After 12 h, the original medium was aspirated, 10 µg HA-Cy5.5 NPs, 10 µg HA-Cy5.5 NPs + 20 µg HA, 10 µg HA-Cy5.5 NPs + 5 µL CD44 antibody were added to each well of the medium, incubated for 2 h, then the dishes were removed, washed with PBS for 3 times, and 100 µL of Hoechst was added, and the nuclei were static stained for 10 min at room temperature, and cell uptake was observed under a fluorescence microscope to observe the uptake of cells.
Investigation of nanoparticle antibacterial activityDetermination of minimum inhibitory concentration (MIC)The antibacterial activity of NPs against P.g. was assessed using the broth microdilution method [21]. Bacterial suspensions were diluted to a concentration of 106 CFU/mL. Each well of a 96-well plate received 100 µL of the bacterial suspension. The positive control wells contained only bacterial suspension, while the negative control wells contained only the medium. Solutions of CUR and HA@CUR NPs at various concentrations were prepared, sterilized by filtration, and added to the 96-well plate, followed by incubation in a 37 °C anaerobic chamber. After 24 h, the optical density at 600 nm (OD 600) was measured for each well. The antibacterial rate was calculated for different concentrations of CUR and HA@CUR NPs, with the lowest drug concentration achieving a 90% inhibition rate considered the MIC.
Antibacterial plate spreading experimentAn appropriate volume of bacterial suspension was taken from each well described above, diluted, and 50 µL of the suspension was inoculated onto blood agar plates. After incubation at 37 °C for 72 h, each group of blood plates was photographed to observe the growth and number of bacterial colonies.
Bacterial live/dead stainingInitially, glass coverslips measuring 10 mm were sterilized and placed into 48-well plates. Subsequently, 300 µL of P.g. suspension (approximately 106 CFU/mL) was added, followed by incubation at 37 °C in an anaerobic chamber for 24 h to allow biofilm formation. Post incubation, solutions of CUR and HA@CUR NPs at different concentrations were applied, and the culture was further incubated for 12 h. The bacteria were then washed 3 times with PBS. For staining, 100–200 µL of live bacteria stain (N01 solution) and dead bacteria stain (PI solution) were used to incubate the bacteria for 15 min at room temperature in the dark. After staining, the bacteria were washed 3 times with PBS. The coverslips were then placed on microscope slides, and fluorescence microscopy was used for examination and photography.
Observation of bacterial surface morphologyA volume of 500 µL containing a 1 × 10⁶ CFU/mL P.g. suspension was added to each well of a 24-well plate. The plates were incubated at 37 °C in an anaerobic chamber for 24 h; subsequently, different concentrations of CUR and HA@CUR NPs solutions were added, and the incubation continued for another 12 h. Afterwards, the bacteria were washed 3 times with PBS and then fixed using 2.5% glutaraldehyde solution at 4 °C overnight. Subsequently, after gradient alcohol dehydration treatment, the bacteria were resuspended with tert-butanol, 10 µL of bacterial solution was taken on a drop of conductive gel, dried and sprayed with gold, and the bacterial morphology was observed using scanning electron microscope (SEM).
Study on the regulation of macrophage phenotypeFCM was utilized to analyze the expression of the surface markers for M1 (CD86) and M2 (CD206) phenotypes. RAW 264.7 cells were seeded in 6-well plates at a density of 105 cells per well and cultured overnight at 37 °C with 5% CO2. The cells were pre-treated with either HA@CUR NPs or CUR solution, both containing an equivalent amount of CUR (10 µg/mL). Cells were treated with 1 µg/mL LPS for 12 h. Subsequently, cells were washed thrice with PBS, centrifuged, and the supernatant discarded. Each tube received 1 mL of PBS containing 0.5% FBS (for FACS) for resuspension, followed by another centrifugation and supernatant removal. Cells were resuspended in 100 µL of FACS buffer and incubated at 4 °C for 5 minutes. Antibodies were added to the above solution, 5 µL CD86 and 5 µL F4/80 for M1 group and 5 µL F4/80 for M2 group, mixed well, protected from light, and incubated on ice for 20–30 min, during which it was blown 2–3 times. After centrifugation, the M1 group samples each received 2% paraformaldehyde (PFA) for fixation at room temperature for 20 min, followed by centrifugation and re-suspension in 300 µL FACS buffer. The M2 group underwent identical procedures as the M1 group, with an additional inclusion of 5 µL CD206 antibody, mixed thoroughly. Suspensions were filtered through a grid (40 μm pore size) and detected using a flow cytometer. The data obtained were used to complete the analysis of the results using CytExpert software (V 2.3).
Effects on the expression of inflammatory factors in RAW264.7 macrophagesStudy of RNA expression levelsRAW 264.7 cells were seeded at a density of 2 × 10⁵ cells per well in 6-well culture plates and incubated overnight at 37 °C with 5% CO2. After 12 h, the experimental groups received CUR solution or HA@CUR NPs solution. 5 hours later, LPS was added to the culture medium to a final concentration of 1 µg/mL. 4 h post-LPS treatment, the original culture medium was removed, and the cells were washed 3 times with PBS, followed by RNA extraction. The expression levels of TNF-α, IL-6, IL-1β, Mmp8, COX-2, Arg-1 and iNOS were detected by qPCR. The primer sequences are shown in Table S1.
Study of protein expression levelsWestern Blot: RAW 264.7 cells were plated at a density of 2 × 10⁵ cells per well on 6-well culture plates and cultured overnight at 37 °C in a 5% CO2 incubator. After 12 h, the experimental groups were treated with either CUR or HA@CUR NPs solution. 5 hours later, LPS was added to achieve a final concentration of 1 µg/mL. After 24 h of LPS addition, the original culture medium was removed and the cells were lysed by adding 1X RIPA buffer and protein inhibitor mixture after 3 washes with PBS. Cellular proteins were quantified using a BCA protein assay kit. Cellular proteins were quantified using the BCA protein assay kit, then the supernatant containing 20 µg of protein was subjected to electrophoresis, and the proteins were transferred to a PVDF membrane, which was closed in using 5% skimmed milk powder or BSA and incubated with primary and secondary antibodies. The protein bands were visualized using an ECL chemiluminescence detection kit and ChemiDoc™ XRS + imaging system, with quantitative analysis of protein bands performed using Image J software (National Institutes of Health, Bethesda, MD, USA).
Antioxidant assaysDPPH radical scavenging activity measurementDifferent concentrations of CUR or HA@CUR NPs solutions were prepared first, and then DPPH radical reserve solution with a concentration of 1 mM was prepared with anhydrous ethanol and stored away from light. To 3.0 mL of ethanol solution of DPPH at a concentration of 0.1 mM was added 3.0 mL of different concentrations of CUR or HA@CUR NPS solution, shaken well and then immediately placed away from light for 1 h. Absorbance at 517 nm was measured by UV spectrophotometer. Each sample was repeated 3 times.
$$\eqalign}\,}\,}\,}\,\left( } \right)\,}\, & \cr & \left[ }} \right)}} \right]\,}\,} \cr}$$
Where: A0 is the optical density (OD) of the DPPH solution with anhydrous ethanol and A1 is the OD of the DPPH solution with the addition of the sample solution.
ABTS radical scavenging activity measurement10 mL of 2 mM ABTS solution and 10 mL of 2.45 mM potassium persulfate was mixed homogeneously and kept away from light for 12–16 h as a stock solution. The ABTS radical stock solution was diluted with anhydrous ethanol before the reaction to give an absorbance of 0.700 ± 0.02. 1 mL of CUR or HA@CUR NPs solution at different concentrations was added to 4.5 mL of ABTS radical solution, shaken well, and then immediately placed away from light for 10 min. The absorbance at 734 nm was measured by UV spectrophotometer. Each sample was repeated 3 times.
$$\eqalign}\,}\,}\,}\,\left( } \right)\,} & \cr & \left[ }} \right)}} \right]\,}\,} \cr}$$
Where: A0 is the absorbance value of the ABTS solution with anhydrous ethanol and A1 is the absorbance value of the ABTS solution with the addition of the sample solution.
Ferric reducing antioxidant power (FRAP) AssayThe samples were diluted into different concentration gradients with distilled water. 1 mL of the sample was taken and added with 2.5 mL of PBS buffer solution (pH 6.6) as well as 2.5 mL of 1% potassium ferricyanide, and incubated at 50 ℃ for 30 min, and cooled in an ice bath immediately after the end of the incubation. Subsequently, 2.5 mL of 10% trichloroacetic acid was added, mixed well and centrifuged. Then 2.5 mL of supernatant was taken, and 2.5 mL of distilled water and 0.5 mL of 0.1% FeCl3 solution were added, and the reaction was carried out at 25 ℃ for 10 min, then the OD value at 700 nm was measured, and the higher the OD value was, the stronger the reducing ability and the better the antioxidant effect was.
Antioxidant stress studiesRAW 264.7 cells were seeded in a 96-well plate at a density of 2000 cells/well, with 100 µL of DMEM complete culture medium added to each well, and incubated overnight at 37 °C with 5% CO2. The original medium was aspirated, and medium containing various concentrations of H2O2 was added to the wells with six replicate wells per group, followed by a further incubation for 24 h. After 24 h, the original culture medium was aspirated, washed 3 times with PBS, 100 µL of serum-free medium and 10 µL of CCK8 solution were added, and the cells were incubated at 37 ℃ in a 5% CO2 incubator for 3 h. Finally, the absorbance at 450 nm was measured by a multifunctional enzyme marker, and the cell survival rate was calculated.
RAW 264.7 cells were plated at a density of 2000 cells/well in a 96-well plate and incubated overnight at 37 °C with 5% CO2. After 12 h, the original medium was discarded, and the experimental groups were treated with a culture medium containing 10 µg/mL of either CUR or HA@CUR NPs for an additional 5 h. Both control and experimental groups were then challenged with H2O2 (final concentration: 1600 µM) for 24 h under the same incubation conditions. The original culture medium was removed, cells were washed 3 times with PBS, and each well received 100 µL of serum-free culture medium plus 10 µL of CCK8 solution. After incubating for another 3 h at 37 °C, absorbance at 450 nm was measured using a multifunctional enzyme marker to calculate the survival rate of each group of cells.
Effects on antioxidant gene expression of HO-1, CAT, and SODRAW 264.7 cells were seeded at a density of 2 × 10⁵ cells/well in a 6-well plate and incubated overnight at 37 °C with 5% CO2. After 12 h, the experimental groups were treated with solutions of CUR or HA@CUR NPs, followed by the addition of H2O2 to a final concentration of 800 µM in the culture medium after 5 hours. 4 h post-H2O2 treatment, the original medium was removed, the cells were washed 3 times with PBS solution, and then RNA was extracted. The expression levels of the HO-1, SOD, and CAT genes were detected by quantitative PCR (qPCR). Primer sequences are listed in Table S1.
Intracellular ROS scavenging activityRAW 264.7 cells were plated at a density of 2 × 10⁴ cells/well into laser confocal dishes and cultured overnight at 37 °C with 5% CO2. The original medium was removed, and experimental groups were treated with media containing either CUR or HA@CUR NPs, while the blank and control groups received media with PBS, continuing incubation for 12 h. The control and experimental groups were then challenged with an equal volume of H2O2 to induce cellular stress, achieving a final H2O2 concentration of 800 µM, and incubated for 2 h. Following this, the original medium was replaced with serum-free medium containing DCFH-DA and incubated in the dark at 37 °C for 0.5 h. After washing 3 times with PBS, cells were observed and photographed under a laser-scanning confocal microscope.
To further investigate the intracellular ROS scavenging activity, FCM was employed. RAW 264.7 cells were seeded at a density of 2 × 10⁴ cells/well in a 6-well plate and treated using the same protocol as mentioned above. Cells were then collected, washed and centrifuged, and finally resuspended in PBS liquid containing 2% FBS. The suspension was filtered through a grid (40 μm) and DCFH-DA fluorescence was detected by FCM.
Establishment of a chronic periodontitis model in vivoAll animal procedures were conducted in accordance with the guidelines set by the Animal Care and Use Committee of Chongqing Medical University. To establish a chronic periodontitis model, 6-week-old male Sprague-Dawley rats weighing 200–250 g were fasted for 12 h and then anesthetized with enflurane gas. Chronic periodontitis was induced by ligating the maxillary first molar with a 0.2 mm diameter stainless steel wire, which was inserted into the gingival sulcus. After 4 weeks, the ligature was removed, and the rats were treated with CUR or HA@CUR NPs for an additional 4 weeks. Drug administration was carried out every other day by subgingival injection at six sites around each tooth, with 10 µL injected per siteRats without any treatment were blank group and ligation treated rats were control group. Both blank and control groups were injected with equal amount of PBS solution. rats were executed after 4 weeks and tissues were collected for analysis.
Animal imaging analysisAfter 4 weeks of treatment, ROS levels were detected by local in situ injection of the DCFH-DA probe. Fluorescence imaging was performed on a small animal imaging system (n = 3) to measure and quantify fluorescence signal intensity. In addition, local in situ injections of HA-Cy5.5 NPs and free Cy5.5 were performed using fluorescence imaging on an animal imaging system (n = 3), and fluorescence signal intensities were measured and quantified to detect the retention of nanoparticles over time in animals.
Micro-CT analysisAll harvested maxillary bone samples were fixed overnight in 4% paraformaldehyde (PFA) and subsequently scanned using a Scanco µCT50 scanner (Scanco Medical AG, Brüttisellen, Switzerland) at a resolution of 18 μm, with a scanning voltage of 70 kV and a scanning current of 200 µA. Three-dimensional reconstructions and two-dimensional X-ray images were generated using SCANCO Visualizer software. Alveolar bone loss (ABL) was determined by measuring the distance from the cementoenamel junction (CEJ) to the alveolar bone crest (ABC). All measurements were carried out using ImageJ software. Moreover, the region of interest (ROI) for the analysis of bone-related parameters was selected between the mesial side of the first molar and the distal side of the second molar at the medial area. We constructed the ROI starting from the slice where the CEJ first appeared, extending downwards to the level where the distal root apex of the first maxillary molar first disappeared. Each sample consisted of 30 layers of ROI. The ROI percentage of bone volume (BV/TV), trabecular separation (Tb.sp), trabecular number (Tb.N), and trabecular thickness (Tb.Th) within the affected bone tissue were recorded using SCANCO Evaluation software. Furthermore, major organs including the heart, liver, spleen, lung, and kidney were stained with hematoxylin and eosin (H&E) for toxicity analysis. The sections were scanned and photographed using a microscope.
RT-PCR of rat periodontal tissuesThe rat periodontal tissue was homogenized and centrifuged using Trizol reagent. The supernatant was removed, chloroform and trizol was added, incubated for 5 min at room temperature and centrifuged at 12,000 rpm. The topmost layer was taken and mixed with isopropanol trizol and 75% ethanol. The mixture was vortexed, centrifuged, supernatant removed and air dried to obtain an RNA pellet. RNA was eluted with 20 µL RNase-free water. Finally, the concentration of RNA was determined by Nano drops Thermo scientific 2000 spectrometer. The RNA was then converted to cDNA by reverse transcription, and the expression of rat genes was detected by real-time fluorescence quantitative polymerase chain reaction (qRT-PCR).
Isolation of bacterial RNA by differential lysis:
(i)Sample preparation: Periodontal tissues from each group of rats were excised and immediately placed in Petri dishes containing 2 mL Tris EDTA (TE) buffer (10 mM Tris-HCl, 1 mM EDTA). Periodontal tissue was cut into smaller pieces, transferred to EP tubes, and broken up with a tissue eruptor (Qiagen). 4 mL of TE buffer was added and the tissue homogenates were digested with 1 ml of 20 mg/mL proteinase K solution (Qiagen) at 55 ℃ for 10 min (without shaking). Another 6 mL of TE buffer was added and the samples were centrifuged at 3200 g for 15 min at 4 ℃. Microspheres containing bacterial cells were resuspended with 300 µL of Tri-reagent reagent (Zymo Research) containing 1% β-mercaptoethanol and 300 µL of RLT buffer (Qiagen).
(ii)RNA extraction and purification: samples were transferred into bead tubes (0.1 mm glass beads, MoBio) and shaken using a TissueLyser (Qiagen) at 30 Hz for 5 min at 4 ℃. Samples were immediately placed on ice and centrifuged at 10,000 g for 5 min at 4 ℃ to remove cellular debris. The supernatant was transferred to a clean tube containing 1 volume of 100% ethanol and mixed by repeated gentle inversion.
The primer sequences are shown in Table S2 and Table S3.
Histological and Immunohistochemical AnalysisMaxillary bone tissue sections were decalcified in a 10% solution of ethylenediaminetetraacetic acid (EDTA) for two months, with a change of decalcification fluid every two days. Subsequently, samples were dehydrated and embedded in paraffin. Sections were cut to a thickness of 5 μm in a mesiodistal orientation using a microtome. Sections were stained with H&E, tartrate-resistant acid phosphatase (TRAP), and immunohistochemically for inflammatory cytokines (IL-6, IL-1β, and TNF-α), as well as antioxidants (HO-1, SOD, and CAT) to observe anti-inflammatory, antioxidant, and osteoclastogenesis inhibitory effects among the different treatment groups.
Statistical analysisStatistical differences between groups were determined using independent two-sample t-tests or one-way analysis of variance (ANOVA). Data are presented as mean ± SD. Statistical significance was defined as p* < 0.05, p** < 0.01, p*** < 0.001.
留言 (0)