
記住我


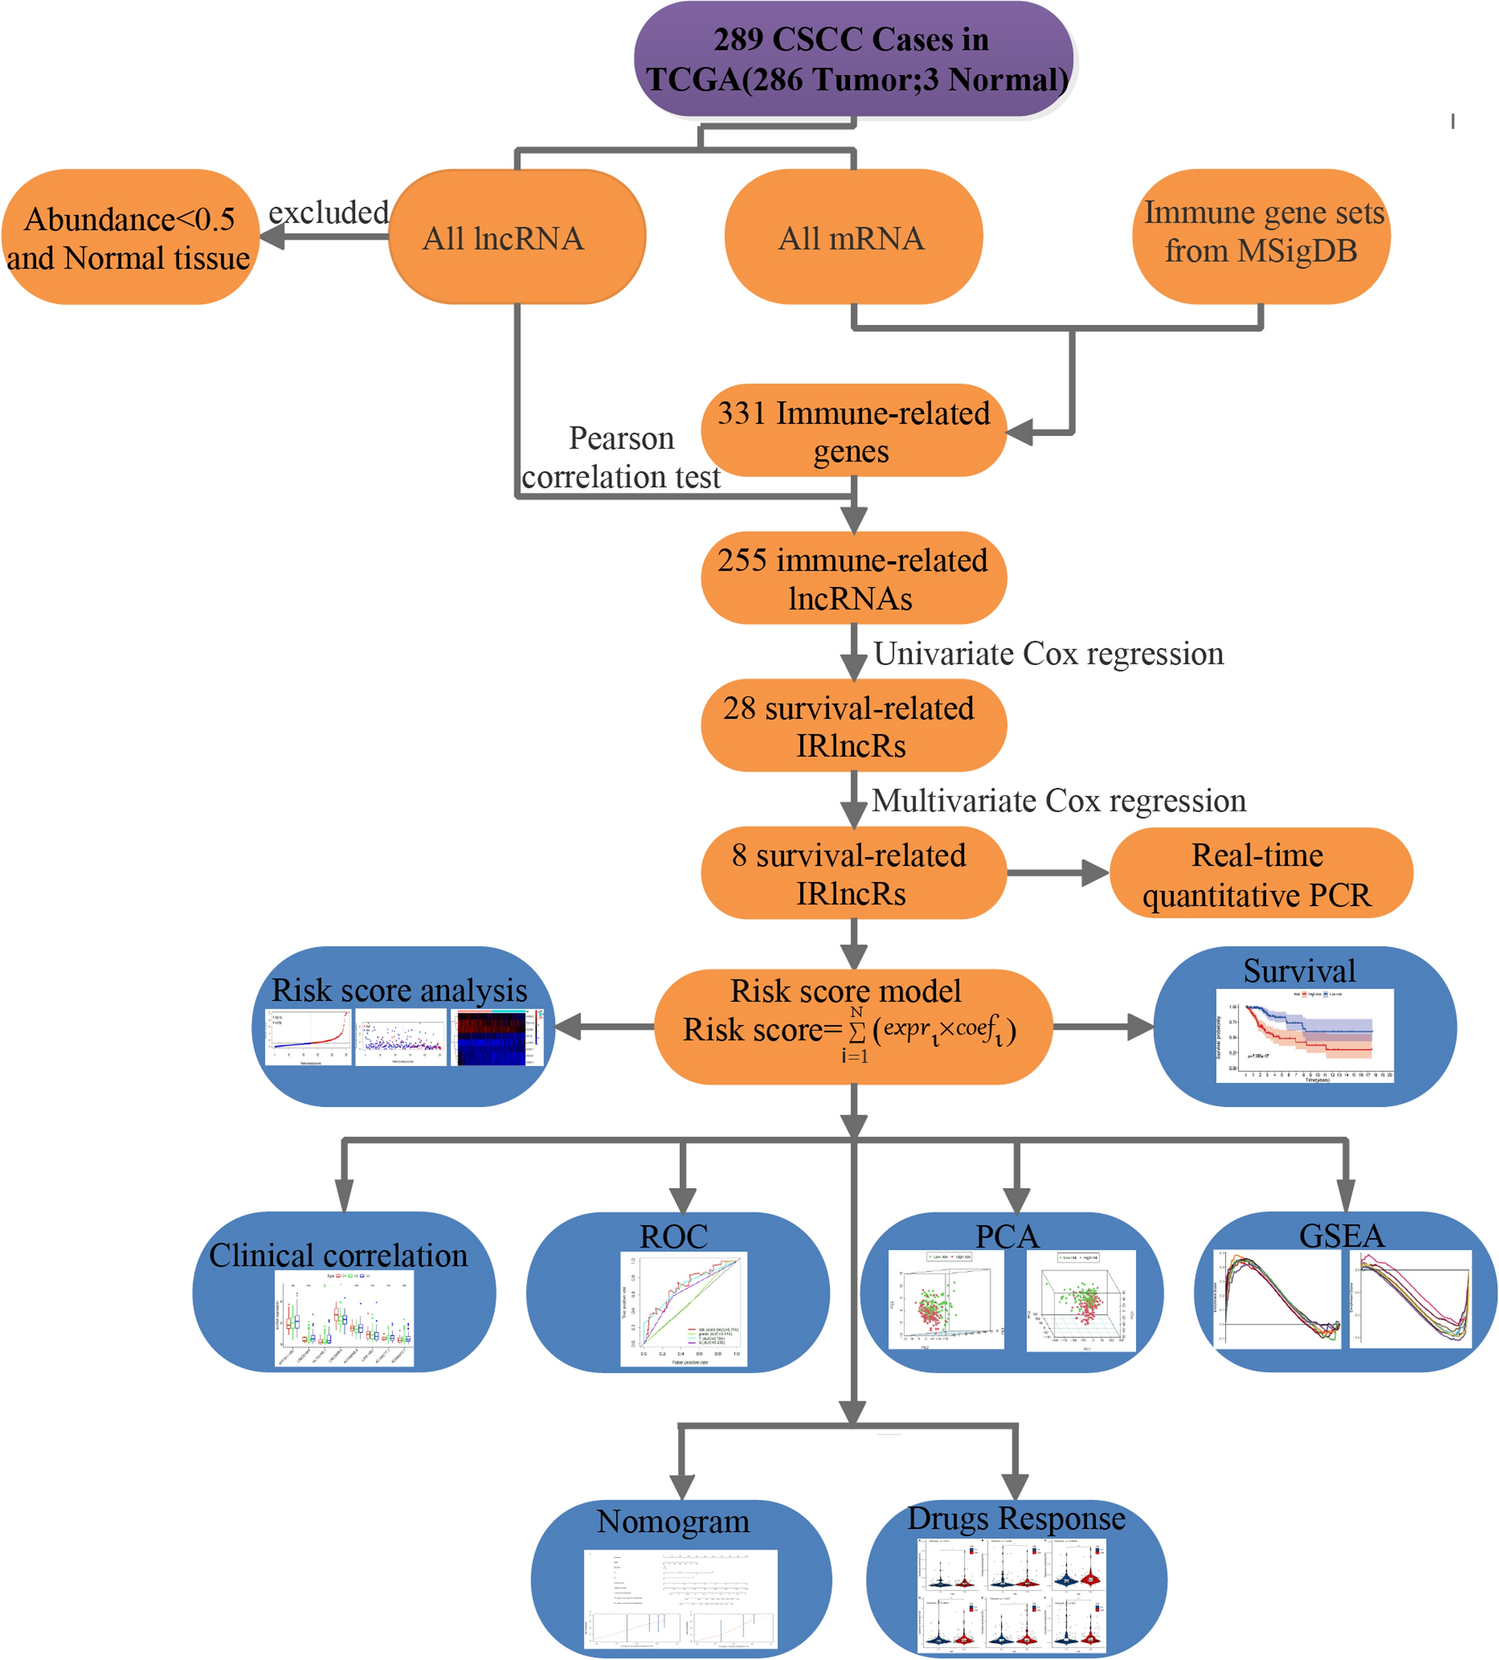
Figure 1 displays the analysis process of our study. We downloaded transcriptome RNA-seq data and corresponding clinical data of 289 cases of CC from the TCGA database. Among these cases, there were 253 CSCC patients, 33 cervical adenocarcinoma patients, and 3 healthy control patients (Additional file 3: Table S1). Then, the RNA-seq data were divided into mRNA and lncRNAs data. LncRNAs with an abundance less than 0.5 and normal tissue lncRNAs were excluded. We identified 331 immune-related genes from gene sets of MSigDB, of which 255 lncRNAs were IRlncRs validated by correlation analysis (Additional file 1: Fig. S1). Next, we identified 28 IRlncRs that were associated with the prognosis of CC. We further optimized theses IRlncRs by stepwise multivariate Cox regression, and eight sIRlncRs were utlized to formulate the risk score model. Finally, we utilized the risk score model for a series of subsequent analyses, including survival analysis, risk score analysis, clinicopathological characteristics, ROC curve analysis, PCA, and GSEA.
Fig. 1
Analysis of the workflow of this study
3.2 Construction of an IRlncRs-based risk score modelOf the 28 IRlncRs related to the prognosis of CC (p < 0.01), 25 were low-risk factors, and 3 were high-risk factors (Additional file 3: Table S2). Eight sIRlncRs were finally incorporated to formulate the risk score model, including ATP2A1-AS1, LINC01943, AL158166.1, LINC00963, AC009065.8, LIPE-AS1, AC105277.1, AC098613.1 (Table 2). All CC samples were categorized into low-and the high-risk groups using the median risk score as a boundary (Fig. 2A). The vital status of each patient was plotted. The proportion of death events in different risk groups was also analyzed. The mortality rate increased faster in the high-risk group than in the low-risk group (Fig. 2B). The differentially expressed genes (DEGs) displayed that the expression levels of AL158166.1 and AC105277.1 had a positive coefficient and acted as risk factors. The other six sIRlncRs showed negative coefficients, including ATP2A1-AS1, LINC01943, LINC00963, AC009065.8, LIPE-AS1, AC098613.1, and served as protective factors (Fig. 2C).
Table 2 Eight immune-related lncRNAs identified from multivariate Cox regression analysisFig. 2
Construction of an IRlncRs-based risk score model. A The eight IRlncRs-based risk score distribution; B The eight-IRlncRs-based risk score distribution for CC patient survival status. C Heatmap of the eight-IRlncRs expression profiles in the high-risk and low-risk subgroups; D Relative expression of the 8 IRlncRs
To verify the clinical value of the selected sIRlncRs in predicting prognosis, we compared the expression levels of the eight sIRlncRs in cervical cancer cells to that in normal human cervical epithelial cells. As illustrated in Fig. 2D, five of the six sIRlncRs serving as protective factors showed a significant decrease in the cervical cancer cells. One of the two IRlncRs acting as risk factors showed a significant increase in the cervical cancer cells.
Moreover, Kaplan–Meier survival analysis was used to evaluate the above prognosis model's impact on CC patients’ survival. Survival was inferior in the high-risk group than in the low-risk group (Fig. 3).
Fig. 3
Survival curve of CC patients. Kaplan–Meier survival curve of OS among CC patients from the low-risk groups and high-risk groups. The high-risk group show the poorer prognosis
3.3 Independent prognostic analysisTo explore the relationship between the selected IRlncRs and clinical features of CC, the potential association of the eight IRlncRs with the clinicopathological features, including T-stage, N-stage, and tumor grading, was investigated. The results presented that the expression level of LINC00963 negatively correlated with the grading, while AL158166.1 was positively related to advanced grading (Fig. 4A). The expression of LINC00963 and AC105277.1 decreased with progressive T-stages (Fig. 4B), and the expression of LIPE−AS1 increased with the progression of the N-stage (Fig. 4C). We then performed independent risk analysis, and it showed the risk score model, N-stage, and T-stage were negatively related to the OS in univariate analysis (p < 0.05) (Fig. 5A). The results were further confirmed in the multivariate analysis showing that the risk score model, N-stage, and T-stage were significantly associated with OS (p < 0.05) (Fig. 5B). The ROC (Receiver Operating Characteristic) curve analysis validated this finding, demonstrating the predictive accuracy of the model. The AUC values for grade, T-stage, N-stage and risk score model were 0.516, 0.704, 0.633, and 0.710, respectively (Fig. 6). These results demonstrated the risk score model as an independently reliable prognostic factor.
Fig. 4
The relationships between the sIRlncRs and clinical features. A grading; B T-stage; C N-stage
Fig. 5
Cox regression. A Univariate Cox regression showed that the T stage, N stage, and risk score model were correlated with the prognosis of CC patients. B Multivariate Cox regression showed that the T stage, N stage, and risk score model were an independent risk factor for CC patients
Fig. 6
Receiver operating characteristic (ROC) curve. ROC curves demonstrated the prognostic value of the independent prognostic factors
3.4 Construction of the nomogramThe factors of age, grade, T-stage, N-stage and risk score were further combined to construct a compound nomogram for predicting the OS of patients with CC at 3- and 5-year (Fig. 7A). The points for the factors indicated their corresponding contribution to the survival probability. The total points of each patient provided the estimated 3- and 5-year OS. The C-index of our nomogram was 0.763(95% CI 0.746–0.780, p < 0.05). The actual recurrence rate and nomogram-predicted survival rate matched well at 3 years (Fig. 7B) and 5 years (Fig. 7C), as shown by the calibration curves (Fig. 7B, C).
Fig. 7
The Nomogram for predicting overall survival of CC patients. A The Nomogram integrating the signature risk score with the clinical characteristics for predicting OS. B The calibration curve for the Nomogram in TCGA cohort for predicting 3-year overall survival. C The calibration curve for the Nomogram in TCGA cohort for predicting 5-year overall survival
3.5 The immune status of the low and high‑risk groupsWe performed PCA to explore the dispersion of the low-and high-risk groups based on genome-wide expression sets and the immune gene sets. Considering the immune gene sets, the low-and high-risk groups showed clustering (Fig. 8A), although there was no significant separation of the two groups based on the genome-wide expression profiles (Fig. 8B). The GSEA further verified the differences in functional annotation. As shown in Fig. 8C, D, the low-risk group's genes were predominantly mapped to the immune-related activities, such as immune response and immune system process. However, there was no gene enriched in the high-risk group (p > 0.05).
Fig. 8
Principal components analysis (PCA) and gene set enrichment analysis (GSEA). A PCA plot showing high-risk group and low-risk groups based on the immune-related gene sets. B PCA plot showing high-risk group and low-risk group based on the whole protein-coding gene sets. C, D GSEA implied remarkable enrichment of immune-related phenotype in the low-risk group;
3.6 Analysis of chemotherapeutic responses in high- and low-risk groupsA total of 198 drugs were analyzed, and drug response to twenty commonly used chemotherapy drugs for CC were analyzed using the Wilcoxon rank-sum test. There were significantly lower IC50 levels for Paclitaxel, Rapamycin, Epirubicin, Vincristine, Docetaxel, and Vinorelbine in the low-risk group compared with the high-risk group (Fig. 9, p < 0.05), indicating that the low-risk group was more sensitive to these drugs. Among the 20 drugs, only docetaxel and lapatinib showed no significant difference in IC50 values (Additional file 2: Fig. S2), which indicated that our IRlncRs-based risk model might act as a potential predictor for chemosensitivity.
Fig. 9
Differential chemotherapeutic responses of 6 drugs in low- and high-risk CC patients (A–F)
留言 (0)