
記住我

The characteristics of all participants, including current age, age at onset of T1DM, duration of T1DM, and recent measurement of HbA1c, are summarized in Table 1. The sample was balanced between genders.
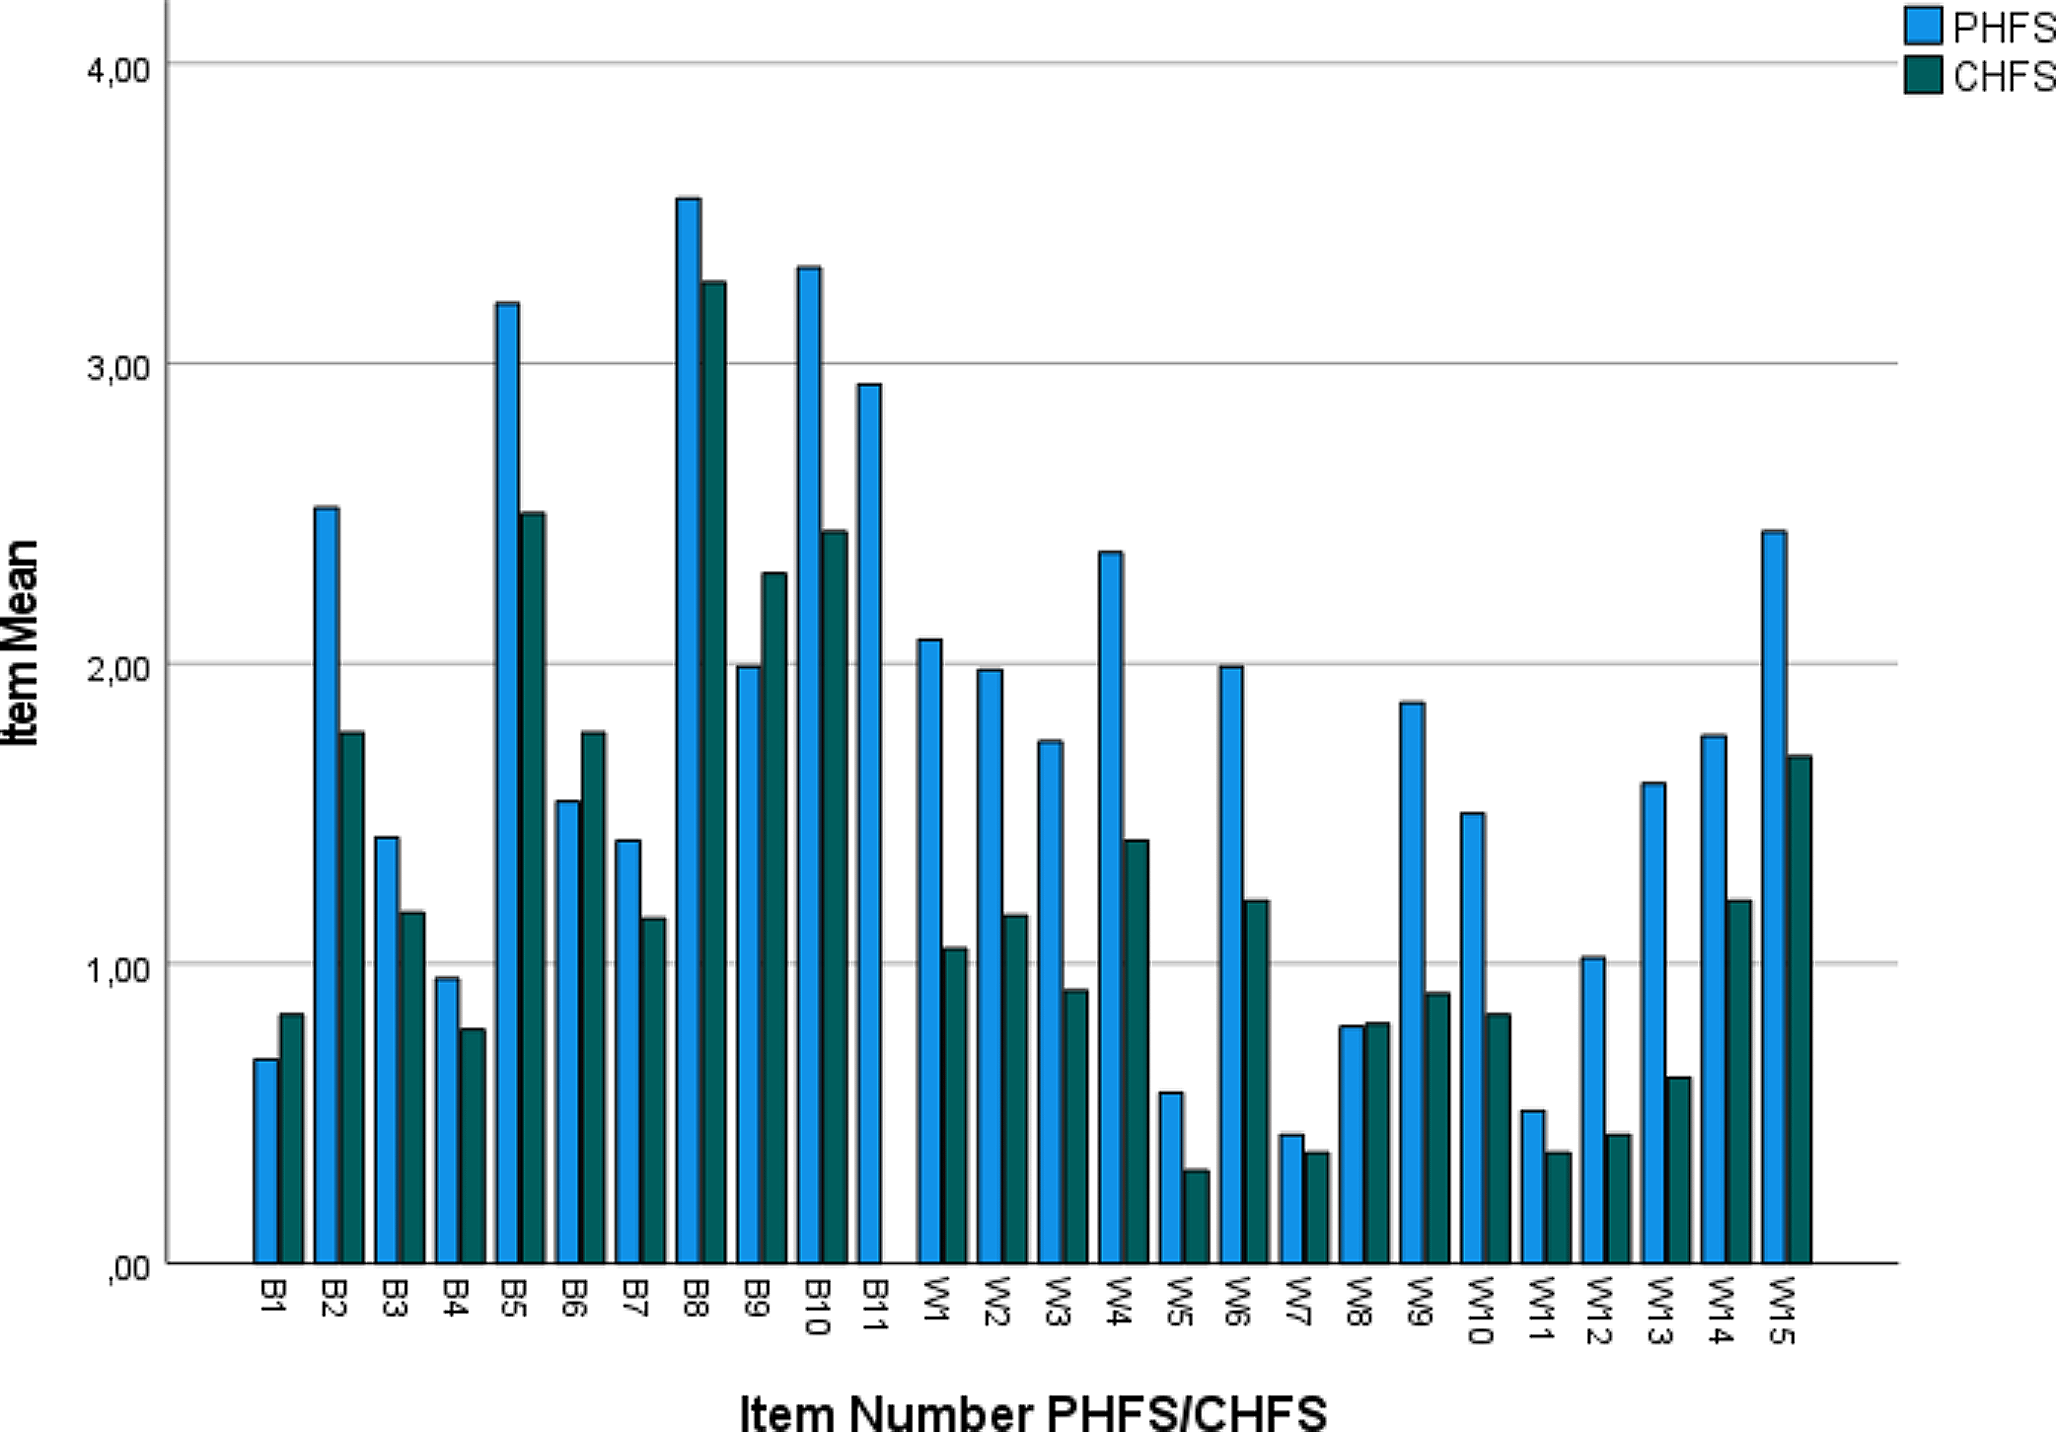
Table 1 Sample characteristics of the studied children and adolescents (N = 100): current age, age at onset of T1DM, duration of T1DM, recent HbA1cBased on their mean scores in the HFS, the parents scored higher than the children in most items (Fig. 1). B1 (I eat large bedtime snacks), B6 (I decrease my insulin dose whenever I think that my blood sugar is very low), and B9 (I restrict my activity whenever I think that I may have low blood sugar) were the only items where the children’s mean score was higher than the corresponding mean score of their parents. In totality, the mean scores for parents were significantly higher for both subscales and the Total scale (paired T-test, p < 0.0005) compared to the children’s corresponding scores (Table 2).
Table 2 Mean scores and standard deviations for HFS (Behavior, Worry and Total scales) for the studied parents and childrenFig. 1
Mean scores of different items of the P-HFS and C-HFS scales
The analysis of the current study was performed using the mean scores for all subscales or Total scales instead of the total scores. This facilitated the handling of all missing values. Eighty-four out of 100 parents responded to all items, 12 missed one item, three missed two or three items, and only one missed six items from the Behavior subscale. For the children, the missing values were fewer, i.e., 89 out of 100 responded to all 25 items, ten missed one item either from the Behavior or Worry subscale and only one missed two items from the Worry subscale.
Correlations between P-HFS/C-HFS scores and patient characteristicsHFS scores and children’s current ageNo significant correlation was observed between the P-HFS scores, both the two subscales and the Total scale, and the current age of the child (r = 0.023, p = 0.820; r=-0.075, p = 0.455; r=-0.057, p = 0.575; for Behavior, Worry, and Total scale, respectively). Similarly, there was no significant correlation between the C-HFS scores (both the two subscales and the Total scale) and the age of the child (r=-0.065, p = 0.521; r=-0.076, p = 0.451; r=-0.093, p = 0.358; for Behavior, Worry, and Total scale, respectively).
HFS scores and duration of diabetesNo significant correlation was found between the P-HFS scores, both the two subscales and the Total scale, and duration of diabetes (r = 0.01, p = 0.920; r=-0.112, p = 0.266; r=-0.089, p = 0.378; for Behavior, Worry, and Total scale, respectively). Similarly, there was no significant correlation between the C-HFS scores (both the two subscales and the Total scale) and the duration of diabetes (r=-0.153, p = 0.130; r=-0.034, p = 0.740; r=-0.110, p = 0.276; for Behavior, Worry, and Total scale, respectively).
HFS scores and recent HbA1c measurementThere was no significant correlation between the P-HFS scores (both the two subscales and the Total scale) and children’s HbA1c levels at the time of completion of the questionnaire (r = 0.149, p = 0.140; r = 0.145, p = 0.150; r = 0.181, p = 0.071; for Behavior, Worry, and Total scale, respectively). There was also no significant correlation between the C-HFS scores (both the two subscales and the Total scale) and children’s HbA1c levels at the time of completion of the questionnaire (r=-0.177, p = 0.079; r = 0.041, p = 0.687; r=-0.070, p = 0.488; for Behavior, Worry, and Total scale, respectively).
Comparisons of the HFS scores in different subgroupsHFS scores in younger versus older children (current age)The parents of younger children scored on average slightly higher than the parents of adolescents; however, this difference was not significant for any of the subscales or the Total scale (Table 3). According to the independent samples T-test, there was no significant difference between the two age groups [t(98) = 0.457, p = 0.649; t(98) = 0.711, p = 0.479; t(98) = 0.758, p = 0.450].
Table 4 Mean scores and standard deviations (in parentheses) of Behavior, Worry, and Total HFS scales for parents and children according to the frequency of severe, moderate, and mild hypoglycemic episodes. SH: severe hypoglycemic episode, MeH: moderate hypoglycemic episode, MiH: mild hypoglycemic episodeChildren’s scores were significantly lower than those of their parents, although there was no significant difference between the two age groups (Table 3). The results from the corresponding independent samples T-test were as follows: [t(68) = 1.095, p = 0.277; t(98)=-0.045, p = 0.964; t(98) = 0.506, p = 0.614].
Table 3 Mean scores and standard deviations (in parentheses) of Behavior, Worry and Total HFS scales for parents and children according to patient’s age group, mode of treatment, good (HbA1c ≤ 7.0%) versus poor (HbA1C > 7.0%) glycaemic controlHFS scores and mode of treatment (MDI versus insulin pump)All mean P-HFS scores were slightly, but not significantly, higher for parents of children treated via an insulin pump compared to those of children who are on MDI (Table 3). The results of the independent samples T-test [t(97)=-0.861, p = 0.391; t(97)=-0.158, p = 0.875; t(97)=-0.406, p = 0.686] demonstrated no significant difference between the two groups of parents.
Furthermore, the mean C-HFS scores showed no statistical difference between the two groups. Based on the independent samples T-test, no significant difference was observed for any of the subscales or for the Total scale [t(98) = 0.341, p = 0.734; t(98)=-0.824, p = 0.412; t(98)=-0.422, p = 0.674].
HFS scores and HbA1c (HbA1c < 7.0% versus HbA1c ≥ 7.0%)The average HFS scores for the parents of children with recent measurement of HbA1c > 7.0% were greater than the corresponding average scores of those of children with recent HbA1c measurement ≤ 7.0%, while this was reversed for the children (Table 3). For the parents, the mean Behavior subscale score and the mean Total scale score were both significantly higher (level of significance 0.05) for those with HbA1c > 7.0% according to a right-sided independent samples T-test [t(98)=-1.81, p = 0.037; t(98)=-1.75, p = 0.042]. For the corresponding mean Worry subscale scores, there was no significant difference between the two groups of parents [t(98)=-1.25, p = 0.108]. In contrast, for the children, the mean Behavior subscale score and the mean Total scale score were both significantly higher for those with HbA1c ≤ 7.0% according to a right-sided independent samples T-test t(98) = 2.61, p = 0.005; t(98) = 1.88, p = 0.032]. Similarly to the parents, for the mean C-HFS Worry subscale scores, there was no significant difference between the two groups [t(98) = 0.57, p = 0.284].
Effect of hypoglycemia on HFS scoresSupplementary File 1 summarizes the children’s and parents’ responses regarding the frequency of severe, moderate, and mild hypoglycemic episodes during the previous year, previous 6 months, and previous month, respectively.
The mean HFS scores of children and parents grouped according to the number of severe hypoglycemic episodes (≤ 1 versus > 1) over the previous 1 year, moderate episodes (≤ 2 versus > 2) over the previous 6 months, and mild episodes (≤ 3 versus > 3) over the previous 1 month are shown in Table 4.
With regard to severe hypoglycemic episodes and according to the independent samples T-test, there was no significant difference between the mean scores of the parents of the two groups of children [t(93) = 0.81, p = 0.935; t(93) = 0.764, p = 0.447; t(93) = 0.700, p = 0.486; for Behavior, Worry, and Total scale, respectively]. The average scores of children with more than one SH episode during the last year were consistently lower than the corresponding average scores of those with none or one SH episode. According to the independent samples T-test, however, the difference was significant only for the Behavior scale and the Total HFS scale [t(89) = 3.66, p < 0.0005; t(89) = 2.50, p = 0.014], but not for the Worry subscale [t(89) = 0.766, p = 0.446].
Similarly, regarding the moderate hypoglycemic episodes that occurred during the previous 6 months, according to the independent samples T-test, there was no significant difference between the mean HFS scores for the parents of the two groups of children for either subscale or the Total scale [t(84) = 1.278, p = 0.205; t(56)=-0.325, p = 0.747; t(57) = 0.045, p = 0.964]. In contrast, the children who had ≤ 2 MeH exhibited consistently higher average scores compared to those who had > 2 MeH. According to the independent samples T-test, there was a significant difference between the two groups of children for the Behavior subscale and the Total HFS scale [t(89) = 3.22, p = 0.002; t(89) = 2.62, p = 0.01], but not for the Worry subscale [t(89) = 1.20, p = 0.234].
Lastly, with respect to MiH during the previous 1 month, according to the independent samples T-test, there was no significant difference between the scores of any of the HFS subscales or the Total scale for the parents of the two groups of children [t(94)=-1.651, p < 0.102; t(94)=-1.816, p = 0.073; t(94)=-2.074, p = 0.041, respectively], as well as for the children [t(90)=-0.60, p < 0.549; t(90) = 0.547, p = 0.586; t(90) = 0.069, p = 0.945, respectively].
HFS scores and PedsQL™ scoresA significant positive correlation was found between the Total HFS scores and the overall PedsQL™ scores (r = 0.337, p < 0.001; r = 0.408, p < 0.001 for parents and children, respectively). Furthermore, the average PedsQL™ scores calculated for the upper tertiles of HFS for both parents and children were significantly higher than those in the lower tertiles based on right-sided t-tests [Lower: 0.84 ± 0.42, Upper: 1.20 ± 0.51; t(64)=-3.178, p = 0.001 (for parents); Lower: 0.65 ± 0.48, Upper: 1.15 ± 0.50; t(65)=-4.19, p < 0.001 (for children)].
留言 (0)