Data and Participants
This study used data from the National Health and Aging Trends Study (NHATS), which is a nationally representative survey of Medicare beneficiaries living in the United States aged 65 years and older (18). NHATS used a complex survey sampling design and oversampled for non-Hispanic Black individuals and those aged 90 and older. In 2011 (Wave 1), NHATS enrolled 8,245 participants and followed them annually to gather data on socioeconomic status, health conditions, social aspects, physical environment, and physical and cognitive functioning. Participants complete annual in-person standardized assessments with a trained interviewer in their own home. In the current analyses, we included participants with complete data for FI experience and VI at Wave 2 (2012) and frailty or falls assessments at Wave 2 and at least one subsequent wave. Participants were followed for a maximum of 8 years (2012–2019), corresponding to Waves 2–9. A total of 5,963 participants were included in the present study. NHATS is funded by the National Institute on Aging (U01AG032947) and conducted by the Johns Hopkins Bloomberg School of Public Health. The NHATS and NSOC were approved by the Johns Hopkins Bloomberg School of Public Health Institutional Review Board and all participants provided informed consent.
MeasuresFood insecurity experience and classification
Participants were asked about their FI experience due to financial, social, and functional limitations. Participants were asked about whether they had experienced 1) “going without groceries”, 2) “going without hot meals”, 3) “going without eating due to lack of ability”, 4) “going without eating because of lack of social support to do so”, and 5) “skipping meals due to financial constraints” in the last 30 days. Using methods with strong construct validity developed by Tucher et al. and detailed elsewhere (19, 20), the number of affirmative answers were summed to give an indicator of FI. Participants with a sum of 0 were considered food sufficient and those with a score of ≥1 were considered to have FI.
Vision Impairment
VI was based on self-report of any of the following: blindness, unable to see well enough to recognize someone across the street, unable to see well enough to watch the television across the room, or unable to see well enough to read newspaper print.
Exposure Group Categorization
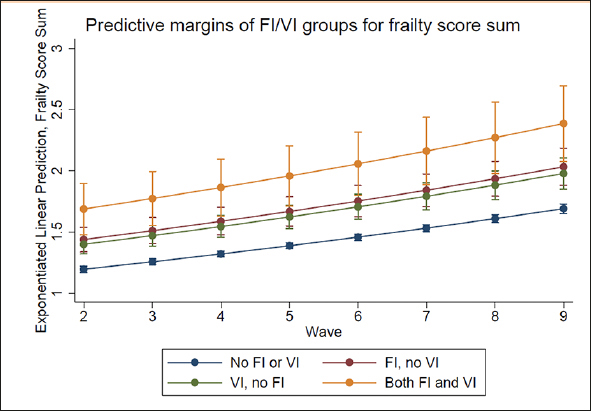
We created four groups based on the FI and VI variables: 0=no food insecurity or vision impairment (No FI or VI), 1=food insecure, no vision impairment (FI, no VI), 2=vision impairment, not food insecure (VI no FI), and 3=both food insecurity and vision impairment (Both FI and VI).
Frailty
Frailty was assessed annually with the validated Fried Frailty Index (21) using the annually collected data on slowness, weakness, weight loss, low physical activity, and exhaustion (22). Slowness was assessed with walking speed using the first of two tests of a 3m walk and categorized at or below the 20th percentile by sex and height. Weakness was assessed with grip strength, using the maximum of two tests using a handheld dynamometer and categorized at or below the 20th percentile by sex and body mass index (BMI). Weight loss was categorized as participants who reported unintentional weight loss of ≥10 pounds in the last year. Low physical activity was categorized as reporting never walking for exercise or never engaging in vigorous activities. Finally, exhaustion was categorized as self-reported low energy or ease of exhaustion that limited activities. A frailty sum score (0–5) was calculated by summing the individual items. To create a binary variable, participants with a score ≥3 were considered frail and those with a score 0–2 were considered non-frail (22).
Falls
Falls were assessed at the annual interview via self-report. Participants were asked about falling, including any fall, slip, or trip in which you lose your balance and land of the floor or ground at a lower level.” In this study, we used the variables where participants were asked if they had fallen “in the last 12 months” and, if they had fallen in the last 12 months, were asked if they had “fallen down more than one time.” Both variables were categorized as dichotomous variables for analyses.
Covariates
Baseline covariates collected at Wave 2 were included in cross-sectional and longitudinal analyses. Sociodemographic covariates included: sex (woman or man), age group (65–69, 70–74, 75–79, 89–84, 85–89, and ≥90), race/ethnicity (White, non-Hispanic Black, other), education (<high school, high school, >high school), total income (divided into quintiles), marital status (married/living with a partner or not), and BMI (kg/m2, based on self-reported height and weight). We additionally created a comorbidity count that included the following self-reported health conditions: heart attack, heart disease, stroke, cancer, osteoporosis, lung disease, and arthritis. We separately adjusted for hypertension, diabetes, and dementia. Finally, overall health assessed by asking participants about their general overall health (1=excellent, 2=very good, 3=good, 4=fair, 5=poor), and anxiety and depression symptoms, assessed with the 2-item Generalized Anxiety Disorder Scale (23) and 2-item Patient Health Questionnaire (24) were also included as covariates.
Statistical analysis
We first compared participant characteristics by the four groups defined by FI and VI status at baseline (i.e., “No FI or VI,” “FI, no VI,” “VI, no FI,” and “Both”). We used baseline FI and VI status instead of time-varying FI and VI status, because we found that it was uncommon for people to change FI/VI groups over time and groups remained largely the same across Waves. We used regression models to examine the cross-sectional association between FI and VI status and frailty and fall outcomes at Wave 2. All binary outcomes (frailty, fall in the last year, and multiple falls in the last year) were modeled with logistic regression. Frailty score sum, due to its discreet probability, right-skewed distribution, was modeled with Poisson regression and coefficients presented as incidence rate ratios (IRR). In longitudinal analyses, we again used logistic and Poisson generalized estimating equation models to examine frailty and fall outcomes. Time was modeled as a continuous variable and an interaction term between time and FI/VI group was created to examine the association over time. Postestimation allowed us to present these coefficients as odds ratios (OR) and relative risk ratios (RRR). Margins plots were created to visualize the trends over time. In both cross-sectional and longitudinal analyses, model 1 was adjusted for age and sex. In model 2, for frailty outcomes, we adjusted for age, sex, race, education, income, BMI, overall health, hypertension, diabetes, dementia, comorbidity count, and depression and anxiety symptoms. For fall outcomes, model 2 was adjusted for age, sex, race, education, income, BMI, overall health, dementia, comorbidity count, and depression and anxiety symptoms.

留言 (0)