
記住我

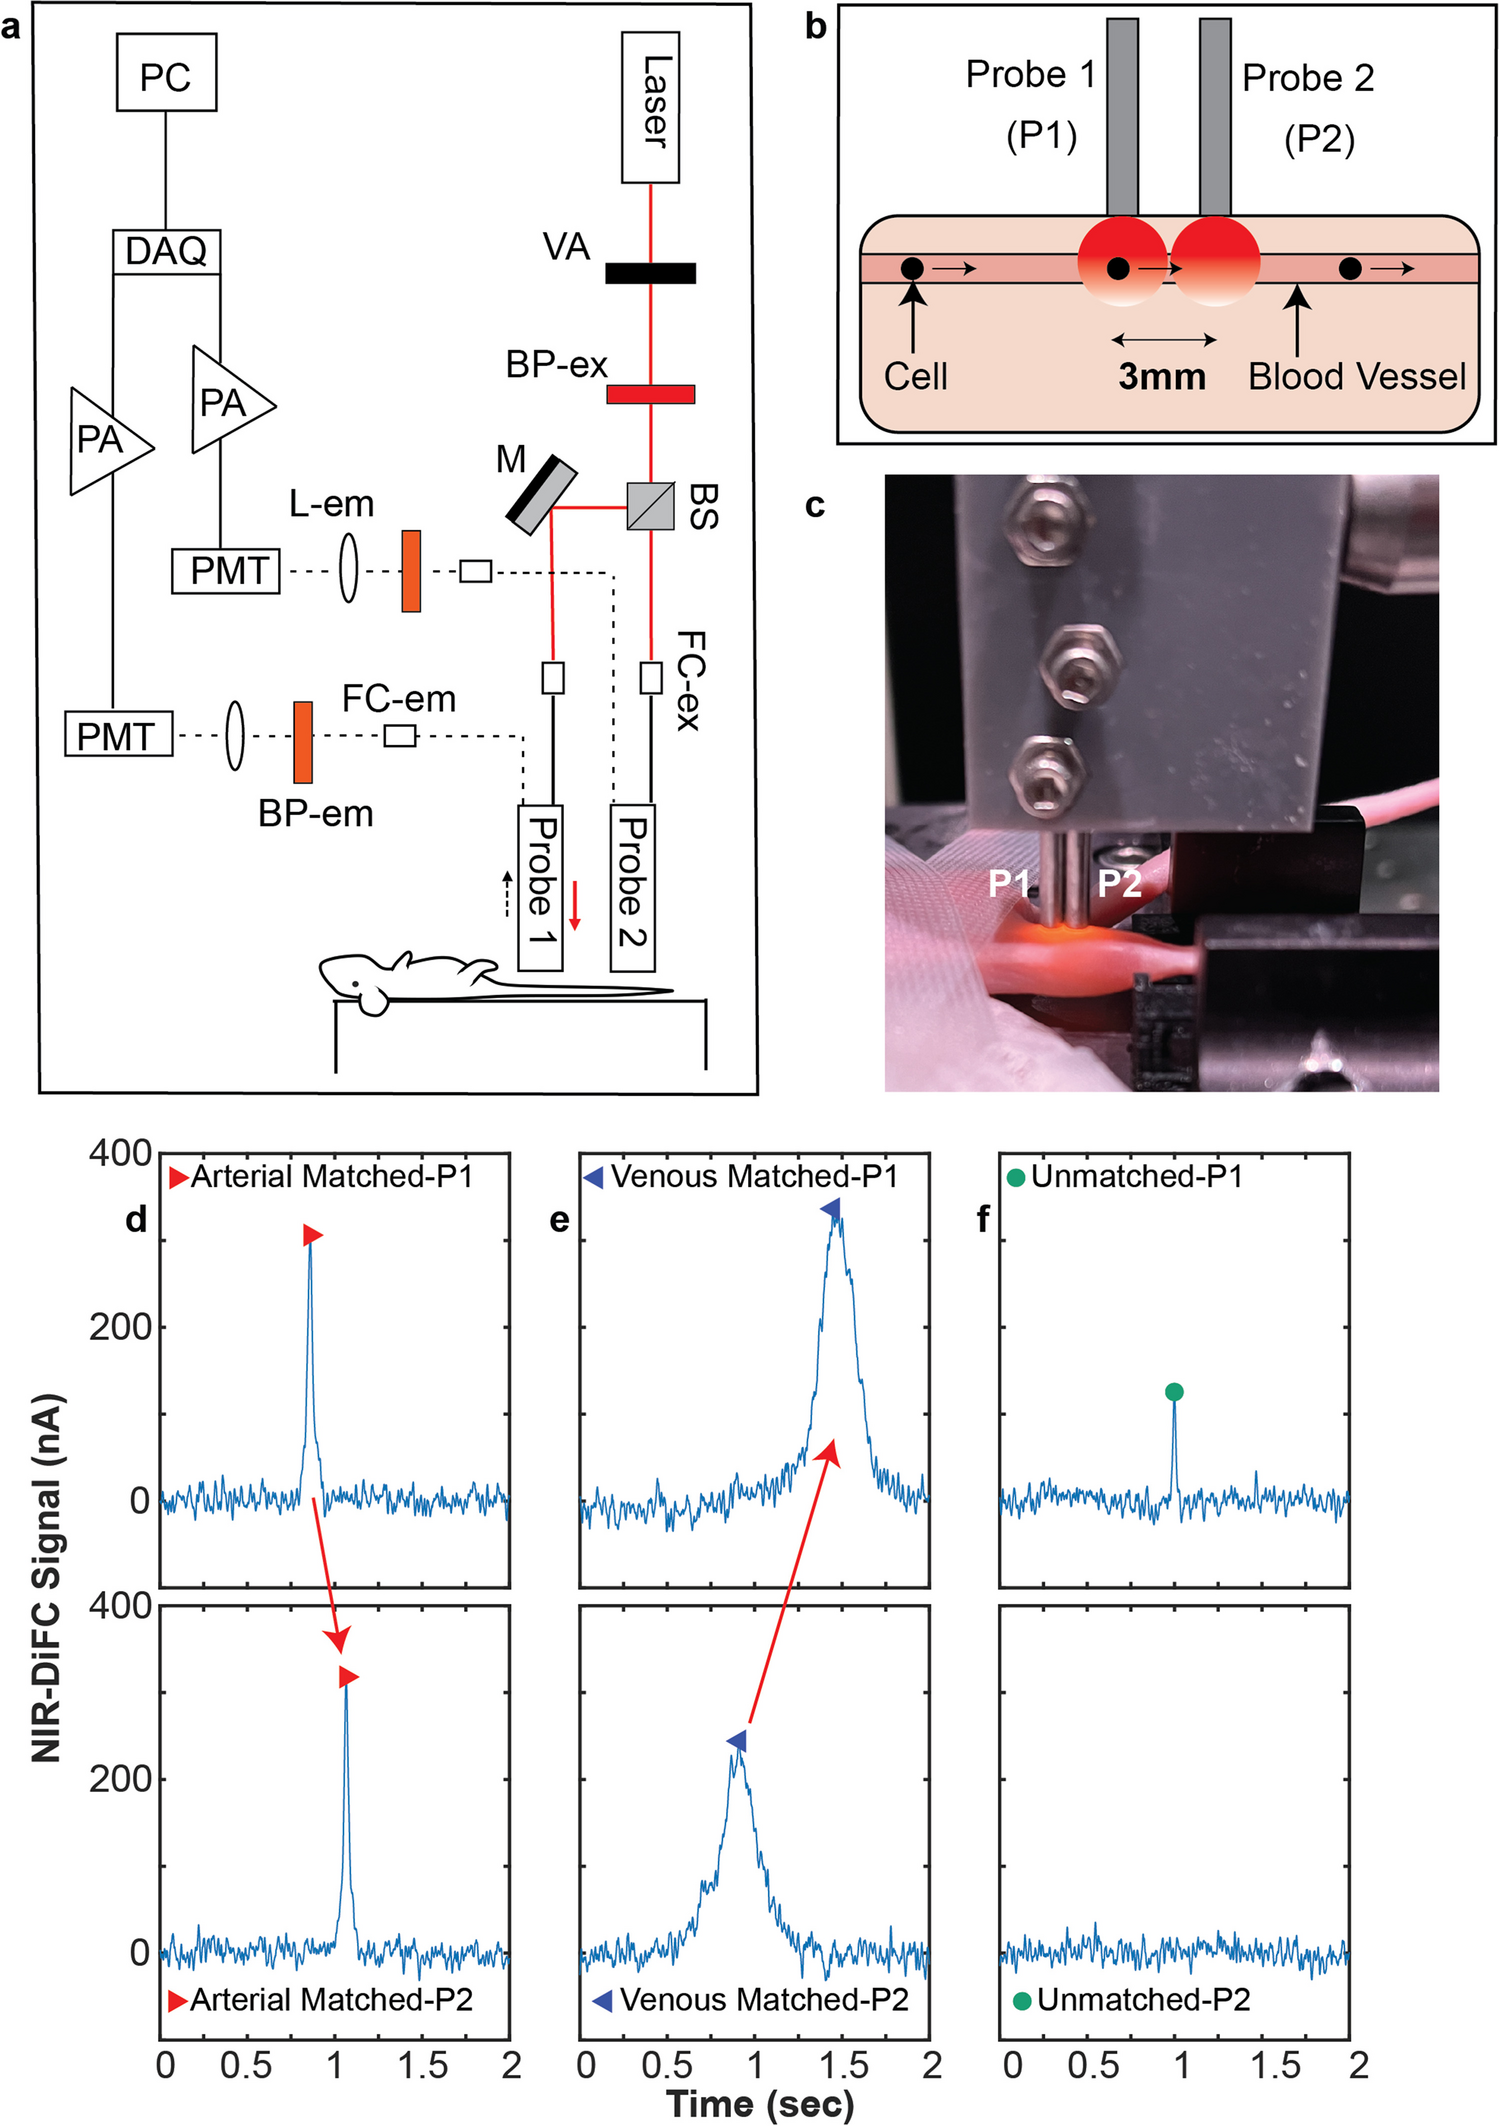


The schematic of NIR-DiFC is shown in Fig. 1a [27]. The light source is a tunable pulsed laser (Mai Tai XF-1, Spectra Physics, Santa Clara, CA) with excitation wavelength set to 770 nm. The power is adjusted with a variable attenuator (VA) before it is passed through a 766/13 nm bandpass clean up filter (BP-ex; FF01-766/13-25, IDEX Health and Science LLC, Rochester, NY). The light is then split into two beams with a beam splitter (BS; 49005, Edmund Optics, Barrington, NJ) before being coupled with a collimation package (FC-ex; F240SMA-780, Thorlabs Inc., Newton, NJ) into source fibers of the optical fiber probe assemblies. For a detailed explanation of the optical fiber probes, refer to [27]. The light power at the sample is set to 25 mW. The output of the probe collection fibers is collimated (FC-em; F240SMA-780, Thorlabs) and the light is passed through an 810/10 nm bandpass emission filter (BP-em; FF01-810/10-25, IDEX Health and Science LLC) before being focused on to the surface of a photomultiplier tube (PMT; H10721-20, Hamamatsu, Bridgewater, NJ) with a 30 mm focal length lens (L-em; 67543, Edmund Optics). The PMTs are powered by a power supply (C10709; Hamamatsu). Output signals from the PMTs are filtered with an electronic 100 Hz low pass filter, amplified with a low-noise current pre-amplifier (PA; SR570, Stanford Research Systems, Sunnyvale, CA), and then acquired with a data acquisition board (USB-6343 BNC; National Instruments, Austin, TX).
Fig. 1
The NIR-DiFC instrument and working principle a Instrument schematic, reproduced with permission from Pace et al. [27]. b As fluorescently-labeled cells travel in a blood vessel under the DiFC system, fluorescence signal is collected by the optical fiber probe assemblies P1 and P2. c Photograph of the NIR-DiFC optical fiber probes placed on the skin over the great saphenous vessels in the hindlimb of a nude mouse. The 3 mm separation between P1 and P2 allows for cell “matching” of cells traveling in the blood vessel. d Cells traveling in the artery cause a detection in P1 before P2, whereas cells travelling in the vein e cause a detection in P2 before P1. f Unmatched cells (due to cells moving in other blood vessels, noise, or motion artifacts) are discarded by the algorithm.
NIR-DiFC Scanning and Data AnalysisDiFC scanning and data analysis was performed as we described in our previous work [27]. Briefly, the optical fiber probe assemblies probe 1 (P1) and probe 2 (P2) are placed on the surface of the skin as shown in Fig. 1b. In the work here, P1 and P2 were aligned on the hindleg of the mouse, approximately above the great saphenous blood vessels (shown in Fig. 1c) or the ventral caudal vessels in the tail of the mouse. As fluorescently-labeled cells travel in the bloodstream they pass underneath P1 and P2. Excitation laser light results in a transient emitted fluorescence signal which is collected by fiber probe assembly. DiFC data from each probe was analyzed with custom written code in MATLAB using the approach described in detail previously:
1.The signal background (due to tissue autofluorescence and instrument background) is estimated as the local moving median value in a 5 s window. This is subtracted from the signal from each DiFC probe.
2.The resulting signal noise (standard deviation) is then calculated in a 1-min moving window.
3.Peak candidates were then identified as local maxima exceeding a threshold of four times the local noise, which gives a minimum SNR of 20*log10(4) = 12.04 dB.
The resulting peaks are then analyzed using a matching algorithm as follows. When the fiber probes are aligned above an artery a peak appears in the P1 (Fig. 1d) and then P2 with a delay corresponding to the transit time between the cells. Likewise, cells moving in the venous direction result in a detection in P2 followed by P1 (Fig. 1e). Cells moving in the venous direction frequently result in temporally wider peaks than the arterial direction due to their slower speed traveling through the DiFC probe field of view. In the case of cells traveling in a capillary bed, peaks are typically observed on one (but not both) probes as in Fig. 1f. Occasionally electronic noise or motion artifacts may also result in spurious unmatched peaks. These unmatched peaks are discarded from analysis, which results in a low operating false-alarm rate.
Cancer Cell LinesL1210A is an immortalized murine leukemia suspension cell line previously modified to over-express FR (Purdue University, West Lafayette, IN) [38,39,40]. IGROV-1 is an immortalized human ovarian cancer adherent cell line that naturally expresses FR (SCC203; Sigma-Aldrich, St. Louis, MO). MM.1S is an immortalized human multiple myeloma suspension cell line that does not express FR and was used as a control (CRL-2974, ATCC, Manassas, VA). All cell lines were cultured in RPMI 1640 folic acid deficient media (Gibco 27016021; ThermoFisher Scientific, Waltham, MA) supplemented with 10% fetal bovine serum (Gibco 16000044; ThermoFisher Scientific) and 1% penicillin/streptomycin (Gibco 15140122; ThermoFisher Scientific) and incubated at 37 °C with 5% CO2. For all experiments, cells were first collected from T-75 tissue culture treated flasks (FB012937; Thermofisher Scientific). For the adherent cell line IGROV-1, the cell culture media was aspirated and then 6 mL TrypLE Express (Gibco 12604021; ThermoFisher Scientific) added for 5 min to get the cells into suspension.
OTL38 Folate Receptor Targeted Molecular ProbeOTL38 (On Target Laboratories, West Lafayette, IN) is a small molecule NIR fluorescent dye (MW 1326.49 g/mol) that targets FR⍺ cell surface receptors. OTL38 is FDA approved for the use in fluorescence guided surgery of ovarian and lung cancer under the name Cytalux [32, 41, 42]. OTL38 uses S0456 dye [similar fluorescence spectrum to indocyanine green (ICG)] is conjugated to a folate analog to and has 776 nm and 793 nm maximum excitation and emission wavelengths, respectively [43].
Labeling of Cells with OTL38 In VitroExperiments where cancer cells were labeled in culture in vitro are subsequently referred to in this manuscript as “prelabeled cells” (as opposed to cells labeled in while in blood circulation in vivo). Approximately 106 cells were suspended in phosphate-buffered saline (PBS) (Gibco 10010049; ThermoFisher Scientific) with 2% FBS (30-2020; ATCC) added for each experiment. 200 nM (20 μL of 10 μM stock) of OTL38 was added to the suspensions at 37 °C with 5% CO2 for 1 h. Cells were then washed twice with PBS before further experiments.
Labelling of Cells with CellTrace CFSE FluorophoreIn some experiments, 106 cancer cell suspensions in PBS were also stained with a green fluorophore, CellTrace CFSE (Invitrogen C34554; ThermoFisher Scientific) according to the manufacturer’s instructions prior to OTL38 labeling as above. As we show, this allowed us to differentiate cancer cells from other cell types in complex suspensions of Peripheral Blood Mononuclear Cells [PBMCs, (PCS-800-011; ATCC)] or peripheral blood.
Labeling of FR + Cells with OTL38 in Suspensions of PBMCs In VitroTo study specificity of OTL38 for cancer cells in the presence of other types of blood cells that may bind or scavenge OTL38 we studied complex suspensions of human PBMCs (which include dendritic cells, monocytes, and lymphocytes). 106 PBMCs and 104 CellTrace CFSE stained cancer cells were suspended in 1 mL of PBS with 2% FBS added. OTL38 was added to the suspension as described in Sect. "Labeling of Cells with OTL38 In Vitro". To introduce competitive binding (blocking) of OTL38, some suspensions of PBMCs and IGROV-1 cells were first co-incubated with 10 µM free folic acid (F7876; Sigma-Aldrich) for 30 min before addition of OTL38. All cell solutions were washed with fresh PBS twice and then analyzed by fluorescence Flow Cytometry (see Sect. "Flow Cytometry"). All samples were repeated at least N = 6 times (least 2 repeats and 3 replicates) with a minimum of 100,000 fluorescent count events.
NIR-DiFC Detection of Prelabeled L1210A Cells in MiceAll mice were handled in accordance with Northeastern University’s Institutional Animal Care and Use Committee (IACUC) policies on animal care. Animal experiments were carried out under Northeastern University IACUC protocol #21-0412R. All experiments and methods were performed with approval from and in accordance with relevant guidelines and regulations of Northeastern University IACUC.
First, to determine detectability of CTCs well-labeled with OTL38, we intravenously i.v. injected prelabeled L1210A cells in the tail vein of nude mice. L1210A cells were first double labeled with OTL38 and Cell Trace CFSE in vitro and were suspended in 100 μL of cell culture media. Cell suspensions were injected i.v. via the tail vein of 6–8-week-old female Athymic nude mice (Nu/Nu/553; Jackson Laboratory, Bar Harbor, ME). NIR-DiFC was preformed 10 min after injection on the saphenous vessels for 60 min for each mouse (N = 3). Following NIR-DiFC scanning, blood draws were performed by terminal cardiac puncture. For the blood collection, 200 µL Heparin (H3393-10KU; Sigma-Aldrich) was drawn into a 3 mL 27G syringe (309570; Becton, Dickinson and Company, Franklin Lakes, NJ) to prevent blood clotting. After removing as much peripheral blood as possible (> 500 µL), the peripheral blood and Heparin mixture was added to 0.5 mL K3 EDTA coated tubes (450475; Greiner Bio-One, Kremsmünster, Austria) for processing and cells were then analyzed by benchtop fluorescence Flow Cytometry (Sect. "Flow Cytometry").
NIR-DiFC Detection of L1210A Cells Labeled with OTL38 in Circulation In VivoNext, to determine the feasibility of labeling CTCs while in circulation in the bloodstream in vivo (as opposed to in cell culture prior to injection), we sequentially injected L1210A cells and OTL38 in nude mice intravenously. We subsequently refer to these as “in vivo labeled cells” in this manuscript. L1210A cells were first labeled with CellTrace CFSE in vitro as above, suspended in 100μL of cell culture media and i.v. injected in of 6–8-week-old female Athymic nude mice (N = 3). After 5 min, 2.5 µg of OTL38 dissolved in 100 µL PBS was i.v. injected via the tail vein. After approximately 1 h, NIR-DiFC was performed on the hindlimb vessels for 60 min. As discussed in the results section below, this increased time before DiFC scanning was due to an increase in fluorescence background signal immediately after injecting free OTL38. After 60 min we drew blood samples and analyzed them using Flow Cytometry.
Systemic OTL38 Clearance and NIR-DiFC BackgroundIn a separate set of experiments, 6–8-week-old female Athymic nude mice were injected via the tail vein with 2.5 µg OTL38 dissolved in 100 µL PBS. NIR-DiFC scanning was performed for 10 min at 3-,6-,9-,12-, 24-h post injection (N = 3). The background signal was recorded and normalized to a baseline value for each individual mouse.
Flow CytometryCell samples were analyzed using a benchtop Attune NXT flow cytometer (FC) (ThermoFisher Scientific). NIR fluorescence was collected using a 637 nm laser and a 780/60 nm emission filter. CellTrace CFSE green fluorescence was collected using a 488 nm laser and 530/30 nm emission filter. Samples were analyzed using FlowJo software and samples were gated for size and singlets based on corresponding cell populations. In cases where mouse blood samples were analyzed, red blood cells (RBCs) were first depleted by adding the samples to 2 mL 10 × RBC Lysis buffer (420,301; BioLegend, San Diego, CA) diluted to 1 × in 18 mL sterile water for 15 min. Suspensions were then washed twice with PBS and resuspended to a final volume of 3 mL PBS.
留言 (0)