
記住我

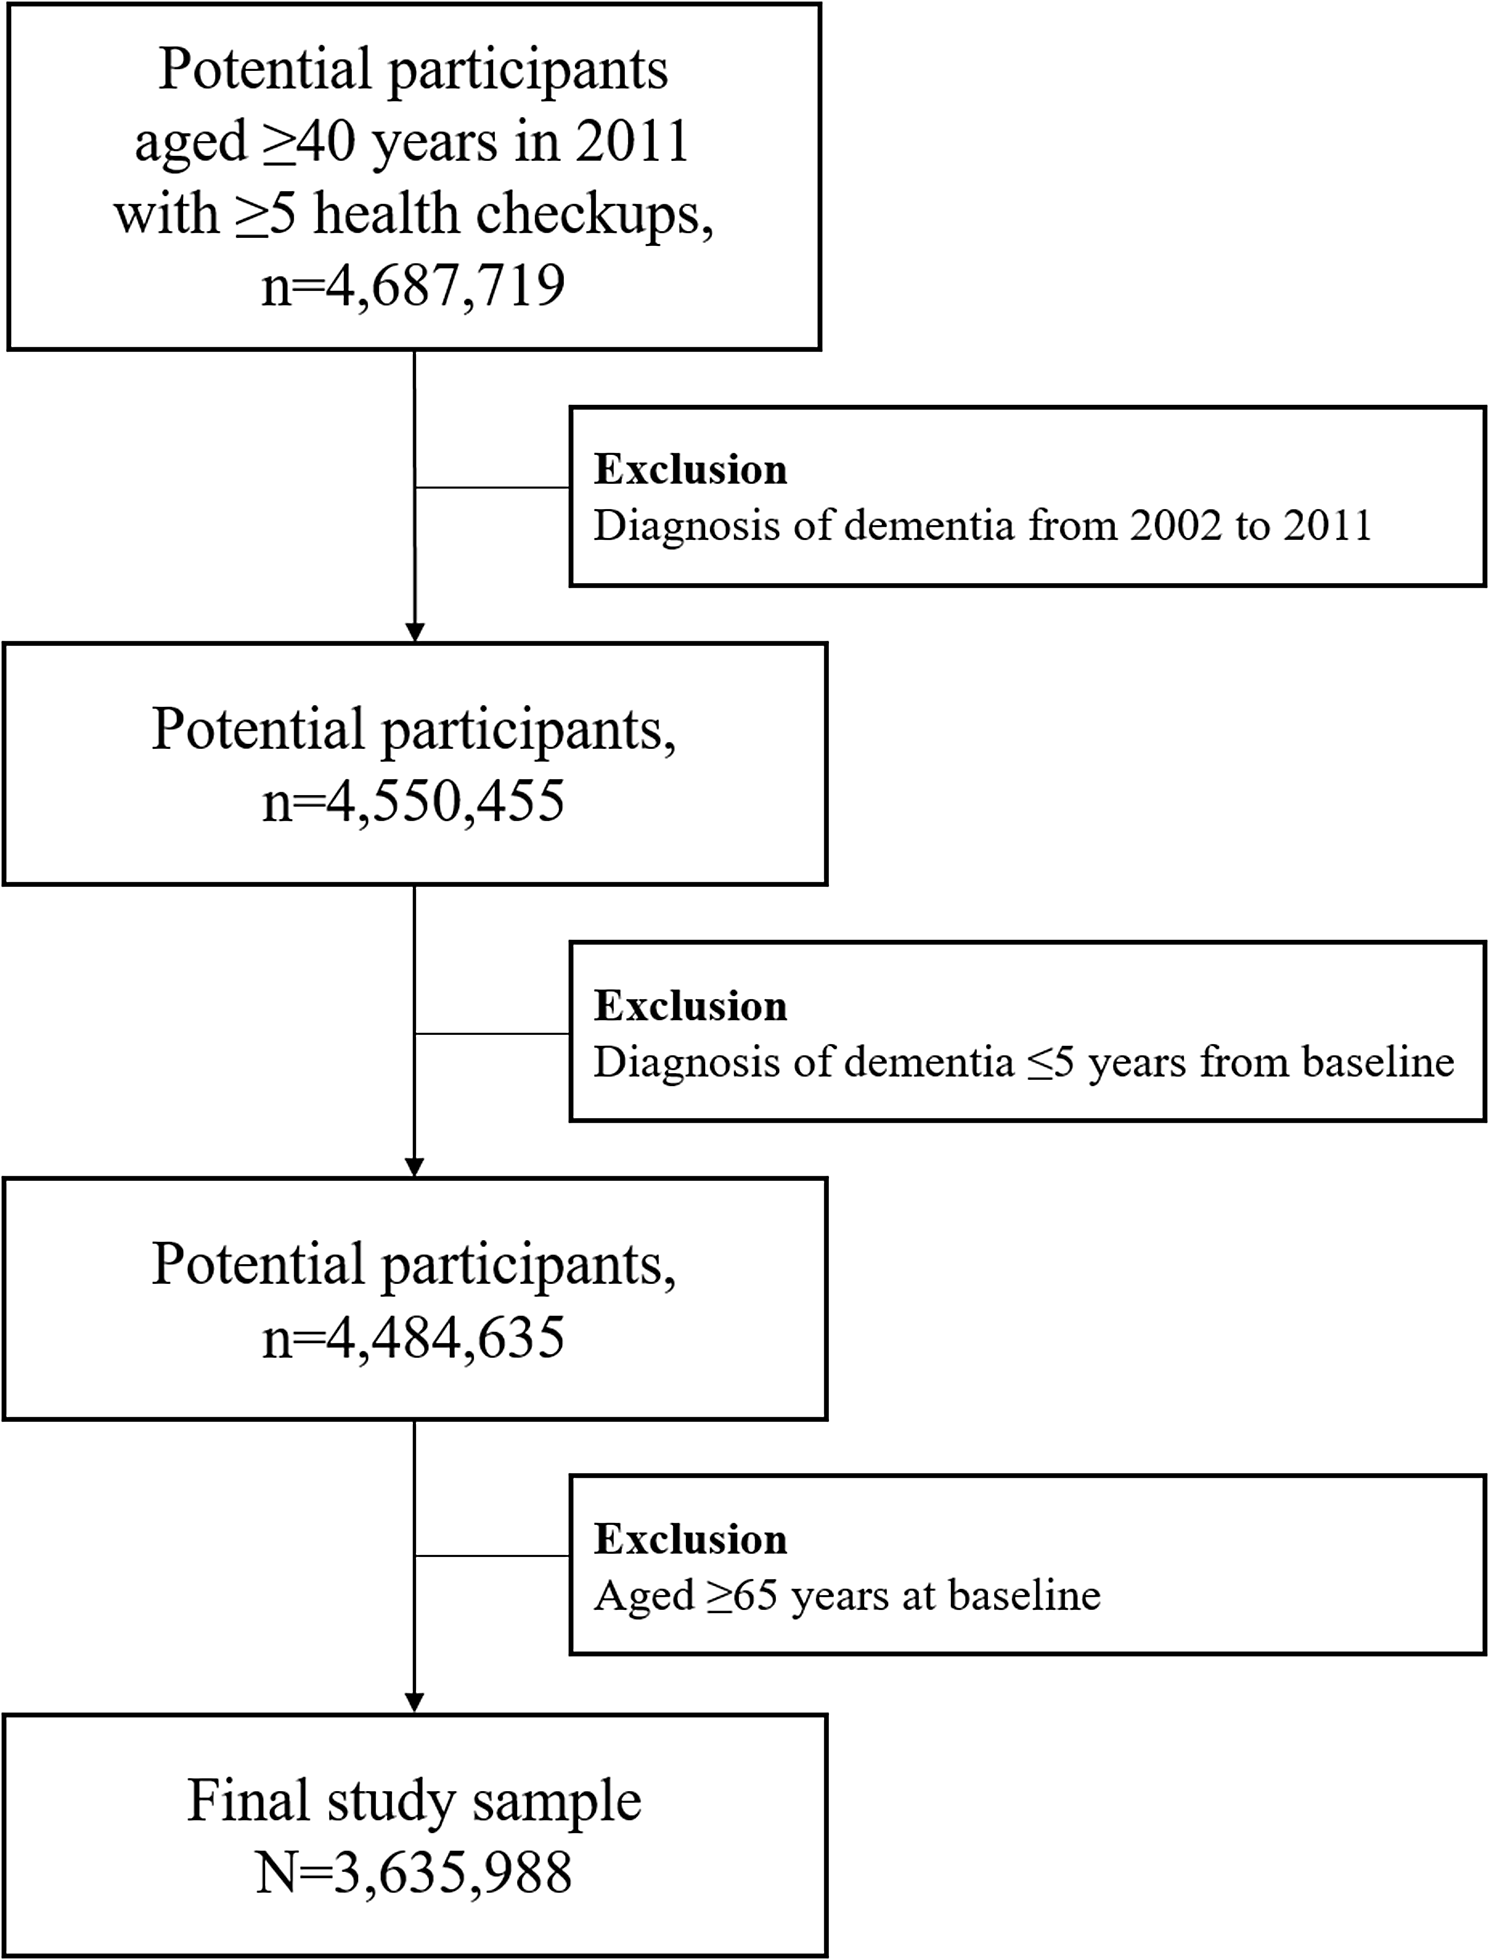
Table 2 shows an overview of clinician characteristics and quantitative study outcomes. The clinicians (n=14) were, on average, 38±6 years old, almost all (91%) were female, and they had a mean of 7±7 years of experience in memory clinic care. Participants with ID 9 to ID 14 were residents in the final years of their residency training, with limited experience in memory clinic care. All other clinicians had at least four years of experience. All participating hospitals use electronic health records (EHRs), so all clinicians had some level of digital proficiency in advance.
Table 2 Overview of participating clinicians and quantitative study outcomesAs shown in Fig. 2, 52 patients were initially enrolled. Six patients withdrew during the study (because of high study burden or unspecified reasons), and three patients were excluded for logistic reasons (no diagnostic assessment at all or due to time constraints). In total, data from 43 patients, together with 28 accompanying care partners, were available for analysis. Data on the 6-months follow-up questionnaire were available for n=23 patients and n=15 care partners. Most of the patient follow-up questionnaires were missing because they were never received back despite of reminders (n=15), patients were no longer able to fill in the questionnaire due to their cognitive decline (n=3), or had died (n=2). Table 3 shows the characteristics of the included patients and care partners.
Fig. 2
Study flowchart and process evaluation
Table 3 Characteristics of participating patients (n=43) and their care partners (n=28)Patients were, on average, 73±11 years old (range: 37-94) and predominantly male (n=30, 72%). Most patients (44%) were diagnosed with mild cognitive impairment (MCI) and one-third (33%) with dementia, mainly due to Alzheimer’s disease (64%). Most care partners were female (71%) and spouses. As shown in Table 3, patients and care partners were generally satisfied with their clinician and (the information provided during) the diagnostic result consultation.
Figure 2 shows the study flowchart of the observed use of the tool in daily practice. In 56% of the patients (24/43) the dataset was complete (i.e., containing both cCOG and cMRI results). The tool was used in 34 out of 43 patients (79%). Strikingly, clinicians used the tool in highly variable ways. Modules 3 and 4 (cDSI and patient report) were used most often (30/34, 88%). Many patients completed cCOG (88%), yet clinicians only used this module in 53% of patients prior to or during the diagnostic result consultation. Although the cMRI module was available for 27 patients, it was only used for ten patients by four clinicians. These numbers show a large variability in the actual use of the tool. Likewise, quantitative study outcomes (Table 2) are also highly variable and dependent on the actual use of the tool. As such, the qualitative findings are crucial for interpretation of the quantitative results. Our synthesis of quantitative and qualitative findings resulted in four core findings, which we describe below, illustrated with quotes and quantitative results.
Clinicians highly valued the diagnostic report, since it contributes to patient-centered and personalized communication.Clinicians expressed the wish to provide patients with printed or written personalized information but lack time to create such a personalized report in their daily practice. They indicated the tool’s diagnostic report helped them fulfill this need. Additionally, the clinicians noticed that their patients appreciated receiving the diagnostic report.
Quote 1.1.: “…so I think they [the patients] thought it was normal [to receive personalized information]. And I too, I think it is normal. I only wouldn’t know how to do this.” (Clinician 7)
Quote 1.2.: “Yes, I actually think it is nice to share that on paper with all our patients, especially patients with dementia. We often share the patient letter, but that predominantly contains medical jargon. Yes, that is very patient-friendly and it really should be done, but it still takes quite a lot of time to do it properly. And, um, in reality that doesn’t happen very often." (Clinician 2)
Concerning the potential beneficial effects, the clinicians mentioned that the tool created an overview, aiding effective patient communication. In the questionnaires, the majority (73%) of the clinicians (totally) agreed that communication with the patient becomes more efficient when using the tool.
In addition to supporting their communication with patients, clinicians highly valued the diagnostic report from the patient’s perspective because they consider it beneficial for patients’ and care partners’ understanding and recall of the information provided in the diagnostic result consultation.
Quote 1.4.: “Because patients only remember a very limited part (…) it is actually a bad news conversation that people receive when they are diagnosed with dementia and sometimes they only remember 5 to 10% of what the physician told them: they basically go home empty-handed. But now they will have an actual form with the results on which it is possible to type additional information (…) or a description of the follow-up process. Also, the patients can read back another time of ‘My diagnosis is Alzheimer's disease and that diagnosis was made based on memory tests and a scan’ or things like that. In short, I am really super enthusiastic about the whole information page..” (Clinician 4)
They further indicated that the abovementioned pros of having a diagnostic report would outweigh the time investment needed to create such a report within the tool.
Quote 1.5.: “yes, definitely, I certainly think there are a lot of positives. I didn’t think of it as extra work (…) no, not at all, I really thought it is a good thing. (…) No, I really think it pays off, and I therefore didn’t mind the extra work.” (Clinician 3)
The diagnostic report was also valued by patients and care partners, who, directly after the consultation, rated the diagnostic report as clear, understandable, and useful (Fig. 3). In the open-ended question about the diagnostic report, a patient positively highlighted the visual aspect of the diagnostic report:
Fig. 3
Patients’ and their care partners’ rating of the diagnostic report
“All of the extra information, the images, the examinations, etc. are instructive and clarify a lot. This document complements the doctor's explanation. This document helps in understanding my illness, in addition to only hearing what the doctor has to say. It is also nice to see the information visualized.” (female, 73 years, dementia due to Alzheimer’s disease).
A care partner underscored the understandability of the diagnostic report:
“A good way to present difficult information (both emotional and medical) in a clear and understandable manner.” (44 years, daughter of patient with dementia).
After six months, satisfaction with the diagnostic report (scale 0-4) was 3.0±0.5 for patients and 3.2±0.4 for care partners, and 78% of the patients and 83% of the care partners would want their doctor to use the diagnostic report again in a future consultation.
Clinicians considered the tool satisfactory to varying degrees, especially in addition to their own clinical competence.Satisfaction ratings with the tool overall varied among the clinicians, as shown in Table 2. In the interviews, the clinicians explained that the diagnostic process is difficult, and a tool that objectively interprets patient data can be helpful, as illustrated by quotes 2.1 – 2.2.
Quote 2.1.: (…) But there is the difference for me, that I have some kind of objective means that validates or challenges my clinical reasoning." (Clinician 2)
Quote 2.2.: “yes, I understand the question very well, because cognitive diagnostics is indeed really difficult (…) I always tell the residents that I mastered many subjects in medicine quite quickly, but that it really took me a while to get the hang of cognitive diagnostics. (…) so it would be nice if it in some way could be made easier.” (Clinician 6)
Furthermore, clinicians’ confidence in the diagnosis was slightly, though not significant (P=0.23), higher when the tool was used (80±13) than when not used (74±11). Additionally, 46% of the clinicians indicated that using the tool increased their confidence. In the post-tool questionnaire, most clinicians (55%) agreed that the tool makes the differential diagnosis of neurodegenerative disorders easier. However, the same complexity of the diagnostic process also led clinicians to emphasize that the doctor’s interpretation is always needed to personalize the results provided by the tool:
Still, they also described how they could use the tool to double-check the results of their own clinical reasoning:
Quote 2.4: “Yes, and I can also imagine that one can use it as a kind of checker. That you think like ‘okay this is what I think it is, let's see what cNeuro thinks.’ If it thinks it is something completely different, maybe I should reconsider my diagnosis.” (Clinician 3)
In its current state and level of integration, some clinicians questioned the added value of the tool in addition to their knowledge and expertise. Some clinicians specified that the tool did not (yet) incorporate some of the diagnostic tools used in their clinical practice (e.g., specific neuropsychological tests, but also brain scans such as computer tomography (CT) or positron emission tomography (PET)).
Quote 2.5.: “Yes, well, it may be even nicer if you can also include all the standard diagnostic tests in your analysis, in other words, to expand that tool even more to be able to enter everything that is being done. Yes, that would be ideal.” (Clinician 6)
Quote 2.6.: “The tool made the diagnosis but I myself made the same diagnosis with the information that was available to me (…) So then obviously the question is ... does the tool really help you? Actually no, it is merely doing the same thing as I do with the clinical information I have.” (Clinician 4)
Others did sometimes not trust the output because in their population, not all data were available and they therefore thought that they could not use the tool to its full potential, or they doubted the reliability of the outcome.
The appropriateness of the tool depends on the patient population and the specific purpose of the diagnostic process.Although the clinicians considered the tool acceptable in addition to their clinical competence, they felt it would be most appropriate for specific patients or patient populations, depending on the purpose of the diagnostic process. As illustrated by quote 3.1, some clinicians especially valued the tool for a diagnostic process focused on determining the etiological diagnosis. Quote 3.2. illustrates that the tool could be used to decide whether to apply additional diagnostic tests.
Quote 3.1.: “Yes and at the same time I think (…) the idea of this tool that gives a kind of weighted result of does this fit AD, does this fit FTD, does this fit something else? That's actually quite useful of course.” (Clinician 3)
Quote 3.2.: “Well, I think that with certain types of patients you could use it as a kind of pre-selection tool, to determine how far you have to go and what the probability is in advance (…) as part of a kind of two-stage package perhaps? (…) if you ensure that the test has good sensitivity and can filter out a part of those [persons with] subjective complaints of which you already know that they do not require further examination.” (Clinician 6)
Since some clinicians focus more on a syndrome diagnosis rather than an etiological diagnosis to adequately organize care for their patients, they rated the tool as less useful for the patient population in their daily clinical practice. This was often mentioned by clinicians working with older individuals.
Quote 3.4.: “in such an aged population characterized by a mix of symptoms it often is more subtle: I think we not only diagnose a particular disease or asses the etiology, but also pay more attention to syndrome diagnosis and (…) what impact is it going to have on the patient’s daily life (…) what issues are you going to work on, being more practical than just appointing a case manager, in an early stage providing information/giving advice that you believe can be useful to the patient. With such an approach the etiology is often a little less important.” (Clinician 12)
In addition, the availability of data for this patient population of older aged individuals was frequently limited. This was either because patients were unable to complete cCOG, or because MRI and cerebrospinal fluid (CSF) assessment were not part of standard care procedures in geriatric or internal medicine practices, as mentioned in this citation:
Quote 3.5.: “Most patients are not subjected to an LP or MRI, (…) usually the standard workup is sufficient for a proper diagnosis and I therefore think your tool is not very useful (…). I can just imagine if you puzzle a little bit; what is it now (…) Then I can imagine you can weigh the combination LP with MRI a little better” (Clinician 2)
Facilitators and barriers for using the tool in daily practice.Clinicians evaluated the usability of the tool in the context of the current study (design), in which they were provided with a prototype version of the tool. They received a short training before the study started, which was elaborated during the usability study period based on feedback. Thus, some clinicians received more training than others. Using the tool in the context of the current usability study, the clinicians identified some facilitators and barriers to using the tool in daily practice.
Facilitators for using the toolIn the post-study questionnaire, 7/11 clinicians (slightly) agreed that the tool could easily be integrated into their daily work process. Regarding factors that would facilitate clinicians using the tool, clinicians who had used the tool often (≥4 times), mentioned that they found it easy to use whereas clinicians who less often used the tool found it more difficult to use.
Quote 4.1.: "It is easy to use, you can log in very easily and then you can easily find the right patient and click further to see the patient details. ” (Clinician 4 – used the tool four times)
Quote 4.2.: “For a software program I found it quite complicated, especially also because it uses a lot of abbreviations, so if you haven’t use it for a while then you have to remember what they stand for, so you click from one thing to the other (…).” (Clinician 7 – used the tool once)
To facilitate adequate use of the tool, the clinicians also indicated that practice makes perfect, i.e., repeated and consistent use facilitated mastering how to optimally work with it.
Quote 4.3.: “(…) I have only had 2 patients that I've really used it with so then each time you still have to really get back in a little bit and I don't think it saved time, but I yes I can imagine if you switch easier or use it more often that it does at least not take longer.” (Clinician 12)
Barriers to using the toolSome clinicians mentioned that the high workload and limited time in their clinics could hinder the process of learning to work with a new tool and, therefore, the appropriate use of such a tool.
Quote 4.4.: “As an option, but then I still have to um, you know then I would have to start using it (…) but then I thought, here is yet another software program that has to be used and there already is so little time to properly deal with your outpatient visits.” (Clinician 2)
Another more practical barrier was that the tool was not integrated into the EHR hence they had to log in to a different website and they had to put in the data twice (once in the EHR and once in the tool).
留言 (0)