Animals
Six-week-old female SPF-grade C57BL/6J mice were obtained from SpePharm (Beijing) Biotechnology Co., Ltd. All mice were housed at a temperature of 20–26 °C with a relative humidity of 40-70%. The animals were subjected to a 12-hour light/dark cycle and had ad libitum access to food and water. Experimental procedures commenced one week after acclimatization to the housing conditions. The use of animals in this study was approved by the Ethics Committee for Animal Experiments at Guizhou University.
Isolation and functional assessment of mitochondria
Mitochondria were isolated from 4th to 7th passage human umbilical cord mesenchymal stem cells (KarlCell Bio, China) using a cell mitochondrial extraction kit (Thermo, USA). The structural examination of mitochondria was conducted with transmission electron microscopy. Mitochondrial membrane potential was evaluated using MitoTracker® Red FM staining solution (Thermo, USA) and the JC-1 mitochondrial membrane potential detection kit (Beyotime, China). The mitochondrial concentration was determined using the Coomassie Brilliant Blue G250 assay (Solarbio, China).
Establishment and treatment of POI model mice
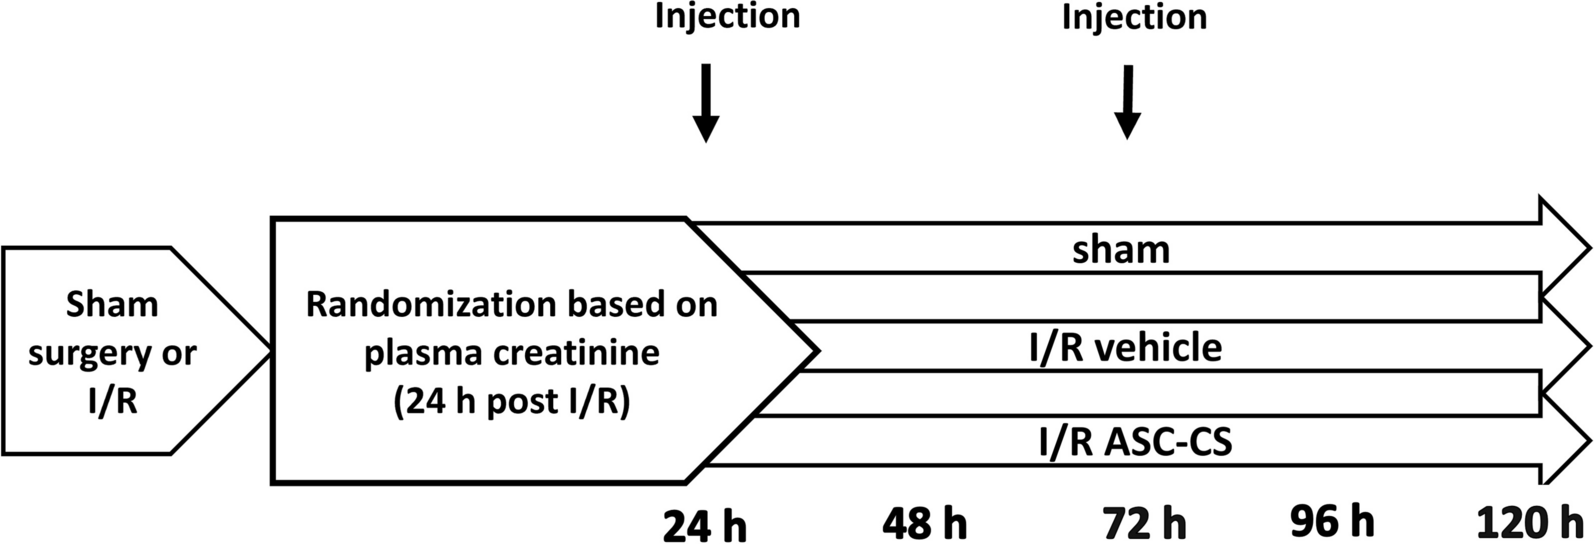
Thirty-five mice were randomly divided into five groups: control, POI, POI + PQQ, POI + Mito, and POI + PQQ + Mito. Except for those in the control group, all mice were induced to establish the POI animal model by a single intraperitoneal injection of 60 mg/kg cyclophosphamide (Sigma, USA) and 15 mg/kg busulfan (Solarbio, China). In the PQQ treatment group, the mice were orally administered 15 mg/kg PQQ (Sigma, USA) daily for three weeks. In the mitochondrial treatment group, each mouse received 200 µg of mitochondria via intraperitoneal injection twice a week for three weeks. In the combined treatment group, the mice were orally administered 15 mg/kg PQQ daily and received intraperitoneal injections of 200 µg mitochondria twice a week for three weeks. The control group and the POI group received equivalent volumes of normal saline via oral gavage and intraperitoneal injection at the same time. Two days before the end of the experiment, each mouse was subcutaneously injected with 0.1 ml of pregnant mare serum gonadotropin (PMSG) (Solarbio, China) to synchronize their oestrous cycles. Twelve hours before euthanasia, food and water were withheld. Mice were anesthetized by intraperitoneal injection of 50 mg/kg sodium pentobarbital. Blood is collected by removing the eyeball, and then the skin and muscle layers are cut from the abdomen to extract bilateral ovarian tissue. Collected blood samples were allowed to stand at room temperature for 1 h, followed by centrifugation at 3000 rpm at 4 °C for 10 min. The upper serum layer was separated, sealed, and stored at -20 °C for later use. One side of the collected ovarian tissue was fixed in 10% neutral formalin and the other side was stored in an ultra-low temperature refrigerator at -80 ℃. The work has been reported in line with the ARRIVE 2.0 guidelines.
Vaginal smear
Vaginal smear examinations were conducted daily at 10:30 AM to observe the oestrous cycles in each group. A cotton swab for children moistened with double-distilled water was gently inserted into the mouse’s vagina and rotated clockwise 3–4 times. The collected vaginal cells were evenly spread on a glass slide. After the smear was naturally air-dried, the cells were fixed using wright stain solution (Solarbio, China). Changes in the oestrous cycle were observed under a microscope.
Enzyme-linked immunosorbent assay (ELISA)
An ELISA kit (Jingmei, China) was utilized following the manufacturer’s instructions to measure the levels of anti-Müllerian hormone (AMH), oestradiol (E2), and follicle-stimulating hormone (FSH) in the serum of mice from each group. In brief, 50 µL of 5-fold diluted serum samples was added to the wells of an enzyme-coated plate. After incubation with the enzyme-conjugated reagent, the plate was washed five times. Subsequently, a mixture of chromogenic reagents A and B was added, followed by the addition of 50 µL stop solution. The absorbance at 450 nm was measured for each well after zeroing against blank wells.
Follicle counting
After three weeks of treatment with pyrroloquinoline quinone and mitochondria, the ovaries of each mouse were collected. The ovaries were fixed in 4% paraformaldehyde, embedded in paraffin, and sectioned. Haematoxylin and eosin (H&E) staining was performed on the sections. Based on the distinct morphological characteristics of follicles, the primordial follicles, primary follicles, secondary follicles, mature follicles, and atretic follicles were counted for each slide. Subsequently, the proportions of different follicle types in each group were analysed.
Immunohistochemistry (IHC)
The paraffin-embedded ovarian tissue sections from each group of mice were deparaffinized by baking in a constant temperature oven at 60 °C for 1 h. Subsequently, the samples were deparaffinized and hydrated using xylene and a gradient of ethanol. After high-pressure antigen retrieval with citrate repair solution and removal of endogenous peroxidase, the sections were blocked using 5% specialized goat serum. They were then incubated overnight at 4 °C with the appropriate primary antibodies. Subsequently, incubation with goat anti-rabbit secondary antibodies was carried out at 37 °C for 1 h. DAB staining solution was applied for 5–10 min, followed by counterstaining with haematoxylin for 20 s. After dehydration and sealing the slides, the sections were observed and recorded under a microscope.
Cell culture and grouping
KGN cells were obtained from Procell Life Science Technology Co., Ltd., for in vitro research. KGN cells were cultured in DMEM/F12 medium containing 10% foetal bovine serum. The culture conditions were maintained at 37 °C with a 5% CO2 atmosphere. For establishment of an in vitro model of POI, the active metabolite of cyclophosphamide, phosphoramide mustard (PM) (MedChemExpress, China), was used. The cells were divided into 5 groups: the normal control group (control), the model group (PM), the pyrroloquinoline quinone treatment group (PM + PQQ), the mitochondria treatment group (PM + Mito), and the combination treatment group (PM + PQQ + Mito).
Cell proliferation assay (CCK-8)
KGN cells were seeded in a 96-well plate at a density of 1×10⁴ cells/mL, with 100 µL of cell suspension in each well. Each group had at least 3 replicate wells. The plate was placed in a 37 °C, 5% CO2 incubator until the cells reached approximately 80% confluence. The culture medium was then aspirated, and different concentrations of PM, Mito, and PQQ were added to the wells. The cells were incubated in the incubator for an appropriate amount of time. Next, 10 µL of CCK-8 enhanced solution (Meilunbio, China) was added to each well, and the plate was further incubated in the incubator for 0.5 h. The optical density (OD) at 450 nm was measured.
Measurement of mitochondrial membrane potential
The mitochondrial membrane potential was determined using the JC-1 mitochondrial membrane potential assay kit. To each well of a six-well plate, 1 mL of JC-1 staining working solution and 1 mL of cell culture medium were added. The mixture was thoroughly mixed and then placed in a cell culture incubator at 37 °C for 20 min. Afterwards, the cells were washed twice with JC-1 staining buffer (1×) and observed under a fluorescence microscope.
Real-time fluorescence quantitative PCR (RT‒qPCR)
Total DNA from cells in each group was extracted using a DNA extraction kit (Tiangen Biotech, China). Total RNA from processed KGN cells was extracted using TRIzol™ reagent (Thermo, USA). Subsequently, the RNA was reverse transcribed into cDNA using a reverse transcription kit (TaKaRa, Japan). PCR amplification of the target genes was performed using the TB Green PCR reagent kit (TaKaRa, Japan). The relative expression levels of the target genes were determined using the 2-ΔΔCt method, with GAPDH as the negative control. The primer sequences are provided in Table 1.
Table 1 List of primers in RT-qPCRROS measurement
DCFH-DA (Solarbio, China) was diluted in serum-free culture medium at a 1:1000 ratio, resulting in a final concentration of 10 µmol/L. After the cells were collected, they were suspended in diluted DCFH-DA solution, achieving a cell concentration of one to twenty million cells/mL. The cells were then incubated at 37 °C in a cell culture incubator for 20 min. Every 3–5 min, the solution was gently mixed to ensure proper contact between the probe and the cells. Afterwards, the cells were washed three times with serum-free cell culture medium to remove any remaining DCFH-DA that had not entered the cells. The fluorescence intensity was measured using a fluorescence microplate reader at an excitation wavelength of 488 nm and an emission wavelength of 525 nm.
SOD and MDA measurement
Mouse ovarian tissues were retrieved from a -80 °C freezer and weighed accurately. The tissues were then homogenized by adding 9 times the volume of physiological saline based on tissue weight (g): volume (mL) = 1:9 ratio. After tissue homogenization, the mixture was centrifuged at 2500–3000 rpm for 10 min, and the supernatant, which was the 10% homogenate, was collected. The SOD and MDA levels were measured according to the instructions provided by the manufacturer (Nanjing Jiancheng Bioengineering Institute, China).
Flow cytometry
Apoptosis levels in various cell groups were assessed using the Cell Apoptosis Detection Kit (BD Biosciences, USA). Cells were digested with trypsin, washed twice with prechilled PBS, and then resuspended in 1× binding buffer at a concentration of 1 × 10⁶ cells/mL. A total of 100 µL of the suspension (1 × 10⁵ cells) was transferred to a 5 mL culture tube. To this, 3 µL of FITC Annexin V and 5 µL of PI were added. The cells were gently vortexed and incubated in the dark at room temperature (25 °C) for 15 min. Subsequently, 300–400 µL of 1× binding buffer was added to each tube, and flow cytometry analysis was conducted within 1 h.
Comet assay
Drug-treated KGN cells were collected in a 1.5 mL centrifuge tube. Ninety microlitres of 0.8% low-melting-point agarose gel was mixed with 10 µL of cell suspension containing approximately 1000 cells. Then, this mixture was spread onto a 1% normal-melting-point agarose gel quickly, covered with a coverslip, ensuring that there were no air bubbles, and placed in a 4 °C refrigerator for 10 min to solidify the gel. The glass slide was placed into the prechilled cell lysis working solution and incubated at 4 °C for 1 h. The glass slide was submerged horizontally into the prechilled alkaline electrophoresis working solution, avoiding light, and samples were incubated for 20 min. Then, the glass slide was placed into an electrophoresis chamber, and prechilled alkaline electrophoresis buffer was poured in, ensuring that the liquid level was approximately 0.25 cm above the glass slide. Electrophoresis was performed for 30 min at 25 V. Subsequently, the glass slide was placed in neutralization buffer for three cycles, each lasting 10 min. Then, 30 µL of propidium iodide (PI) staining solution was added to each glass slide, and the sample was covered with a coverslip and stained for 10 min, avoiding light. Finally, the cells were observed and images were captured under a fluorescence microscope.
siRNA transfection
SIRT1-siRNA was designed and synthesized by Sangon Biotech. The SIRT1-siRNA sequences were as follows
Forward: 5’-GCGGGAAUCCAAAGGAUAAUUTT-3’.
Reverse: 5’-AAUUAUCCUUUGGAUUCCCGCTT-3’
Control-siRNA
Forward: 5’-UUCUCCGAACGUGUCACGUTT-3’
Reverse: 5’-ACGUGACACGUUCGGAGAATT-3’.
KGN cells were cultured in a 6-well plate until they reached 70-80% confluence. Then, siRNA, serum-free culture medium, and transfection reagent Lipo8000™ were diluted in the appropriate proportions. The siRNA mixture was added to the cells in the 6-well plate. The cells were transfected for two days, and then SIRT1 protein expression was assessed.
Western blot analysis
Murine ovarian tissue and drug-treated KGN cells were subjected to protein extraction in RIPA lysis and extraction buffer (Thermo, USA). Protein concentrations were quantified using the BCA protein assay kit (Thermo, USA). The protein samples were fractionated by SDS‒PAGE and then transferred to PVDF membranes (Millipore, USA). Subsequently, the membrane was blocked using 5% skim milk for 1 h. Then, the sections were incubated overnight at 4 °C with the corresponding primary antibodies, including pATM, PGC-1α, TERF2 (ABclonal, China), SIRT1, p53 (Proteintech Group, China), Bax, Bcl-2, and β-actin (HuaBio, China), and then probed with secondary antibodies. Protein chemiluminescence was detected using the ECL chemiluminescence reagent (Thermo, USA). Finally, exposure was performed using an exposure device.
Statistical analysis
The results are presented as the mean ± SEM. Statistical analysis was carried out using GraphPad Prism version 9.0 software, with data analysed using one-way analysis of variance (ANOVA) or independent sample t tests, as appropriate. Each group of samples underwent a minimum of three replicates, and statistical significance was defined as a P value < 0.05.


留言 (0)