
記住我


The BMP-activity assay was carried out as described before [25]. In brief, C2C12 cells were cultured in DMEM high-glucose, 10% fetal calf serum (FCS), 1% penicillin/streptomycin. After 24 h, cells were stimulated with 150 ng/mL BMP2 for 3 days in the presence of 500 nM compound A (CompA), LDN-212854 (LDN21) or the solvent DMSO at equal concentration. Cells were washed with PBS and lysed with 1% Triton-X-100 at 4 °C. Cell lysates (100 µL) were incubated with 100 µL of substrate solution (1 mg/mL p-nitrophenyl phosphate in 0.1 M glycine (Carl Roth, Germany), 1 mM MgCl2, and 1 mM ZnCl2 (all from Sigma Aldrich, Germany), pH 9.6). Absorbance was recorded at 405/490 nm (Sunrise, Tecan, Switzerland), enzyme activity was referred to a p-nitrophenol-derived standard curve (Sigma Aldrich, Germany) and normalized to protein levels determined in the same lysate by Pierce BCA Protein Assay Kit (Thermo Scientific, USA).
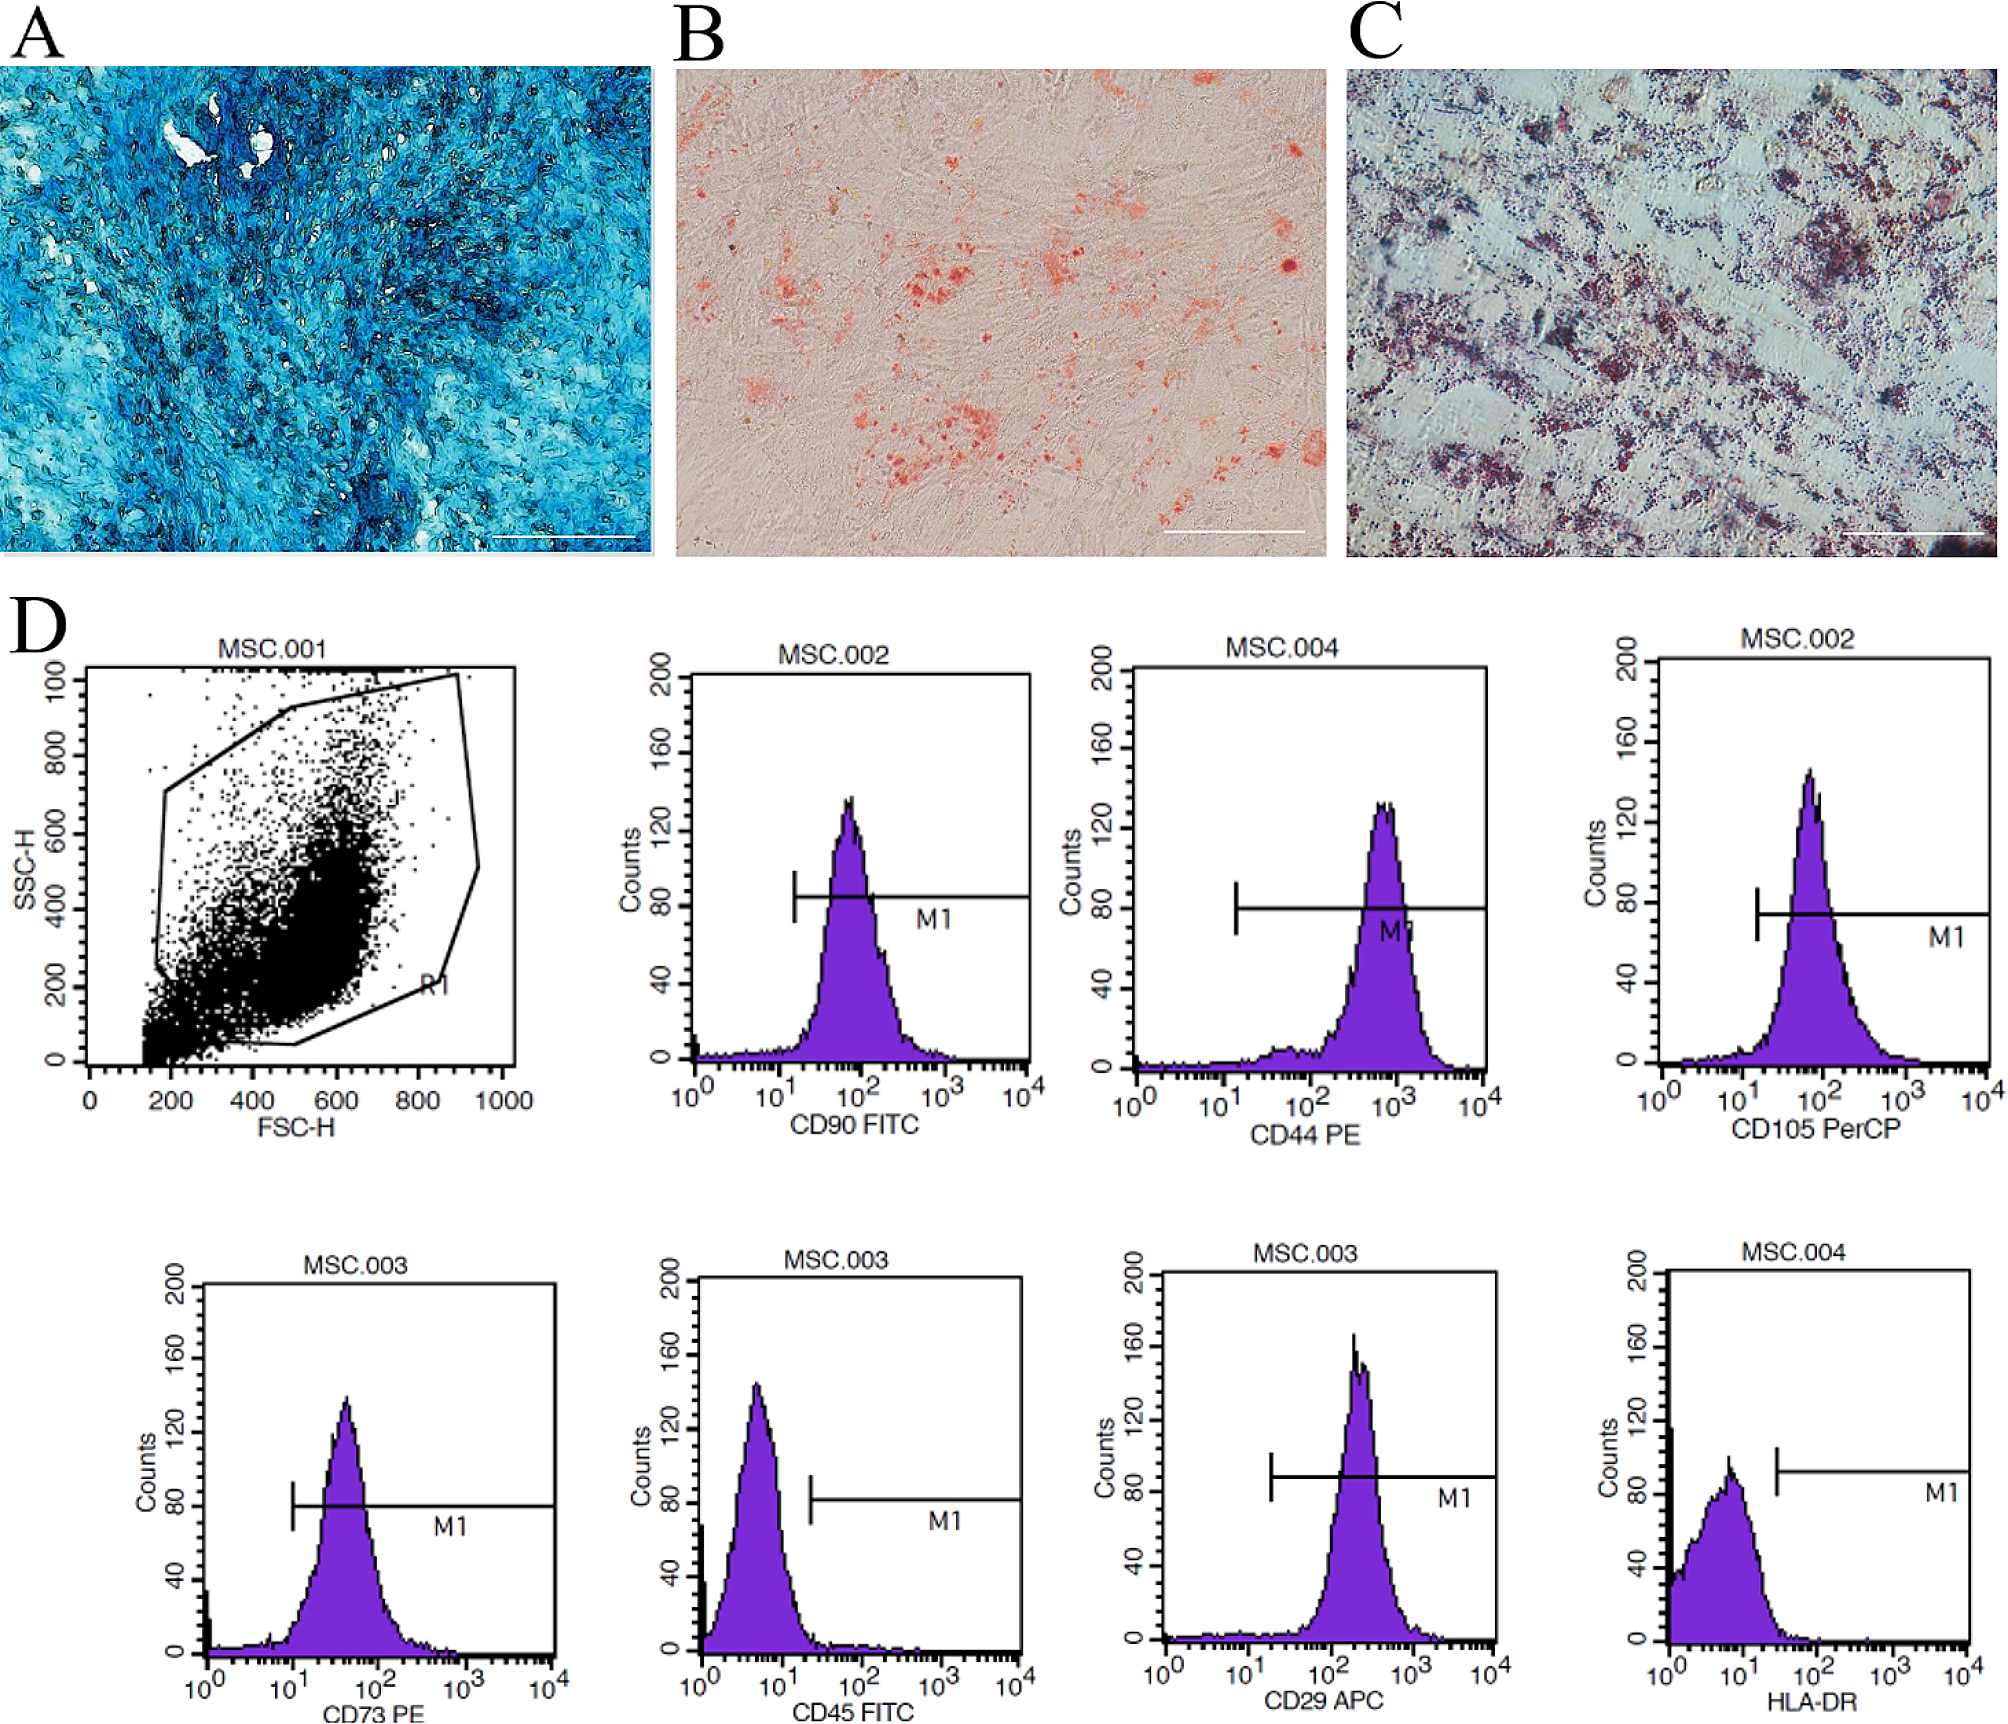
Isolation and expansion of MSCsFresh bone marrow aspirates from patients, age 35–82 (mean 55) years undergoing total hip replacement surgery were acquired with informed written consent of the patients. Samples were obtained after approval by the Ethics Committee on Human Experimentation of the Medical Faculty of Heidelberg University and in agreement with the Helsinki Declaration of 1975 in its latest version. MSCs were isolated, as described [2]. Briefly, samples were subjected to Ficoll Paque Plus density gradient centrifugation. The mononuclear cell fraction was seeded in expansion medium consisting of high-glucose Dulbecco’s modified Eagle’s medium (DMEM), supplemented with 12.5% FCS, 2 mM L-glutamine, 1% nonessential amino acids, 0.1% β-mercaptoethanol (all from Gibco, Life Technologies, Germany), 1% penicillin/streptomycin (Biochrom, Germany), and 4 ng/mL of recombinant basic fibroblast growth factor (Miltenyi Biotec, Germany). Cells were cultured for 2 passages at a seeding density of 5 × 10³cells/cm2.
Chondrogenic differentiationMSCs were cultured as 3D pellets (2.5 × 10⁵ or 5 × 10⁵cells/pellet) in chondrogenic medium (DMEM high-glucose (Gibco, Life Technologies, Germany), 0.1 µM dexamethasone, 0.17 mM ascorbic acid 2-phosphate, 5 µg/mL transferrin, 5 ng/mL selenous acid, 1 mM sodium pyruvate, 0.35 mM proline (all from Sigma Aldrich, Germany), 1% ITS+ premix (Corning, Germany) 1% penicillin/streptomycin, 10 ng/mL recombinant human TGF-β1 (Pepro-Tech or Miltenyi, Germany) for up to 4 weeks at 37 °C and 6% CO2. Cultures with 5 × 10⁵cells/pellet received daily medium exchange with or without 6 h of prior PTHrP(1–34) treatment (2.5 nM in water, Bachem, Germany) from day 7 onward as described before [9] (Fig. 2). Chondrogenic medium of cultures with 2.5 × 10⁵cells/pellet was supplemented with the BMP inhibitor compound A (compA, 500 nM in 0.02% DMSO, days 0–28, Novartis, Switzerland) as described before [24], LDN-212854 (LDN21, 500 nM in 0.02% DMSO, day 0–28, Sigma Aldrich, Germany), SB-431542 (SB43, 10 µM, Merck Millipore, Darmstadt, Germany) or the respective solvent. Medium was exchanged 3 times a week (Fig. 2).
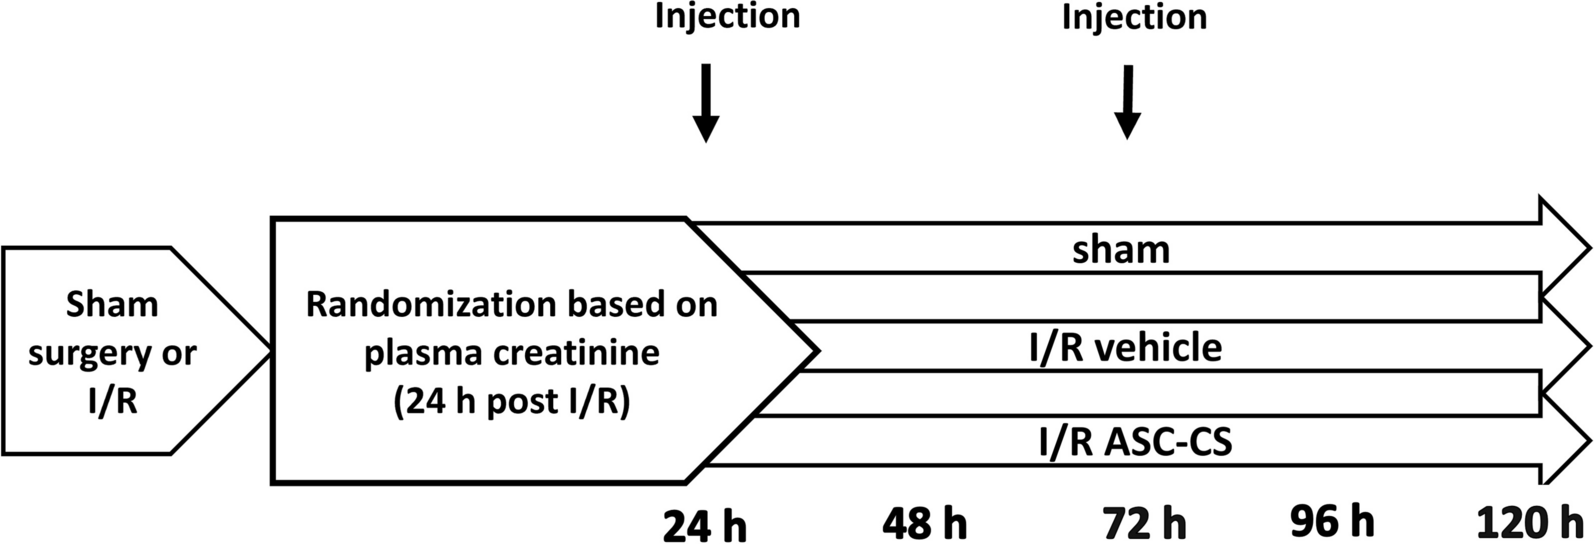
Fig. 2
Study design: In vitro treatment and time of ectopic implantation in vivo. MSCs in passage 2 were subjected to chondrogenic induction in the presence of the BMP inhibitors CompA (500 nM), LDN21 (500 nM) or with DMSO used as control. Medium was exchanged three times a week. The PTHrP pulse group was treated with PTHrP (2.5 nM) for the last 6 h before daily medium exchange from day 7 onward. Its control group (Co) also received daily medium exchanges starting on day 7
Quantitative real-time RT-PCRTotal RNA was extracted from three pooled pellets per donor population, group, and time point by guanidinium isothiocyanate/phenol extraction (peqGOLD Trifast, Peqlab, Germany), which was then reverse transcribed into cDNA using the reverse transcriptase Omniscript (Qiagen, Germany) and oligo(dT) primers. The expression levels of individual genes of interest were determined by quantitative real time PCR (qPCR, Roche Diagnostics, Germany or Stratagen, USA), primer pairs used for amplification are listed in Table 1. Genes were rated as expressed when gel electrophoresis of PCR amplificates showed a clear band at the correct height. Gene expression levels were calculated using the ΔCt method where the arithmetic mean expression of the reference genes CPSF6 and HNRPH1 was subtracted from the Ct value of the gene of interest. Percent reference gene was calculated as percentage of 1.8^(-ΔCt) and referred to solvent-treated (DMSO for CompA and LDN21 groups) or daily medium exchanged groups (Co for the PTHrP group) to give the fold-change value.
Table 1 Primer pairs for qRT-PCR analysis in alphabetical orderALP activityCulture supernatants conditioned for 2 days were collected, pooled, and 100 µL conditioned media were incubated with 100 µL of p-nitrophenyl phosphate substrate solution. ALP activity was determined as described above.
Western blottingCollagen extraction was performed as previously described [11]. In brief, one pellet per donor population and group was digested with pepsin solution containing 2.5 mg pepsin/mL in 0.5 M acetic acid and 0.2 M NaCl for 16 h. The pH was neutralized with 1 M Tris base prior to extraction of the collagens with 4.5 M NaCl (overnight at 4 °C, both Roth, Karlsruhe, Germany). After centrifugation, the pellets were resuspended in 400 µL precipitation buffer (0.1 M Tris base, 0.4 M NaCl) and the collagens precipitated for 4 h at -20 °C with 100% ethanol. After centrifugation, the pellets were resuspended in lysis buffer (50 mM Tris, 150 mM NaCl, 1% Triton X-100).
For SMAD protein detection, whole cell lysates were prepared from two pellets per group using Phosphosafe Extraction Reagent (Merck Millipore, Darmstadt, Germany) containing 1 mM Pefablock® SC (Sigma Aldrich, St. Louis, MO, USA). After centrifugation, supernatants were mixed with Laemmli buffer (33.2% (w/v) glycerol (Carl Roth, Karlsruhe, Germany), 249 mM Tris-HCl pH 6.8, 8.0% (w/v) sodium-dodecyl sulfate (SDS), 0.02% bromophenol blue (all Sigma Aldrich, St. Louis, MO, USA) and boiled.
Cell or collagen lysates were separated by denaturing SDS-PAGE (6% gels for collagens, 10% for SMADs) and proteins blotted onto a nitrocellulose membrane (Amersham™, GE Healthcare, Chalfont St Giles, United Kingdom). Membranes were cut horizontally to detect proteins of different sizes. For collagen detection, the lower part of the membrane was incubated with mouse anti-human type X collagen antibody (X53, 1:500, Quartett, Germany) and the upper part with mouse anti-human type II collagen antibody (II-4C11, 1:1000, ICN Biomedicals, USA). For SMAD detection, upper membrane parts were first probed with rat monoclonal anti-pSMAD1/9 antibody (pS463/pS465, pS465/pS467, 1:1,000, #562,508, BD Biosciences, East Rutherford, NJ, USA), or rabbit monoclonal anti-pSMAD2 (S465/467, 1:500, clone 138D4). For total SMAD detection, membranes were re-stained with rabbit monoclonal anti-SMAD1/5 (SMAD1: 1:500, ab33902; SMAD5: 1:1,000, ab40771; both Abcam, Berlin, Germany) or rabbit monoclonal anti-SMAD2/3 (1:250, clone D7G7, both Cell Signaling Technologies, Danvers, MA, USA). The lower membrane parts were probed with mouse monoclonal anti-β-actin (1:10,000, clone AC-15, GTX26276, GeneTex, Irvine, CA, USA). Proteins were visualized with HRP-conjugated goat anti-rat antibody (1:1,000, HAF005, Bio-Techne, R & D Systems, Minneapolis, MN, USA), peroxidase-coupled goat anti-mouse antibody (1:10,000, #115-035-071), or peroxidase-coupled goat anti-rabbit antibody (1:10,000, #111-035-046, both Jackson ImmunoResearch Laboratories, West Grove, PA, USA), using the ECL detection system (Roche, Germany).
In vivo mineralization modelAll animal experiments were approved by the local animal experimentation committee and carried out in accordance with European Laboratory Animal Science guidelines. The mineralization and bone formation activity of the pellets was tested in the standard subcutaneous model in immunocompromised mice. After 28 days of chondrogenic culture, two pellets per donor population (n = 4) and group were implanted into paravertebral subcutaneous pouches (one in a cranial pouch, one in a caudal pouch) of 10–12 week old female SCID mice (CB17/Icr-Prkdcscid/Crl, Charles River, Sulzfeld, Germany) to account for the biological variability and allow significant conclusions. For CompA and the respective control group, also day 14 pellets were tested. Four subcutaneous pouches were prepared per mouse and one pellet per pouch was implanted. In total, 46 pellets that were pretreated as indicated were implanted into 12 mice. Two additional control pellets generated under standard chondrogenic conditions (no DMSO, thrice per weak medium exchange) that were not included in the analyses were implanted in one mouse. None of the mice exhibited any adverse reactions to the presence of the implants and had to be excluded from the study according to the exclusion criteria defined in the animal license (e.g., behavioural abnormalities, infections, fever, severely disturbed general condition). Explants were harvested after 8 weeks and stored at -80 °C.
Microcomputed tomographyMicro-CT evaluation was used as primary outcome to assess in vivo mineralization. Explants were scanned with a Sky-Scan 1076 in vivo X-ray microcomputed tomograph against air in a custom-made humid chamber to prevent drying during scanning. Settings were: no filter, 49 kV, 250 µA, voxel size 9 μm, exposure time 900 ms, frame averaging 3. Pictures were recorded every 0.42 degrees rotation step through 360 degrees. NRecon® software (version 1.6.3.2, Skyscan) was used for reconstructing 3D pictures. CTAn® software was used for calculating the total volume (TV) and the mineralized volume (MV) in mm3 of scanned tissues. Background was defined by unspecific signals in scans against air, and an 8-bit grey level threshold of 25 was set to discriminate signals from background. To define a threshold value for tissue mineralization, comparative scans of mineralized explants and osteochondral biopsies were performed in PBS vs. air. Non-mineralized tissue was defined by being indiscernible from aqueous surroundings, and a grey level above 66 in scans against air was determined as threshold for mineralized tissue. This threshold was validated in scans of osteochondral biopsies. Mineralized tissue volume (MV) of pellets was referred to the total volume (TV) to calculate mineralization levels (MV/TV).
HistologyPellets and explants were fixed for 2 h in 4% formaldehyde. Explants (but not cultured samples) were partially decalcified for 2 h with Bouin’s solution. Samples were dehydrated in a graded isopropanol series and paraffin-embedded. 5 μm tissue sections were deparaffinized, rehydrated and stained with 0.2% (w/v) Safranin O (Fluka, Sigma Aldrich, Germany) in 1% acetic acid, or alizarin red-S (0.5% in water) using Certistain Fast Green (Merck, Germany, 0.04% (w/v) in 0.2% acetic acid) as counterstain, following standard protocols. An overview staining was performed by haematoxylin and eosin staining according to standard protocols. Immunohistology was performed as described [2]. Briefly, rehydrated 5 μm tissue sections were treated with 4 mg/mL hyaluronidase in PBS, pH 5.5 and 1 mg/mL pronase (both from Roche Diagnostics, Germany), blocked with 5% bovine serum albumin (Sigma Aldrich, Germany) and stained with anti-human type II or I collagen antibody (1:1,000, clone II-4C11, ICN Biomedicals, Germany; or Abcam, Germany), followed by biotinylated goat anti-mouse antibody (1:500, Dianova, Germany) and streptavidin alkaline phosphatase fast red (Roche Diagnostics).
Histological scoringHaematoxylin-eosin stained paraffin sections of explants were scored by six blinded scorers to identify and semi-quantify bone formation as well as haematopoiesis. Haematopoiesis was defined as areas with marrow-cavity-like structures with the presence of haematopoietic cells and lymphocytes and evaluated in relation to the whole section. Bone was defined as dense, plain structure with osteocytes and evaluated in relation to the whole section. The semi-quantitative score ranged from 0 to 3 with the following definition: (0) non-existent, (1) low: 0–30% of the section area, (2) intermediate: 30–60%, (3) high: 60–100% of the scored section area. Mean scores for each treatment regimen were calculated for each scorer for statistical evaluation.
StatisticsResults are shown as median values and are depicted as boxplots, with each box representing the interquartile range (IQR) extending between the 25th and 75th percentiles and lines inside the boxes representing the median. Whiskers extend to minimum and maximum values, outliers (between 1.5xIQR and 3xIQR) are depicted as ○, and extreme values (> 3xIQR) as ◊. Statistical significance between two groups was calculated using Mann-Whitney U test. Where indicated, the p value was adjusted for multiple comparisons using Bonferroni correction. For time courses, data are given as the mean ± standard deviation. A probability value of p ≤ 0.05 was considered statistically significant. All statistical tests were calculated with SPSS 25.0 (IBM, Germany).
留言 (0)