
記住我

To evaluate clinical response associated with the SC and SL administration of apomorphine, we used the PK/PD model relating the circulating apomorphine concentrations to the changes in the Unified Parkinson’s Disease Rating Scale (UPDRS) motor scores (UPDRS Part III), a standardly used rating scale in Parkinson’s disease clinical trials [16]. Part III of the scale is a clinical evaluation of motor symptoms with score changes from full OFF to full ON exceeding 10 or more points [12, 17]. The PK model developed by the FDA for SC apomorphine, the recently published PK model for SL apomorphine, and the FDA-developed PK/PD model of apomorphine were used in the analysis [12, 14, 15].
The recommended dose for the SC administration of apomorphine ranges from 2 to 6 mg, and the recommended dose for the SL administration ranges from 10 to 30 mg [6, 7]. Given the differences in the PK characteristics between two formulations [12, 14, 15], the PK/PD relationships were explored at a range of dose levels: 1 mg, 2 mg, 3 mg, and 4 mg for the SC administration and 20 mg, 30 mg, 40 mg, and 50 mg for the SL administration. The goal in including higher than recommended doses for SL and lower than recommended doses for SC was to demonstrate that the results of the model apply even at the highest levels of exposure for SL and lowest levels of exposure for SC. This comparison serves to advantage the SL dosage form and disadvantage the SC dosage form by comparing efficacy for what could be considered supratherapeutic doses of SL and subtherapeutic doses of SC. The expected apomorphine plasma concentrations and UPDRS motor scores (Part III) for the SC and the SL formulations of apomorphine were simulated for 500 subjects for each dose level.
To evaluate the impact of the inter-individual variability (IIV) in the predicted PK and in the PK/PD time course, three levels of IIV were considered (with 15%, 30%, and 45% coefficient of variation [CV]). Simulations were performed for each formulation, dose level, and level of IIV.
The clinical benefit was evaluated by comparing parameters qualifying the response to treatment (change from baseline UPDRS motor score) estimated for SC and SL administration over the interval 0 to 90 min post-dose using trial simulations. These parameters included: 1) time to clinically relevant response (defined as a change from baseline in the UPDRS motor score of − 3.25 units [18]); 2) response duration (a time period during which the change from baseline in the UPDRS motor score remained ≥ − 3.25 units); 3) area under the curve for the change from baseline in the UPDRS motor score; 4) maximal change from baseline in the UPDRS motor score; and 5) time to the maximal change from baseline of the UPDRS motor score.
The simulations were conducted using NONMEM® software (version 7.4, ICON Development Solutions). The analyses were conducted using R (version 4.0.0); the summary statistics were generated using SAS® (version 9.4).
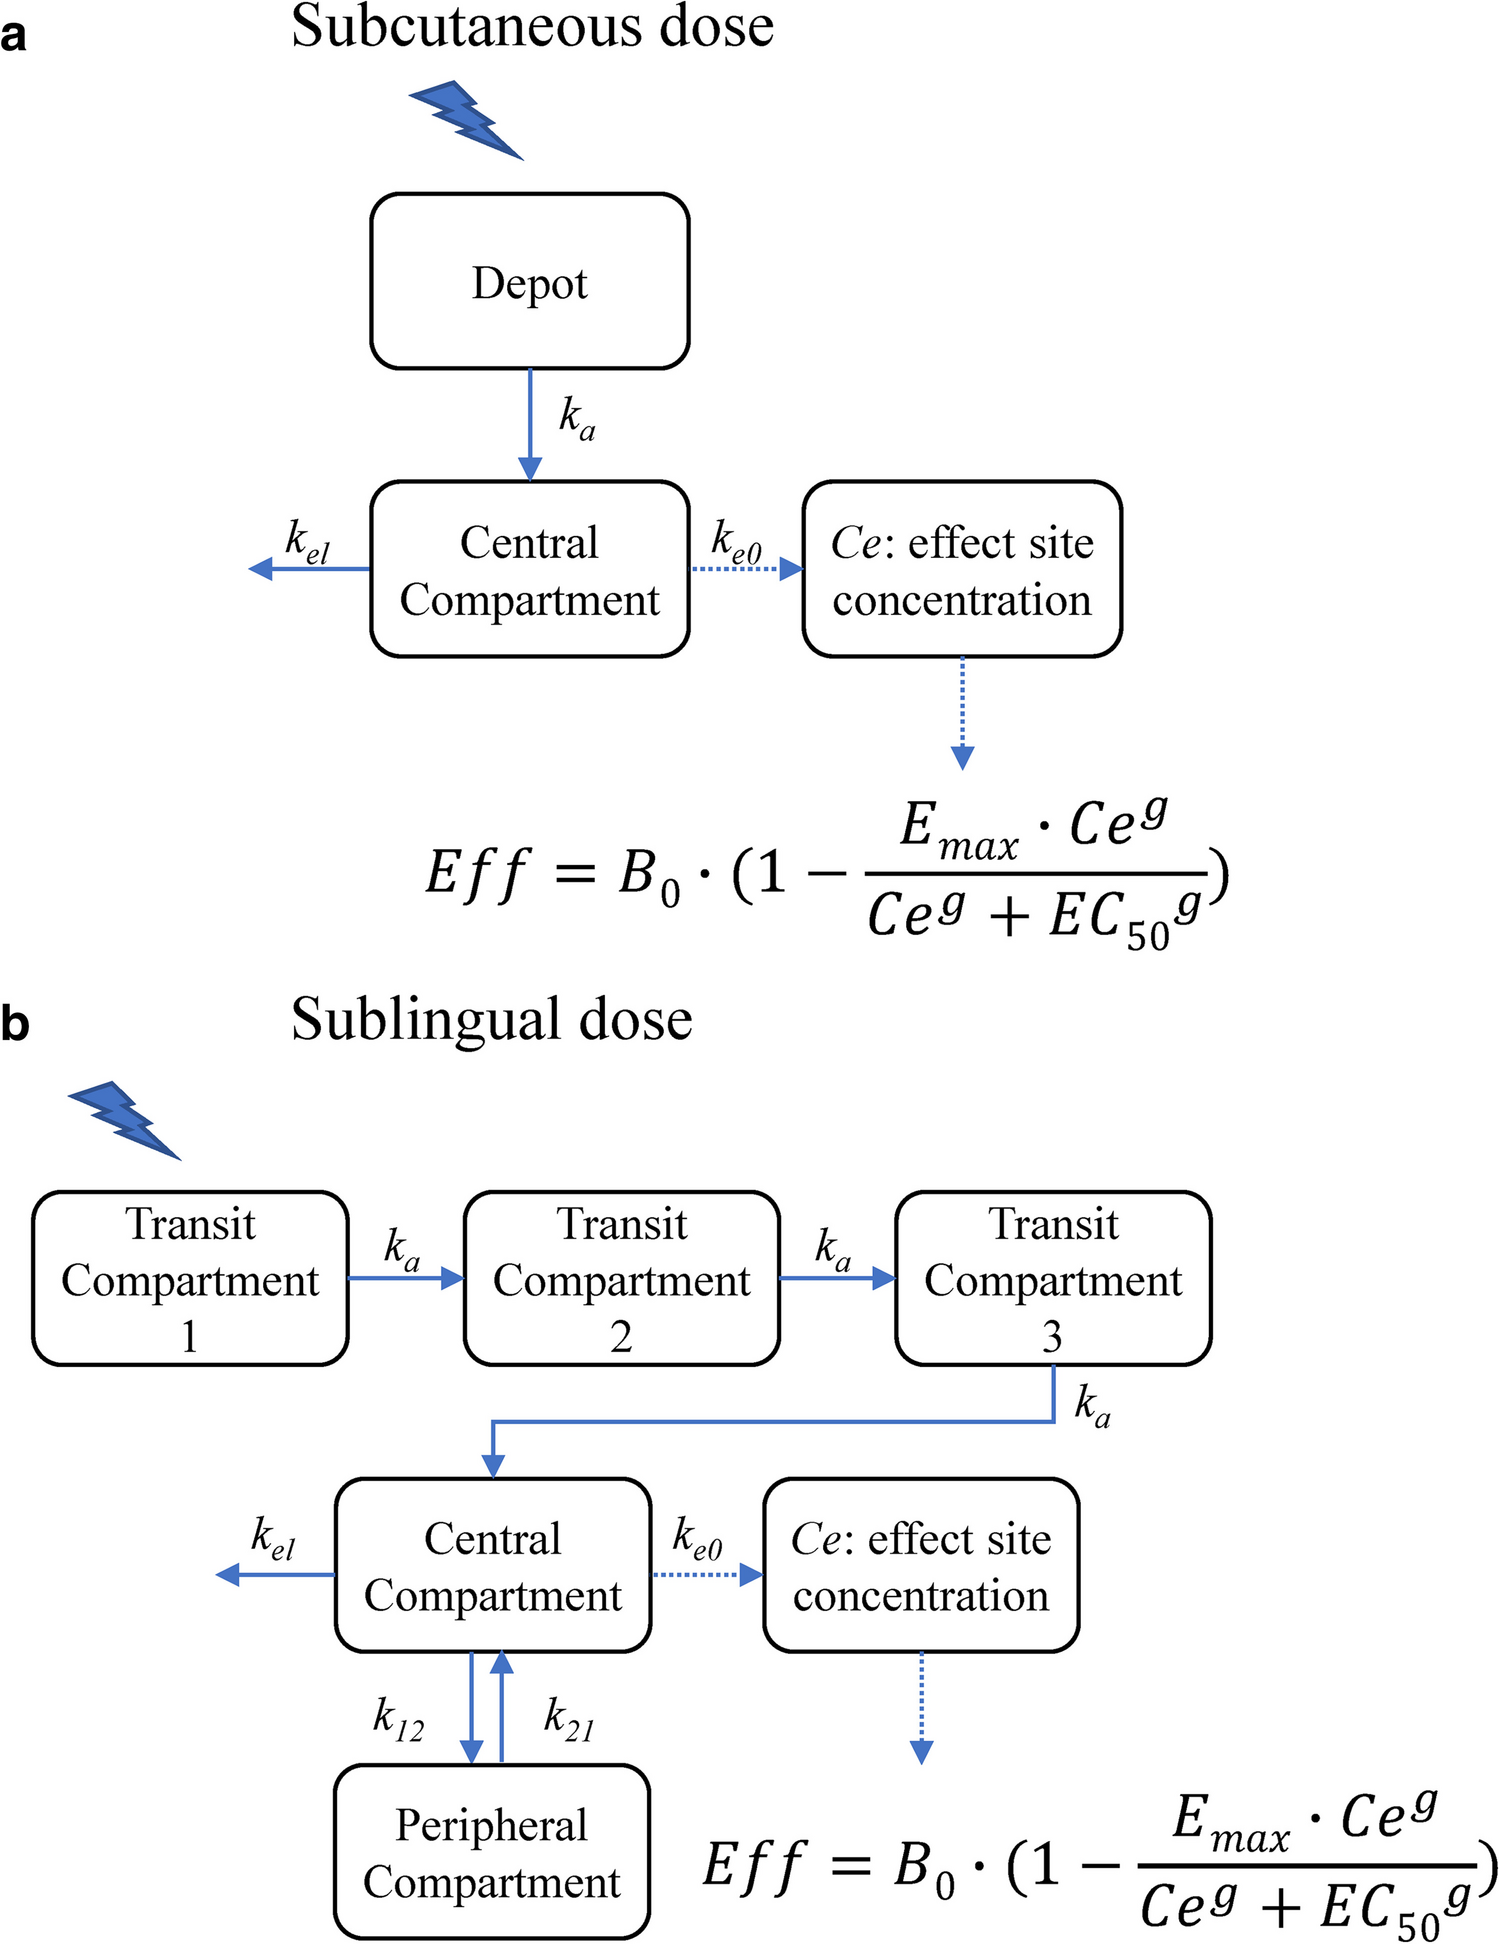
PK model for SC apomorphineThe PK time course of apomorphine after SC administration was best described by a one-compartment model with first-order absorption and elimination processes (Fig. 1a) [14, 15]. The model was defined by two differential equations:
Fig. 1
a Schematic of the apomorphine PK model following subcutaneous administration. Abbreviations: B0, baseline motor score; Ce, drug concentration at the site of action; EC50, drug concentration that causes 50% of the maximum effect; Emax, maximum inhibitory effect; g, Hill’s sigmoid coefficient; ka, first-order absorption constant; ke0, first-order plasma-effect-site equilibration rate constant; kel, elimination constant; PK, pharmacokinetics. b Schematic of the apomorphine PK model following sublingual administration. Abbreviations: B0, baseline motor score; Ce, drug concentration at the site of action; EC50, drug concentration that causes 50% of the maximum effect; Emax, maximum inhibitory effect; g, Hill’s sigmoid coefficient; k12 and k21, first-order transfer rate constants between the central and peripheral compartments; ka, first-order absorption constant; ke0, first-order plasma-effect-site equilibration rate constant; kel, elimination constant; PK, pharmacokinetics
$$\begin\frac=-k_a\cdot A\\\frac=k_a\cdot A-k_\cdot C\\Cp=\frac C\end$$
A and C are the amounts of drug in the depot and central compartments, ka and kel are the first-order absorption and elimination rate constants, V/F is the volume of distribution, F is the bioavailability (assumed equal to one), and Cp is the drug concentration in the central compartment.
PK model for SL apomorphineThe PK time course of apomorphine after a SL administration was best described by a two-compartment model with a delayed absorption process, which was described by a transit compartments model, a first-order distribution from/to a peripheral compartment, and a first-order elimination rate constant (Fig. 1b) [12]. The model was defined by five differential equations:
$$\begin\frac_1}=-k_a\cdot T_1\\\frac_2}=k_a\cdot\left(T_1-T_2\right)\\\begin\frac_3}=k_a\cdot\left(T_2-T_3\right)\\\frac=k_a\cdot T_3-k_\cdot C-k_\cdot C+k_\cdot P\\\begin\frac=k_\cdot C-k_\cdot P\\Cp=\frac C\end\end\end$$
T1, T2, and T3 are the amount of drug in the transit compartments, C and P are the amount of drug in the central and peripheral compartments, ka and kel are the first-order absorption and elimination rate constants, k12 and k21 are the first-order transfer rate constants between the central and peripheral compartments, V/F is the volume of distribution, F is the bioavailability, and Cp is the drug concentration in the central compartment.
PK/PD modelThe model relating the apomorphine plasma concentration to the UPDRS motor scores was developed based on the observation that the UPDRS time course was not directly related to the time course of apomorphine plasma concentrations. Therefore, a "link model" approach was used to implement the PK/PD model and to estimate the drug concentration in the effect-site compartment [19]. The basic assumption of this model is that the rate of drug distribution to/from the hypothetical effect site determines the rate of onset/offset of the effect.
$$\begin\frac=_\cdot \left(Cp-Ce\right)\\ Eff=_\cdot \left(1-\frac_\cdot ^}^+_}^}\right)\end$$
B0 is the baseline motor score, Emax is the maximum inhibitory effect, Cp is the apomorphine plasma concentration predicted by the PK model, Ce is the drug concentration at the site of action, EC50 is the drug concentration that causes 50% of the maximum effect, g is the Hill’s sigmoid coefficient, and ke0 is the first-order plasma-effect-site equilibration rate constant.
The mean population PK parameters used for these simulations were estimated in the reference publications describing the respective PK model for each formulation (Table 1) [12, 14, 15]. There were no covariates used in the simulations.
Table 1 Mean population PK values estimated in the reference publications for the SL and SC formulations of apomorphine [11,12,13]Additionally, the mean population PK/PD parameters describing the longitudinal change in the UPDRS motor score as a function of apomorphine exposure estimated in the reference publications are summarized in Table 2 [14, 15].
Table 2 Mean population PK/PD values describing the longitudinal change in the UPDRS motor score as a function of the apomorphine exposure estimated in the reference publications [12, 13]
留言 (0)